Changement climatique - Réchauffement climatique
de
en
fr
 Nouvelles informations
Extraits de
"Internet-Erkunden:
Klimawandel / Climate Change / Changement climatique"
Changement climatique -
La cause en est le soleil et non pas le
CO2
Cherchons à comprendre!
Le CO2 d'origine humaine ne cause
pas de réchauffement climatique!
Plus de 35'000 scientifiques dont au moins 70 lauréats du prix
Nobel ont signé des pétitions analogues.
Controverse: Activité solaire vs. le CO2
A:
2
La panique
avec
3
Le comité GIEC (IPCC) et Al Gore
B:
4
Critique: "La grande escroquerie du
réchauffement climatique"
Le soleil est à l'origine du changement climatique!
5
Réchauffement climatique - c'est le soleil!
6
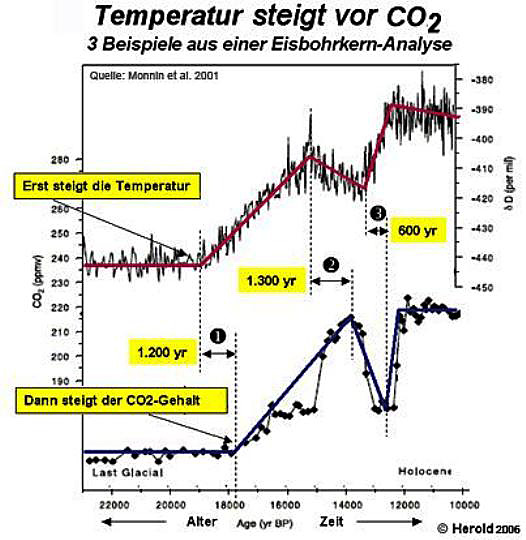
La température fait monter le CO2
(La température d'abord et après le CO2 et
pas inversement)

Auf die Bilder klicken / Click on the images / cliquer sur les images
cliquer sur l'image
La réalité
Il n'y a pas de preuve scientifique qui pourrait justifier le réchauffement climatique par le CO2. L'homme ne peut pas influencer le climat. L'hystérie collective n'est pas justifiée.
7
Pas d'influence du CO2 et de l'énergie fossile
8
Aspects physiques
9 Températures: La "coube bâton hockey" est fausse

cliquer sur l'image
Images ci-dessus: Les températures de la "courbe bâton de hockey"
de la base du protocole de Kyoto sont fausses!
(à gauche la courbe selon Wikipedia, à droite la coube corrigée)
10 Concentration du CO2: Le protocole de Kyoto est basé sur des fausses courbes
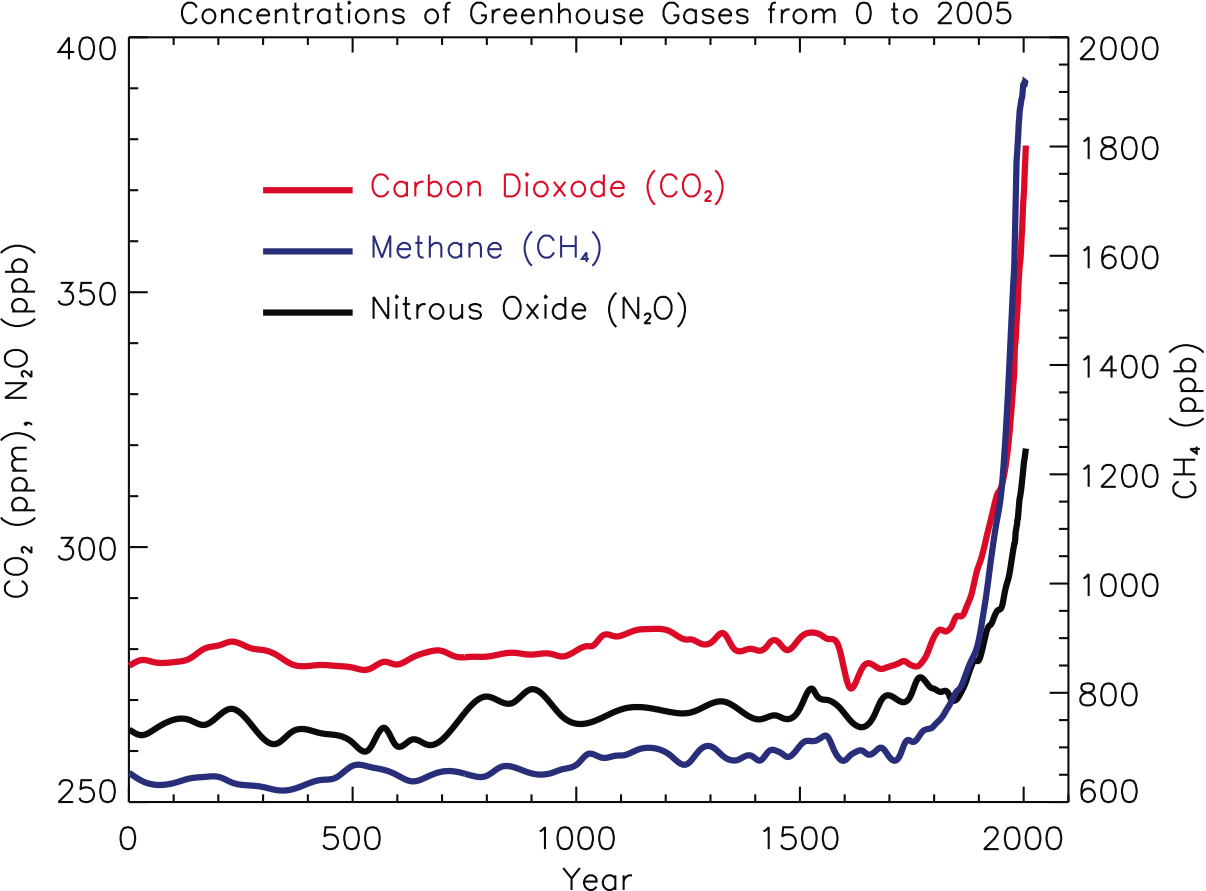
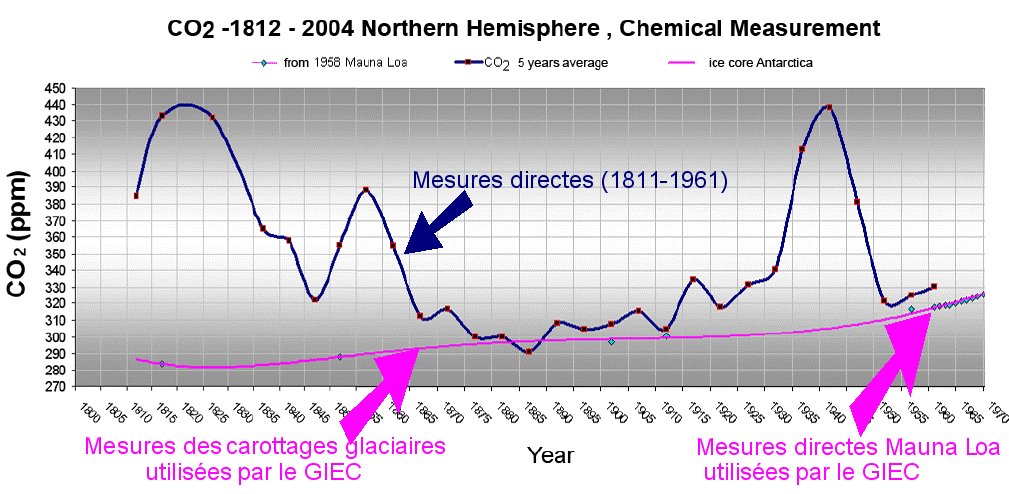
cliquer sur l'image
Images ci-dessus: Les concentrations du CO2
du protocole de Kyoto (à gauche) sont faux!
(sur le diagramme de droite on peut voir que la concentration du
CO2 était plus importante dans le passé)
| de |
▶ Internet-Terror: Manipulation von Wikipedia durch einen Administrator ▶ Das Lexikon der Lügen ▶ Vom Onlinelexikon zur Propagandamaschine: Zensur, Einschüchterung und arglistige Täuschung ▶ Wikipedia: Klima-Fälscher Connolley: Der Mann, der unser Weltbild umschrieb ▶Die dunkle Seite von WIKIPEDIA: EIKE Zensur - kurz und knapp [Who is who (Skeptische Institute): EIKE; Wikipedia: Websites, Opfer: EIKE, Manipulatoren: Andol] |
|||||
|---|---|---|---|---|---|---|
| en |
▶ At Wikipedia, one man engineers the debate on global warmingator |
|||||
| fr |
▶ A Wikipedia, un homme dirige le débat sur le réchauffement climatique et à sa manière |
Toutes les prédictions des inventeurs de cette panique sont fausses
12
Conséquences du changement climatique
Le niveau des océans a monté pendant les derniers 150 ans mais ont tendance à baisser de nouveau!
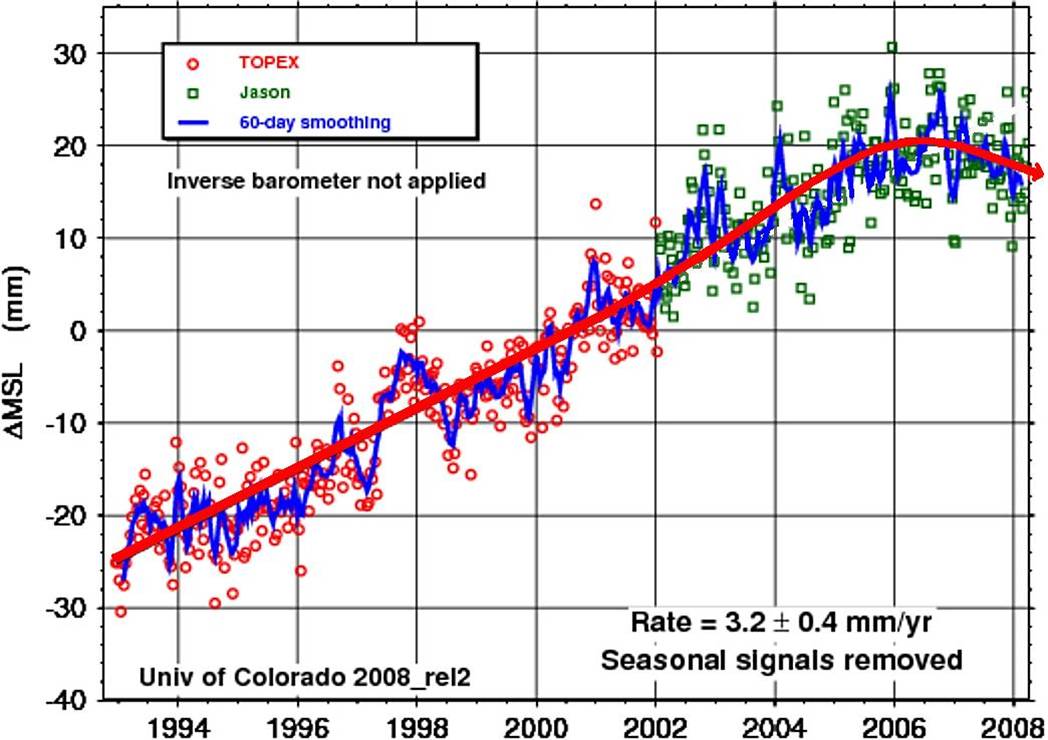
cliquer sur l'image
Histoire du climat
C'est le soleil et pas le CO2 qui est fait changer le climat!


cliquer sur l'image
14 Mesurage de température et relevé de température
Il fera (malheureusement) plus froid
Pas demain, puisque nous parlons du climat et non du temps,
mais dans les prochains 10, 50 ans.
15
Le Climat actuel
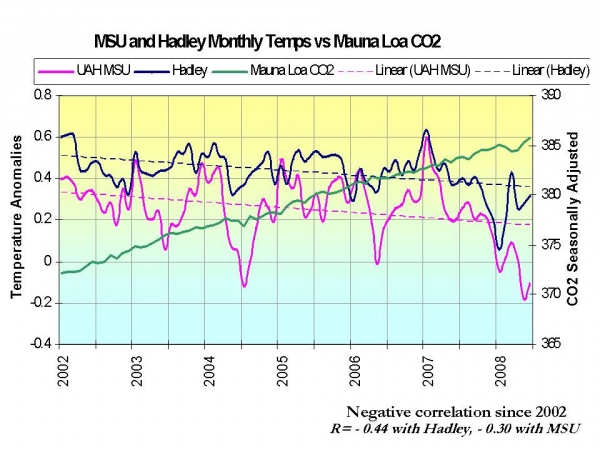
Les températures baissent pendant que le CO2
contunue à monter!
16
Hypothèses pour le futur
Attention: Il fera de nouveau plus froid!

![]()

Informations
17
Sites sur le web
18
Vidéos
19
Manifestations, pétitions et coalitions
20
Instituts et organisations sceptiques
21
Politiques et gouvernements sceptiques
22
Qui est qui
1 Introduction
Pensée unique
fr Petite histoire du réchauffement planétaire et le débat en cours ...
Historique
-
Voici l'historique résumé de cette affaire de réchauffement
climatique qui fait la une des médias et mobilise les discours
de nos hommes politiques qui battent leur coulpe en affirmant
que l'homme en est le seul responsable...
... martelée jours après jours, on est arrivé au point que plus personne ne met en doute la véracité de ce qui nous est affirmé. Jusqu'à établir des bilans chiffrés de cette catastrophe écologique "si nous ne faisons rien" qui se montent jusqu'à des milliers de milliards (comme en 1970 où on prévoyait un nouvel âge glaciaire) ! (Rapport de Sir Stern, UK). -
En 1988 a été créé, avec les soutien actif des américains, le GIEC
(IPCC en anglais), le Groupe Intergouvernemental d'Experts pour
l'Etude du Climat.
Initialement créé sans à priori scientifique, il évolue rapidement sous l'influence de James Hansen et recentre ses efforts sur les conséquences possibles des rejets de gaz carbonique CO2 anthropique (résultant de l'activité humaine) sur l'évolution du climat.
Cet organisme, qui impliquait de nombreux et éminents scientifiques, tenait jusqu'en 1995 des propos très mesurés. Les choses ont évolué depuis lors.
Les politiques ont pris le dessus. Restent, en tant que scientifiques, des experts en botanique, économie, sociologie, biologie, environnement et autres sciences s'intéressant aux conséquences d'un réchauffement climatique.
Par contre, les climatologues de renom y sont devenus minoritaires et plusieurs d'entre eux ( Richard Lindzen, Christopher Landsea, Pielke, Christy et Reiter par exemple) en ont démissionné au motif "que le processus est motivé par des objectifs préconçus et qu'il est scientifiquement non fondé".
Le rapport du GIEC (IPCC)
-
Le GIEC (IPCC) rédige périodiquement un
rapport résumé destiné
aux politiques. Ce rapport est intitulé "Summary for policymakers".
Deux phrases clefs (pour les scientifiques du GIEC) ont été délibérément supprimées, au tout dernier moment, du "résumé pour les politiques" qui est sorti en 1996. ces deux phrases sont significatives d'une part de l'honnêteté et de la retenue des climatologues du GIEC (de l'époque) dans cette matière de réchauffement climatique et d'autre part de la volonté politique de quelques uns (dont le président lui-même) de dramatiser les conclusions de ce rapport.
Voici ce deux phrases retirées du rapport final:
- Aucune des études citées dans ce rapport n'a démontré clairement que nous pouvons attribuer le changement climatique observé aux gaz à effet de serre. (NDLR : c'est à dire le CO2, le méthane etc.)
- A ce jour, il n'existe aucune étude prouvant que tout ou partie du changement climatique résulte des activités humaines.
NDLR : Ces deux phrases qui relèvent de l'honnêteté des scientifiques avaient déplu à certains rédacteurs du rapport final "pour les politiques". Notons qu'à l'aube de 2007, l'effet de serre d'origine humaine n'a toujours pas été prouvé, contrairement aux affirmations répétées de nombreux hommes politiques, écologistes et autres comme Al Gore, Stern et Hulot qui vous disent que cela ne fait aucun doute... et qu'il faut consacrer des milliards à l'écologie (et aux produits dérivés)!
- Pensée unique fr Petite histoire du réchauffement planétaire
Le débat en cours
- La température au sol de notre planète se réchauffe progressivement depuis au moins un siècle. Typiquement +0,7 °C en 100 ans. Cela semble être un fait, aux erreurs de mesure près. Cela s'est déjà produit à plusieurs reprises dans l'histoire de la terre mais les tenants de l'effet de serre affirment que cela résulte, cette fois-ci, de l'effet de serre provoqué par le CO2 résultant de l'industrie humaine. Ils proposent de limiter ou d'arrêter les émissions de ce gaz à effet de serre avec les conséquences que l'on imagine.
- Les opposants à la théorie de l'effet de serre affirment que l'homme n'y est pour rien et que le réchauffement provient de causes parfaitement naturelles (dont ils donnent une explication), que des phénomènes identiques se sont déjà produit plusieurs fois au cours des millénaires passés. Ils ajoutent que limiter la production de CO2 n'aura aucune conséquence positive sur le climat mais que celle-ci peut être négative en limitant la croissance des végétaux et en nuisant à l'environnement.
Le SOLEIL
-
Ne faisons pas durer le suspense. Disons le tout de suite :
pour les opposants à la théorie de l'effet de serre,
le grand responsable du réchauffement actuel (et aussi des
réchauffements et des refroidissements passés), c'est tout
simplement... le SOLEIL !
Pour eux encore, le CO2 émis par l'homme n'a qu'une influence négligeable dans cette affaire !
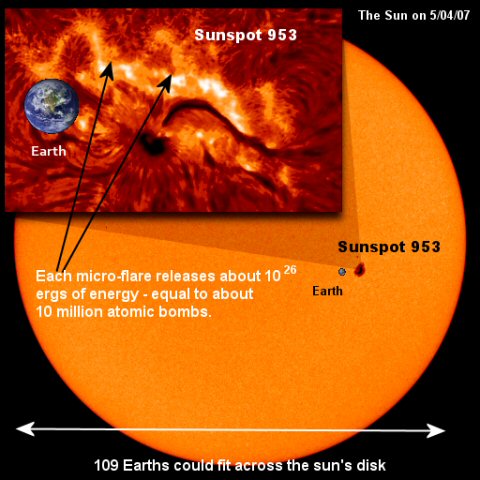
La bombe H
- Tout est de la faute aux éruptions solaires que vous voyez nettement sur l'image comme des taches plus brillantes que le reste de l'astre. Vous ne pouvez évidemment les voir à l'oeil nu car cela vous brûlerait la rétine.
-
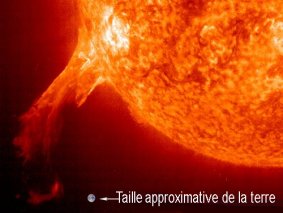
- De fait, le soleil n'est rien d'autre qu'une gigantesque bombe atomique, une bombe H pour être précis. Une bombe H dont la taille est d'un million de fois celle de la terre et qui brûle 600 millions de tonnes d'hydrogène par seconde. C'est d'ailleurs ce que nous essayons de reproduire, à toute petite échelle, sur terre dans le projet ITER à Cadarache. Ce sera sans doute très difficile, mais c'est un enjeu extraordinaire pour le futur du genre humain. Si l'homme parvient à domestiquer l'énergie de fusion (après avoir domestiqué celle de fission), les problèmes d'énergie seront résolus pour longtemps sur notre planète.
Corrélation entre la durée des cycles solaires et la température du globe
- Des chercheurs astrophysiciens Danois qui travaillent depuis une dizaine d'années sur ce problème ont eu l'idée originale de tracer sur un même graphique la température moyenne du globe de 1750 à 2000 (courbe blanche ci-contre) et la durée des cycles solaires pendant la même période (en jaune sur le même graphique).
-

- A moins d'être aveugle, on voit que cela a bien l'air d'être le cas !
- Pensée unique fr Le débat en cours sur le réchauffement climatique sous la loupe ...
L'effet de serre remis en question par des physiciens théoriciens !
- Le crédo de l'effet de serre est très sérieusement contesté par des physiciens théoriciens et thermodynamiciens qui expliquent que la théorie de l'effet de serre ne tient pas la route, viole les lois fondamentales de la physique et que certains calculs de température qui ont conduits aux chiffres mille fois répétés, sont absolument faux...
- Pensée unique fr L'effet de serre remis en question par des physiciens théoriciens!
- Pensée unique fr Paroles de grands chercheurs sur le réchauffement climatique
- Pensée unique fr Sept bonnes raisons de douter de l'effet de serre anthropogénique
⇒ Kontroverse über die Ursache des Klimawandels: Präsentationen (Videos)
2 La panique
Vidéos
de Aus der Panik-Küche en From the panic laboratory fr De la marmite des alarmistes
-
Al Gore: An Inconvenient Truth, YouTube Video
de Eine unbequeme Wahrheit
en
An Inconvenient Truth
fr
Une vérité qui dérange
![]() Inconvenient Truth for Al Gore
Inconvenient Truth for Al Gore
-
Le réchauffement climatique, une affaire de tous.
Depuis cinq à sept ans, les glaciers de l'Alaska fondent deux fois plus vite suite au réchauffement climatique.
Ce changement aura pour conséquence l'extinction de plus d'un million d'espèces terrestres dans les 50 prochaines années.
YouTube Video (03:51)
fr: Réchauffement climatique
-
L'humanitée est à l'aube de son extinction.
Les données scientifiques sont indiscutables.
En cas de poursuite du réchauffement climatique, nous devons nous attendre à des retombées catastrophiques.
Le compte à rebours a commencé.
YouTube Video (7:26)
fr: urgence climat
-
Le réchauffement climatique de la terre - à qui la faute?
Quel seront les conséquences?
Quoi faire? Est-il déjà trop tard?
YouTube Video (04:30)
fr: Réchauffement climatique
de Globale Verdunkelung
en Global Dimming
fr Assombrissement global
-
3sat
de
 Schatten über der Erde
-
BBC - Horizon
2005 en
2005 - Global Dimming
-
Arte
fr
L'obscurcissement planétaire
DVD de Globale Verdunkelung (ARTE) - Klimaerwärmung außer Kontrolle
| de | en | fr |
|---|---|---|
| Klimawandel: Probleme | Climate change: Problems | Changement climatique: Problèmes |
| Horror-Voraussagen und Schuldzuweisung | Horror-predictions and accusations | Prévisions horrifiantes et accusations |
3 Le comité GIEC (IPCC) et Al Gore
Inaccuracies in Al Gore's An Inconvenient Truth
-
The New Party:
Inaccuracies in Al Gore's An Inconvenient Truth
- Video 05:08 en Al Gore and the Global Warming Errors
-
Video en
Al Gore Finds Truth Inconvenient (04:13)
Al Gore estimates flooding of 20 feet (6,1 m)
- Video en Al Gore Snowjob (05:00)
- Video en Global Warming Hoax (09:20)
Extract of the Al Gore Nobel Lecture on 10 December 2007
- en: However, despite a growing number of honorable exceptions, too many of the world's leaders are still best described in the words Winston Churchill applied to those who ignored Adolf Hitler's threat: "They go on in strange paradox, decided only to be undecided, resolved to be irresolute, adamant for drift, solid for fluidity, all powerful to be impotent."
- de: "Politiker, die jetzt noch nicht begriffen haben, dass die Klimaerwärmung die größte Herausforderung der Menschheit ist, verhalten sich so, wie Politiker, die die Gefahr, die von Hitler ausging, nicht wahrhaben wollten."
-
Nobelprize.org:
Nobel Lecture (Website)
Nobel Lecture (Video)
The Lecture in Text Format
4 "La grande escroquerie du réchauffement climatique"
-
Le réchauffement de la planète est indéniable.
Nous en vivons les conséquences quotidiennement ... mais en sommes-nous entièrement responsables?
Le soleil démontre plus d'activité depuis 1940, en termes d'éruptions solaires (nombre et force) que dans les 1'150 dernières années!
Ceci n'affecte pas uniquement la terre, mais bien le système solaire en entier.
On assiste donc à un réchauffement du système solaire.
Saturne - Vénus - Jupiter - Mars - Neptune - Uranus - Pluton
YouTube Video (04:43)
fr Réchauffement climatique
1975: "Global Cooling"
- AOL Video: 1975 - Global Cooling: The Coming Ice Age
Videos concerning CO2
- en YouTube: CO2 Propaganda
- en YouTube: Al Gore Debates Global Warming
- en YouTube: CO2 theory is nonsense
| de | en | fr |
|---|---|---|
|
Klimawandel: Probleme Der Klimaschwindel |
Climate change: Problems The Great Global Warming Swindle |
Changement climat.: Problèmes La grande escroquerie du réchauffement climatique |
5 Réchauffement climatique - c'est le soleil!
- en These new findings demonstrate that the sun alone can account for all the observed warming early in the century
- fr Le grand responsable du réchauffement actuel (et aussi des réchauffements et des refroidissements passés), c'est tout simplement... le SOLEIL!
- john-daly.com en Global Warming - from the Sun
-
Pensée unique (Jean Martin)
fr Le débat en cours sur le réchauffement climatique sous la loupe ...
Sonnenaktivität, kosmische Strahlung und Wolkenbedeckung
en Solar activity, cosmic rays and clouds
fr Activité solaire, rayonnement cosmique et nuages
Klima-Beobachtungen
en
Climate Observations
fr
Observations sur le climat
- 1 de
Aktueller Temperaturstillstand
en Hiatus in Global Warming
fr Hiatus dans le réchauffement climatique
- a CO2 Konzentration und Temperatur vor 600 Millionen Jahren
- b Entwicklung seit 100'000 Jahren
- c Temperaturverlauf der letzten 20'000 Jahre in Grönland
- d Holozän
- e Arktischen Meereises in den 1960er Jahren
- a de
400 Jahre Sonnenflecken-Beobachtung
en 400 Years of Sunspot Observations - b de Fakten zum Klimawandel seit der Kleinen Eiszeit
- c de Sonnenstrahlung
- d de Sonnenstrahlung und Temperaturentwicklung
- e de Effektiv an die Erdoberfläche gelangende Solarstrahlung
- f de Magnetfelder der Sonnenflecken
- a 1000 Jahre Eddy Zyklus
- b Weizenpreise und Sonnentätigkeit (William Herschel entdeckte den Zusammenhang)
- c Solare Zyklen in der deutschen und der globalen Temperaturmessreihe
- a de Die Pazifisch Dekadische Oszillation (PDO)
- b en PDO: We Can't Think of Anything Else It Could Be
- c de Sechzig-Jahres-Ozeanzyklus jetzt auch in der Meeresspiegelentwicklung gefunden
- d de Trends der ozeanischen Zyklen und langfristige Veränderungen der Lufttemperaturen in Europa
- 1 Sonnenflecken und Temperatur
- 2 Sonnenaktivität und globale Temperatur
- 3 de
Das Klima wird von der Sonne gesteuert !
en The sun is at the origin of climate change !
fr Le soleil est à l'origine du changement climatique ! - 4 de Fakten zum Klimawandel seit der Kleinen Eiszeit
- 5 Korrelation zwischen magnetischer Aktivität der Sonne und kosmischer Strahlung
- 6 Korrelation zwischen Sonnenstrahlung, kosmischen Strahlung und Wolkenbildung
- 7 Kosmische Strahlung und Wolkenbedeckung
- 8 de
Korrelation zwischen den Zyklenlängen der Sonne und der Erdtemperatur
en Correlation between Solar Cycle Length and Earth Temperature
fr Corrélation entre la durée des cycles solaires et la température du globe - 9 en Solar amplification mechanism by which solar activity & cosmic rays control climate
- 10 Korrelation der Sonnenfleckenanzahl mit der Wasseroberflächentemperatur
- 11 Tropical sea-surface temperatures and cosmic-rays
- 12 Südpazifische Oszillation (SO) und Kosmische Strahlung
- 13 Sea level rise and solar cycles
- 14 Sea Level Rise and Solar Activity
- 15 Solare Aktivität und Niederschläge
- 16 Enge Korrelation zwischen Sonnenaktivität und Wassermengen in Flüssen und Seen
- 17 de
Arktische Lufttemperatur verglichen mit der Sonnenstrahlung
en Arctic surface air temperature compared with total solar irradiance
fr Température arctique comparé avec la radiation solaire - 18 Übereinstimmung des Eises in der Arktis mit der Länge der Sonnenzyklen
- 19 Zusammenhang zwischen Tageslänge und Sonnenaktivität
- 20 Erkrankungshäufigkeit und Sonnenaktivität
- 21 Atmosphäre des Uranus verändert sich im Takt der Sonne
- 22 Strahlungszyklen lösen zyklische Änderungen der Temperaturen aus
- 23 Über einen Zeitraum von 2000 Jahren lässt sich eine natürliche Zyklik erkennen
- 24 Grönlandisches Eisschild: Temperatur & Sonne; Temperatur & CO2
- 25
Korrelation der Sonne mit Niederschlägen


 Vergleich der Februarniederschläge in Deutschland mit der
Sonnenaktivität
Vergleich der Februarniederschläge in Deutschland mit der
Sonnenaktivität
Blaue Kurve: Regenmengen des Monats Februar in Deutschland seit 1900.
Rot: Verlauf der Sonnenaktivität
- de Ähnlichkeit der Temperaturentwicklung in den USA während der Sommermonate mit dem Verlauf des PDO-Ozeanzyklus
- en
Correlation of Accumulated Cyclone Energy and Atlantic Multidecadal
Oscillations
Mittelfristig lässt sich die Hurrikanaktivität ganz gut vorhersagen, denn sie ist eng an den AMO-Ozeanzyklus gekoppelt, die Atlantische Multidekadenoszillation, die eine Periodizität von 60 Jahren besitzt. - de Trends der ozeanischen Zyklen und langfristige Veränderungen der Lufttemperaturen in Europa
- 12 de
Korrelation: Weizenpreise und Sonnentätigkeit
(William Herschel entdeckte den Zusammenhang)
en 200 years ago: Wheat prices and sunspots
fr William Herschel: Prix des céréales et taches solaires
- 14 Methan (CH4)
- 15 Wolken
- 16 Vulkane
- 17 Energie
| de | en | fr |
|---|---|---|
| Klimaverlauf | History of climate | Histoire du climat |
| Historische Klimatologie | Historical climatology | Climatologie historique |
| de | en | fr |
|---|---|---|
| Klimawandel: Ursachen | Climate change: Causes | Changement climatique: Causes |
| Solarer Einfluss in der Klima-Geschichte | Solar impact in Climate History | Impact solaire dans l'histoire du climat |
⇧
1 Aktueller Temperaturstillstand
en Hiatus in Global Warming
fr Hiatus dans le réchauffement climatique
⇧ de Verzeichnis en Contents fr Sommaire
- 2023
- en
NOAA makes it official
Last 8 years... global cooling... at a rate of 0.11°C/decade....
despite 450+ billion tons of emissions worth 14% of total manmade CO2 in the atmosphere.
Steve Milloy (2023-01-13) - de
Siebt-wärmstes Jahr 2022: Erwärmung verlangsamt sich
Javier Vinós / EIKE (2023-01-10) - de
Globale Erwärmung wird eine Pause einlegen
Fritz Vahrenholt / Vaherholts Newsletter (2023-01-07)
neueste wissenschaftliche Untersuchungen zeigen für Europa,
dass es erst einmal 15-20 Jahre leicht bergab gehen wird.
- 2019
- de
Phänologie: Pflanzen bestätigen Erwärmungs-Hiatus zu Beginn des
21. Jahrhunderts
en No trends in spring and autumn phenology during the global warming hiatus
Slowdown in Earth's Temps Stabilized Nature's Calendar - de
Sven Plöger und das 5-fache Motiv ein Grad Celsius aus dem
Treibhauseffekt verschwinden zu lassen !!
- en Not a Single Environmental Prediction of the Last 50 Years Has Come True
- en Planet-Sized Experiments - we've already done the 2°C test
- 2018
- de
Klimasensitivität - Wer rechnet hier falsch ?
Die Milchmädchen-Rechnung, die Klima-Politiker, Journalisten und etliche Klimatologen nicht machen können oder wollen, lautet wie folgt:
Bis zur Verdoppelung des CO2-Gehaltes von heute 400 auf 800 ppm vergehen bei den aktuellen Emissionen mit einem Anstieg von ca. 2 ppm pro Jahr noch 200 Jahre.
Das bedeutet real in 100 Jahren ca. + 1,5°C - genau das, was sich Politiker bei der Pariser Konferenz so vorgestellt haben, aber ohne kostspielige und risikoreiche CO2-Verminderungsmaßnahmen.
- en Secrets about the 1.5°C world temperature limit
- de Der September zeigt seit über 100 Jahren keine Erwärmung. Wo bleibt die Wirkung der Treibhausgase?
- de Klimawandel in Österreich: So veränderte sich die Temperatur
- de
"Anthropozän" fällt bei Kommission zur Stratigraphie glatt
durch
en Blow to warmists, the proposed 'Anthropocene' epoch has been denied by ICS - de Wir sollten jetzt die realen und nachteiligen Folgen von Abkühlung fürchten
- de Hamburger Forsythie muss wohl auf die schwarze Klimaleugnerliste
- en Don't Tell Anyone, But We Just Had Two Years Of Record-Breaking Global Cooling
- de Die WikiManufaktur
- de
Schnee- und Temperaturtrends in den Alpen: 120 Jahre
Klimageschichte rund um den Arlberg
- de Ach wie gut, dass niemand weiß, dass ich PDO heiß'
- 2017
- de
Kein neuer Rekord: Globale Mitteltemperatur 2016 erreichte lediglich
das Niveau von 1998
en @NOAA data demonstrates that 2016 was not the 'hottest year ever' in the USA - 2016
- de
Beginnt die globale Abkühlung?
Globale Mitteltemperatur stürzt um mehr als 1 °C steil ab.
en Steepest drop in global temperature on record - de Was ist da los? Der Hochsommermonat August wird in Deutschland nicht mehr wärmer
- de
Mogeln, tricksen, täuschen
Bei Harald Lesch sind Hopfen (und Malz) verloren - en Say Hello to La Niña Conditions
- de Globale Mitteltemperatur! Abschluss-Statistik 2015: jetzt einschließlich Dezember 2015
- de
Wissenschaftler entlarvt schonungslos die Klima
Behauptung der NOAA
en In defense of satellite temperature data - Dr. John Christy's powerful Senate testimony - 2015
- de Solares Paradoxon Deutschlands, Teil I: Solare Zyklen in der deutschen und der globalen Temperaturmessreihe
- de Klimawandel: Warum es in den Bergen trotzdem kälter wurde
- de
DWD widerspricht seinen eigenen Messungen
"Der Trend zu einem wärmeren Klima ist ungebrochen" (?)
en German DWD Weather Services Own Data Contradict Its Alarmist Claims Of "Uninterrupted Warming" - en No global warming for 18 years 9 months
- de Deutschland Temperaturen 2015
- en WoodForTrees.org 1985-2015
- 2014
- de
Erwärmungspause seit 1998
en Hiatus in Global Warming since 1998 - en
100 Year Snow Records broken across the South Eastern US on October
31st and November 01st
2015-2035 Mini Ice Age
Agricultural Losses 2014 from Cold Temperatures - 2012
- de
Globale Temperatur seit 16 Jahren nicht mehr angestiegen
en Global warming stopped 16 years ago - de Langfristiger Abkühlungstrend Nordeuropas über die letzten Jahrtausende
- de
Klaus-Eckart Puls:
G l o b a l C o o l i n g : Wo bleibt die Erderwärmung
en "Goodbye Warming - Hello Cooling"
⇧ Welt-Info
⇧ de Allgemein en General fr Générale
Topics

![]()
![]() ▶Globale Absoluttemperaturen 2014-2018 [WMO Genf]
▶Globale Absoluttemperaturen 2014-2018 [WMO Genf]

![]()
![]() ▶Not a Single Environmental Prediction of the Last 50 Years
Has Come True
▶Not a Single Environmental Prediction of the Last 50 Years
Has Come True

de Panik-Küche en Panic laboratory fr Marmite alarmiste
-
Wikipedia
de
Pause der globalen Erwärmung
en Global warming hiatus
fr -
| de |
▶ Internet-Terror: Manipulation von Wikipedia durch einen Administrator ▶ Das Lexikon der Lügen ▶ Vom Onlinelexikon zur Propagandamaschine: Zensur, Einschüchterung und arglistige Täuschung ▶ Wikipedia: Klima-Fälscher Connolley: Der Mann, der unser Weltbild umschrieb ▶Die dunkle Seite von WIKIPEDIA: EIKE Zensur - kurz und knapp [Who is who (Skeptische Institute): EIKE; Wikipedia: Websites, Opfer: EIKE, Manipulatoren: Andol] |
|||||
|---|---|---|---|---|---|---|
| en |
▶ At Wikipedia, one man engineers the debate on global warmingator |
|||||
| fr |
▶ A Wikipedia, un homme dirige le débat sur le réchauffement climatique et à sa manière |
| de | en | fr |
|---|---|---|
|
Klima: Diskussion Aussagen Klima Skandal: Evaluation Aussagen |
Climate change: Discussion Declarations Climate Scandal: Evaluation Declarations |
Climat: Discussion Déclarations Scandale: Évaluations Déclarations |
| de | en | fr |
|---|---|---|
|
Neue Kälteperiode Kaltzeit |
New Cold Period Cold Period |
Nouvelle periode froide Periode froide |
| Voraussagen | Predictions | Prédictions |
| Kälte: Warnungen | Cooling: Warnings | Refroidissement: Avertissements |
| Erwärmung: Entwarnung | Warming: All-Clear | Réchauffement: Fin de l'alerte |
| Eiszeiten | Ice Ages | Glaciations |
| de | en | fr |
|---|---|---|
|
Klimawandel: Probleme Prognosen und deren Probleme |
Climate change: Problems Predictions and their problems |
Climat: Problèmes Prédictions et leurs difficultées |
| de | en | fr |
|---|---|---|
| Das CO2 steigt und die Temperaturen fallen | CO2 is rising and the temperatures are falling | Le CO2 monte et les températures baissent |
⇧ de Text en Text fr Texte
⇧ 2023
↑
NOAA makes it official
Last 8 years... global cooling... at a rate of 0.11°C/decade....
despite 450+ billion tons of emissions worth 14% of total
manmade CO2 in the atmosphere.
![]()
![]()

↑ Siebt-wärmstes Jahr 2022: Erwärmung verlangsamt sich
-
EIKE Europäisches Institut für Klima und Energie
Javier Vinós
2023-01-10 de Siebt-wärmstes Jahr 2022: Erwärmung verlangsamt sich
↑ Globale Erwärmung wird eine Pause einlegen
-
Klimanachrichten / Vahrenholts Newsletter
2023-01-07 de Globale Erwärmung wird eine Pause einlegen
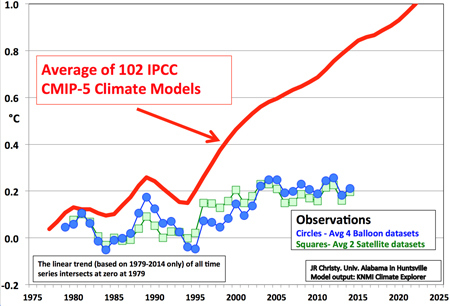
Satellitengestützten Messungen der University of Alabama (UAH)
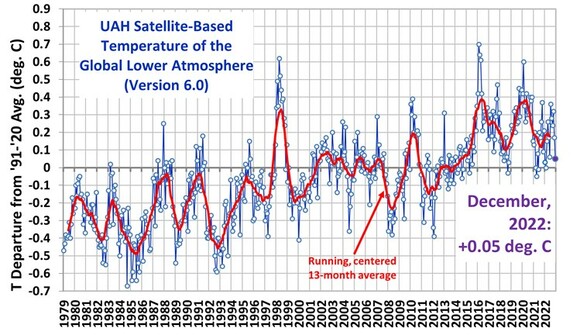
Bildet man den Durchschnitt der letzten Jahre,
so ist die globale Temperatur seit 8 Jahren und 4 Monaten konstant.
Im Dezember ist die Abweichung der globalen Temperatur
vom 30-jährigen Mittel der satellitengestützten Messungen
der University of Alabama (UAH)erneut gesunken und zwar auf 0,05 Grad Celsius. (siehe Grafik oben).
Zwar gibt es bis 2015 eine langjährige Temperatursteigerung.
Aber sie beträgt im Durchschnitt pro Jahrzehnt seit 1979 lediglich 0,13 Grad Celsius.
[also 13 tausendstel Grad pro Jahr, während den letzten 43 Jahren !]
Aber es kommt noch besser:
neueste wissenschaftliche Untersuchungen zeigen für Europa,
dass es erst einmal 15-20 Jahre leicht bergab gehen wird.
Studie in "Nature": Nord-Atlantik kühlt sich ab
Es sind klimawissenschaftliche Schwergewichte, die kürzlich im Nature Journal "climate and atmospheric science" Aufsehen erregten.
Katja Matthes, Direktorin des GEOMAR Helmholtz-Zentrums für Ozeanforschung in Kiel,
Johann Jungclaus vom Max-Planck Institut für Meteorologie in Hamburg
und Nour-Eddine Omrani vom norwegischen Bjerknes centre for climate research
veröffentlichten eine Untersuchung, die zeigt, dass wir
vor einer Abschwächung der Nordatlantischen Oszillation,
einer Abkühlung des Nord- Atlantiks
und damit verbunden einer globalen Temperaturentwicklung wie zwischen 1950 und 1970 stehen
( so die Autoren in ihrer Zusammenfassung).
npj Climate and Atmospheric Science volume
2022-07-13 en Coupled stratosphere-troposphere-Atlantic multidecadal oscillation and its importance for near-future climate projectionThis coupled variability improves the performance of statistical models, which project further weakening of North Atlantic Oscillation, North Atlantic cooling and hiatus in wintertime North Atlantic-Arctic sea-ice and global surface temperature just like the 1950s1970s.
Die Grafik zeigt den Rückgang der Temperaturen des Nordatlantiks bis 2040.
Wegen des globalen Erwärmungstrends fallen die Temperaturen nicht wieder auf das Niveau der Jahre 1950 bis 1970 zurück, erläutert einer der Autoren, Eddine Omrani.
Die zu erwartende Erwärmungspause gibt uns Zeit - so Omrani-, um technische, politische und ökonomische Lösungen zu erarbeiten
vor der nächsten Erwärmungsphase, die etwa ab 2050 wieder Oberhand gewinnt.
Die Grafik zeigt den Rückgang der Temperaturen des Nordatlantiks
bis 2040.
Die nächste Erwärmungsphase wird erst ab 2050 wieder Oberhand gewinnen.

Die Veröffentlichung der Klimaforscher aus Kiel, Hamburg, Bergen, Venedig und Houston bringt uns eine weitere wichtige Erkenntnis.
Die Erwärmung der Jahre 1980 bis 2015 war massgeblich von der warmen Phase des Atlantiks geprägt.
Wir können abschätzen, dass ein bedeutender Teil der Erwärmung diesem natürlichen Zyklus zuzuschreiben ist.
Dieser Zeitraum wird aber u.a. zugrundegelegt um Temperaturprognosen in die Zukunft vorzunehmen.
Die Modelle schlagen aber den natürlichen Erwärmungsbeitrag dem CO₂-Effekt zu.
Dieser falsch berechnete, höhere CO₂-Effekt wird in die Zukunft fortgeschrieben.
Modelle, die die natürlichen zyklischen Einflüsse nicht berücksichtigen - und das können die Modelle noch nicht - kommen so zu viel zu starken Erwärmungsprognosen.
Es soll nicht unerwähnt bleiben, dass es eine Vielzahl von Veröffentlichungen gibt (etwa diese, an der Matthes und Omrani beteiligt waren, Solar forcing synchronizes decadal North Atlantic climate variability), die eine Kopplung der Stärke der Solarzyklen mit der Nordatlantischen Oszillation für wahrscheinlich halten.
Nature Communications
2015-09-15 en Solar forcing synchronizes decadal North Atlantic climate variabilityDer letzte Solarzyklus von 2008 bis 2019 war der schwächste seit 100 Jahren.
Der augenblickliche Zyklus entwickelt sich bislang genauso schwach.
Die Eindimensionalität der Klima- und Energiedebatte, die darin gipfelt,
dass allein die CO₂-Emissionen unsere Klima bestimmen, ist schon erschreckend.
▶Voraussagen einer neuen Kälteperiode
Mit folgendem Link wird von anderen Webseiten auf diese Seite verwiesen.
▶ Globale Erwärmung wird eine Pause einlegen
neueste wissenschaftliche Untersuchungen zeigen für Europa,
dass es erst einmal 15-20 Jahre leicht bergab gehen wird.
Fritz Vahrenholt / Vaherholts Newsletter (2023-01-07)
⇧ 2019
↑
Phänologie: Pflanzen bestätigen Erwärmungs-Hiatus zu Beginn des
21. Jahrhunderts
en
No trends in spring and autumn phenology during the global
warming hiatus
Slowdown in Earth's Temps Stabilized
Nature's Calendar
-
Die kalte Sonne (Fritz Vahrenholt & Sebastian Lüning)
2019-07-06 de Phänologie: Pflanzen bestätigen Erwärmungs-Hiatus zu Beginn des 21. Jahrhunderts1: Zwischen 1998 und 2015 gab es ein Jahrzehnt, in dem die Temperaturen nicht weiter anstiegen.
Die Zeit wurde in der Fachwelt auch "Hiatus" genannt (Abb. 1) und war Thema zahlreicher Fachpublikationen.

2: Erst der El Nino 2015/16 brachte dann wieder eine Erwärmung.
Seit der El Nino-Spitze sacken die Temperaturen aber wieder ab (Abb. 2).

Phänologen haben den Hiatus jetzt auch in den Blühzeiten der Pflanzen nachgewiesen.
In der Zeit der Erwärmungspause veränderten sich die Blühzeiten kaum, wie eine Studie von Xufeng Wang und Kollegen dokumentiert, die am 3. Juni 2019 in Nature Communications erschien.
Hier der dazugehörige Abstract:
-
Nature Communications
2019-06-03 de No trends in spring and autumn phenology during the global warming hiatusNo trends in spring and autumn phenology during the global warming hiatus
Phenology plays a fundamental role in regulating photosynthesis, evapotranspiration, and surface energy fluxes and is sensitive to climate change.
The global mean surface air temperature data indicate a global warming hiatus between 1998 and 2012, while its impacts on global phenology remains unclear.
Here we use long-term satellite and FLUXNET records to examine phenology trends in the northern hemisphere before and during the warming hiatus.
Our results based on the satellite record show that the phenology change rate slowed down during the warming hiatus.
The analysis of the long-term FLUXNET measurements, mainly within the warming hiatus, shows that there were no widespread advancing (or delaying) trends in spring (or autumn) phenology.
The lack of widespread phenology trends partly led to the lack of widespread trends in spring and autumn carbon fluxes.
Our findings have significant implications for understanding the responses of phenology to climate change and the climate-carbon feedbacks.
Die University of New Hampshire (UNH) gab dazu die folgende Pressemitteilung heraus:
-
University of New Hampshire
2019-06-03 de NUNH Researchers Find Slowdown in Earth's Temps Stabilized Nature's CalendarSometimes referred to as nature's calendar,
phenology looks at the seasonal life cycle of plants and animals and is one of the leading indicators of climate change.
It's the observance of natural occurrences like the first formation of buds and flowers in the spring and the changing colors of leaves in the fall.
According to researchers at the University of New Hampshire, when the rate of the Earth's air temperature slows down for a significant amount of time, so can phenology.
|
|
Phänologie: Pflanzen bestätigen Erwärmungs-Hiatus zu Beginn des 21. Jahrhunderts Die Erwärmungspause: Pflanzen bestätigen Erwärmungs-Hiatus zu Beginn des 21. Jahrhunderts |
↑ en Sven Plöger und das 5-fache Motiv ein Grad Celsius aus dem Treibhauseffekt verschwinden zu lassen !!
![]()
![]() ▶Globale Absoluttemperaturen 2014-2018 [WMO Genf]
▶Globale Absoluttemperaturen 2014-2018 [WMO Genf]
Heftig !! Sven Plöger lässt in der WDR-Sendung "Ihre Meinung" als er den Treibhauseffekt erklärt, 1°C verschwinden.
Denn wir wissen, dass Sven Plöger in Vergangenheit andere Werte vertreten hatte, was wir in diesem Video öffentlich machen und auch das Motiv erklären, warum Sven Plöger 1°C hat "verschwinden" lassen.
Denn Sven Plöger will "retuschieren", dass ein Temperaturwert von 15°C aus dem natürlichen Treibhauseffekt keine gefährliche Erdwärmung ausweist, wenn der jährliche globale Absoluttemperaturwert den Wert von 15°C nicht überschreitet...
-
EIKE Europäisches Institut für Klima und Energie
Rainer Hoffmann
2019-04-29 de Sven Plöger und das 5-fache Motiv ein Grad Celsius aus dem Treibhauseffekt verschwinden zu lassen !!
-
Das Klimamanifest von Heiligenroth
2019-04-25 de Es war VORSATZ(!), als Sven Plöger (@DasErste) am 11.04.2019 im @WDR ein Grad Celsius aus dem #Treibhauseffekt verschwinden liess!!

↑ en Not a Single Environmental Prediction of the Last 50 Years Has Come True
![]()
![]() ▶Not a Single Environmental Prediction of the Last 50 Years
Has Come True
▶Not a Single Environmental Prediction of the Last 50 Years
Has Come True
-
Watts UP With That? (Anthony Watts) / Nicolas Loris, Bangor Daily News
2019-04-22 en Earth Day: Not a Single Environmental Prediction of the Last 50 Years Has Come TrueWe should be thankful that the gloom-and-doom predictions made throughout the past several decades havent come true.
Fear-mongering about
explosive population growth,
food crises
and the imminent depletion of natural resources
have been a staple of Earth Day events since 1970.
And the common thread among them is that they've stirred up a lot more emotions than facts.
↑ en Planet-Sized Experiments - we've already done the 2°C test
![]()
![]() ▶ Planet-Sized Experiments -
we've already done the 2°C test
▶ Planet-Sized Experiments -
we've already done the 2°C test

-
Watts UP With That? (Antony Watts) / Willis Eschenbach
2019-03-17 en Planet-Sized Experiments - we've already done the 2°C test
Berkeley Earth average European temperature, 1743 - 2013
Red/yellow line is an 8-year Gaussian average.
Horizontal red and blue lines are 2°C apart.
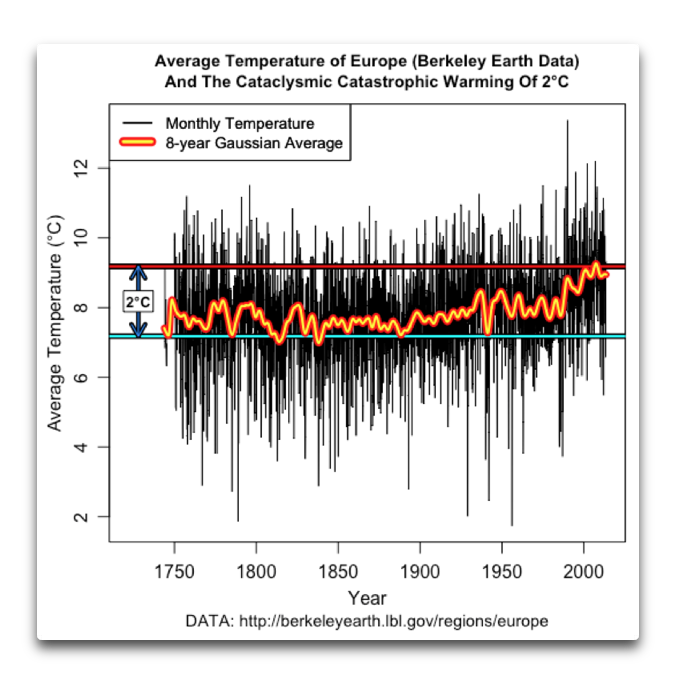
People often say that we're heading into the unknown with regards to CO2 and the planet.
They say we can't know, for example, what a 2°C warming will do because we can't do the experiment.
This is seen as important because
for unknown reasons, people have battened on to "2°C" as being the scary temperature rise
that we're told we have to avoid at all costs.
But actually, as it turns out, we have already done the experiment.
Below I show the Berkeley Earth average surface temperature record for Europe.
Europe is a good location to analyze, because some of the longest continuous temperature records are from Europe.
In addition, there are a lot of stations in Europe that have been taking record for a long time.
This gives us lots of good data.
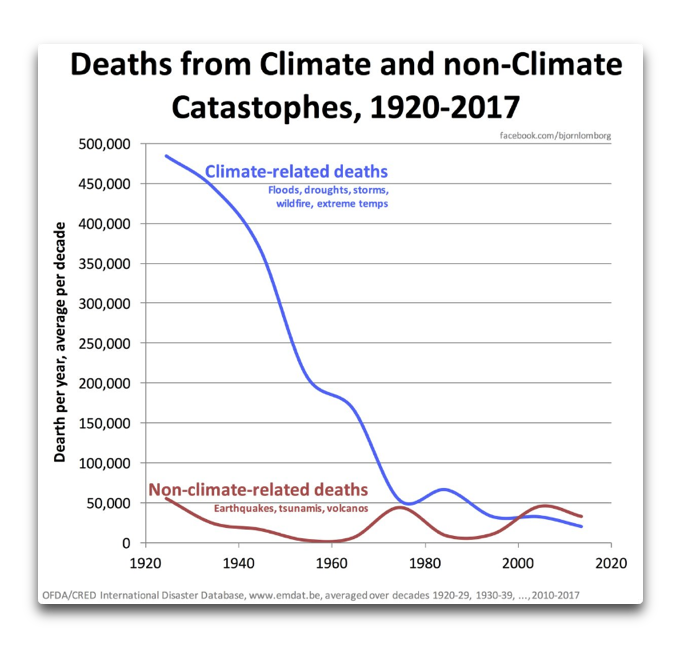
Average annual climate-related (blue line)
and non-climate-related (red line) deaths in natural disasters
 Results of the UN "My World" poll. Further analytic data

|
|
Planet-Sized Experiments - we've already done the 2°C test |
⇧ 2018
↑ Klimasensitivität - Wer rechnet hier falsch ?
-
EIKE Europäisches Institut für Klima und Energie
Dr. D.E. Koelle
2018-12-17 de Klimasensitivität - Wer rechnet hier falsch?Der IPCC basiert seine Hypothese der Klimasensitivität immer noch auf der alten Charney-Studie von 1979:
Eine CO2-Verdoppelung soll demnach einen Temperaturanstieg um 3°C bewirken.
Diese Annahme wird auch bei den Klimamodellen verwendet.
Neuere Studienergebnisse zu diesem Thema mit einem wesentlich geringeren Anstieg
wurden vom IPCC ignoriert.
Wie auch jüngst wieder durch PIK Professor Anders Levermann beim öffentlichen Fachgespräch im Umweltausschuss des Deutschen Bundestages am 28.11.18.
Doch auch Prof. Marotzke (MPI) gab kürzlich zu, dass die bisherige Annahme offenbar zu hoch ist.
Dies wird durch den Vergleich des berechneten Temperaturanstieges mit der Realität der letzten 20 Jahre bestätigt.
Bis heute konnte der angebliche CO2-Effekt auf die Globaltemperatur nicht durch historische Fakten belegt werden,
sondern ist laut IPCC-Bericht eine Sache von "confidence", d.h. von Glauben oder Vertrauen.
Die Milchmädchen-Rechnung, die Klima-Politiker, Journalisten und etliche Klimatologen nicht machen können oder wollen, lautet wie folgt:
Bis zur Verdoppelung des CO2-Gehaltes von heute 400 auf 800 ppm vergehen bei den aktuellen Emissionen mit einem Anstieg von ca. 2 ppm pro Jahr noch 200 Jahre.
Das bedeutet real in 100 Jahren ca. + 1,5°C - genau das, was sich Politiker bei der Pariser Konferenz so vorgestellt haben, aber ohne kostspielige und risikoreiche CO2-Verminderungsmaßnahmen.
Das international anerkannte Modtran-Programm der Atmosphärenphysik
zeigt zwischen 400 und 800 ppm einen Temperaturanstieg von nur 1,7°C (anstelle von den 3°C des IPCC) mit Berücksichtigung des Sättigungseffektes, der ansonsten oft ignoriert wird.
Das wäre dann in 100 Jahren nur ein Anstieg um ca. +0,85°C.

Tatsächlich ist aber kein weiterer Anstieg der mittleren Globaltemperatur zu erwarten, sondern das Gegenteil:
sie wird in den nächsten 400 Jahren aller Wahrscheinlichkeit nach wieder um ca. 1,5°C absinken
- so, wie dies schon seit 8000 Jahren regelmäßig alle 1000 Jahre der Fall war,
zuletzt in der mittelalterlichen Kaltzeit (auch " Little Ice Age" genannt).
Dieser natürliche Klimazyklus basiert auf solaren und astrophysikalischen Faktoren und kann von Menschen nicht beeinflusst werden - genauso wenig wie andere Natur-Ereignisse wie Erdbeben und Vulkanausbrüche.
↑ en Secrets about the 1.5°C world temperature limit
-
Fabius Maximus website / Larry Kummer
2018-11-09 en Secrets about the 1.5°C world temperature limitThere has been a daily drumbeat of dark climate news to accompany the IPCCs new report, "Global Warming of 1.5 °C."
Millions of people are terrified that climate change will wreck or destroy the world.
Here is some information they probably do not know, because journalists do not mention it.
-
Frontiers / Sebastian Lüning and Fritz Vahrenholt
2017-12-12 de Paleoclimatological Context and Reference Level of the 2°C and 1.5°C Paris Agreement Long-Term Temperature LimitsThe Paris Agreement adopted in December 2015 during the COP21 conference stipulates that the increase in the global average temperature is to be kept well below 2°C above "pre-industrial levels" and that efforts are pursued to limit the temperature increase to 1.5°C above "pre-industrial levels."
In order to further increase public acceptance of these limits it is important to transparently place the target levels and their baselines in a paleoclimatic context of
the past 150,000 years (Last Interglacial, LIG)
and in particular of the last 10,000 years (Holocene; Present Interglacial, PIG).
Intense paleoclimatological research of the past decade has firmed up that pre-industrial temperatures have been highly variable which needs to be reflected in the pre-industrial climate baseline definitions.
The currently used reference level 1850-1900 represents the end of the Little Ice Age (LIA).
The LIA represents the coldest phase of the last 10,000 years when mean temperatures deviated strongly negatively from the Holocene average and which therefore are hard to justify as a representative pre-industrial baseline.
The temperature level reached during the interval 1940-1970 may serve as a better reference level as it appears to roughly correspond to the average pre-industrial temperature of the past two millennia.
Placing the climate limits in an enlarged paleoclimatic context will help to demonstrate that the chosen climate targets are valid and represent dangerous extremes of the known natural range of Holocene temperature variability.
| Studie | Lüning, S., F. Vahrenholt (2017) |
|---|---|
| Paleoclimatological context and reference level of the 2°C and 1.5°C Paris Agreement long-term temperature limits. | |
|
Frontiers in Earth Science, 12 December 2017, doi: 10.3389/feart.2017.00104 |
Dieser Literaturhinweis wurde mit dem ganzen Litreraturverzeichnis von Dr. Sebastian Lüning in Wikipedia gelöscht:
▶Wikipedia-Deckname 'Neudabei':
Er kam des nachts und löschte aus Ärger einfach das
Literaturverzeichnis
[Who is who (Skeptiker):
Sebastian Lüning;
Wikipedia:
Websites,
Opfer:
Lüning,
Manipulatoren:
Neudabei]
-
Die kalte Sonne (Fritz Vahrenholt & Sebastian Lüning)
2017-12-20 de Neue Studie setzt die 1,5°C und 2,0°C Temperaturziele des Pariser Klimavertrags in einen historischen KontextAm 12. Dezember 2017 erschien im Fachblatt 'frontiers in Earth Science' eine Arbeit von Sebastian Lüning und Fritz Vahrenholt zum paläoklimatischen Kontext der Pariser 1,5°C und 2,0°C Klimaziele.
Die Publikation ist dort kostenfrei als pdf herunterladbar.
Zu der Arbeit gaben die Autoren die folgende Pressemitteilung heraus (deutsche Version weiter unten):
Press release issued: 13 December 2017
New study puts the 1.5°C and 2.0°C temperature limits of the Paris Agreement into a historical climate context
The Paris Agreement adopted in December 2015 during the COP21 climate conference stipulates that the increase in the global average temperature is to be kept well below 2°C above "pre-industrial levels" and that efforts are pursued to limit the temperature increase to 1.5°C above "pre-industrial levels."
Closer inspection of the treaty text, however, reveals that the term "pre-industrial levels" is nowhere defined in this epochal UN-document, that has meanwhile been ratified by 170 Parties.
This is particularly odd because the "pre-industrial" temperatures of the past 10,000 years have varied quite significantly, as meticuloulsy documented by hundreds of paleoclimate studies.
Puzzled by this apparent gap in the Agreement, Fritz Vahrenholt went out and researched the history of the temperature limit definition.
The former renewable energy manager and current head of the German Wildlife Foundation was surprised to find that the initial description of this important climate goal dates back to the mid 1970s, proposed by an economist, by the name of William Nordhaus.
Nordhaus' idea was as simple as effective:
He looked at the maximum temperatures recorded during the past several hundred thousand years and warned that this natural range should not be exceeded in the future.
Two decades later, in 1995, the German Advisory Council for Global Change further refined this concept, but kept Nordhaus' original idea of a tolerable 'temperature window'.
Vahrenholt:
"Unfortunately this important palaeoclimatological perspective was lost in subsequent key papers on the subject that paved the way to the Paris Agreement.
Reports by the World Bank and United Nations Framework Convention on Climate Change (UNFCCC) in 2014 and 2015 narrowed their view to the last 200 years which does not do justice to the enormous natural temperature fluctuations on a multi-millennial perspective."
In order to better understand the complex pre-industrial temperature history of the past, Vahrenholt teamed up with Sebastian Lüning, a professional resources geologist who in his sparetime works on paleoclimatological studies with the Switzerland-based Institute for Hydrography, Geoecology and Climate Sciences.
Lüning researched the literature and integrated the Paris Agreement 2.0°C and 1.5°C temperature limits into the climate development of the past 2000, 10,000 and 120,000 years.
Lüning:
"Comparing the modern warming to reference levels at the end of the Little Ice Age about 150 years ago does not really make much sense because this period represents one of the coldest times of the past 10,000 years.
The choice of a baseline near the lower extreme of a variable parameter is uncommon in science.
The temperature level that was reached during the interval 1940-1970 may serve as a better reference level because it appears to roughly correspond to the average pre-industrial temperature of the past two millennia."
On an even longer time scale, it is found that current temperatures have not yet even exceeded the warmest temperatures of a natural warm phase that globally occurred some 7000 years ago, the so-called 'Holocene Thermal Maximum'.
Global temperatures may have even partly exceeded the 1.5°C limit during this warm phase, when combined land and sea surface temperatures are taken into account.
The increase in this natural temperature window and the baseline shift potentially enlarges the headroom for the 1.5°C temperature limit of the Paris Agreement which deserves further study.
...
-
EIKE Europäisches Institut für Klima und Energie
2017-12-15 de Neue Studie stellt die Temperaturgrenzen von 1,5°C bzw. 2°C des Paris-Abkommens in einen histori-schen Klima-ZusammenhangAnmerkung der Redaktion.
Die Autoren Lüning und Vahrenholt bemängeln in ihrer Studie bei den Pariser Klimabeschlüssen zu Recht das Fehlen einer exakten Vergleichsbasis für die dort definierten zulässige Temperatur-Erhöhungen, die aber trotzdem mit einer Genauigkeit von 1/10nbsp;°C (2,0 bzw 1,5nbsp;°C) beziffert werden und die auch bestimmt werden sollen.
Das mag hohe Politik sein, Wissenschaft ist es nicht.
Wissenschaftlich ist es Unsinn.
Diese Wissenschaft wieder zu etablieren, ist das Ziel der Autoren.
Dabei konzentrieren sie sich nur auf diesen einen offensichtlichen Mangel, weitere schwere Mängel wie z.B. den, dass eine mittlere Temperatur der Erdatmosphäre in der Realität nicht existiert, lassen sie außen vor.
Wir vermuten, dass das deshalb geschah, um die Studie überhaupt veröffentlicht zu bekommen.
Trotzdem ist die Studie lesenswert.
Jeder mag seine eigenen Schlussfolgerungen ziehen.
Presseerklärung vom 13. Dezember 2017
Bei dem Pariser Klima-Abkommen vom Dezember 2015 wurde vereinbart, dass die Zunahme der globalen mittleren Temperatur auf deutlich unter 2°C verglichen mit dem "vorindustriellen Niveau" begrenzt werden muss und dass man sich bemühen sollte, den Anstieg auf 1,5°C zu begrenzen.
Eine genauere Betrachtung des Vertrags-Wortlautes enthüllt jedoch, dass der Terminus "vorindustrielles Niveau" nirgendwo in diesem epochalen UN-Dokument definiert ist, welches mittlerweile von 170 teilnehmenden Parteien ratifiziert worden ist.
Dies ist besonders komisch, weil die "vorindustriellen" Temperaturen der letzten 10.000 Jahren signifikante Variationen durchlaufen haben, wie akribisch dokumentiert in hunderten paläoklimatischer Studien.
Verwirrt durch diese klaffende Lücke im Abkommen machte sich Fritz Vahrenholt daran, die Historie der Definition zum Temperaturlimit zu ergründen.
Der ehemalige Manager erneuerbarer Energie und derzeit Leiter der German Wildlife Foundation fand zu seiner Überraschung heraus, dass die ursprüngliche Beschreibung dieses bedeutenden Klimaziels von Mitte der siebziger Jahre stammt und von einem Ökonom namens William Nordhaus ins Spiel gebracht worden ist.
Nordhaus' Gedanke war ebenso einfach wie effektiv:
Er betrachtete die Höchstwerte der Temperatur der letzten paar hunderttausend Jahre und warnte, dass die dabei zutage getretene natürliche Bandbreite in Zukunft nicht überschritten werden darf.
Zwei Jahrzehnte danach, nämlich im Jahre 1995 überarbeitete der Wissenschaftliche Beirat Globale Umweltveränderungen WBGU dieses Konzept, behielt aber den ursprünglichen Gedanken eines tolerierbaren "Temperatur-Fensters" von Nordhaus bei.
Vahrenholt:
"Unglücklicherweise ist diese wichtige paläoklimatische Perspektive in nachfolgenden grundlegenden Studien, welche den Weg nach Paris bereitet hatten, verloren gegangen.
In Berichten der Weltbank und des United Nations Framework Convention on Climate Change (UNFCCC) aus den Jahren 2014 und 2015 wurde der historische Zeitraum auf die letzten 200 Jahre eingeengt, welche den enormen natürlichen Temperatur-Fluktuationen im Zeitmaßstab von Jahrtausenden nicht gerecht wird".
Um die komplexe präindustrielle Temperatur-Historie besser zu verstehen tat er sich mit Sebastian Lüning zusammen, einem professionellen Ressourcen-Geologen, der in seiner Freizeit an paläoklimatischen Studien arbeitet am in der Schweiz ansässigen Institute for Hydrography, Geoecology and Climate Sciences.
Lüning durchforstete die Literatur und integrierte die Temperaturgrenzen von 2,0°C bzw. 1,5°C in die Klimaentwicklung der letzten 2000, 10.000 und 200.000 Jahre.
Lüning:
"Der Vergleich der derzeitigen Erwärmung mit dem Referenz-Niveau am Ende der Kleinen Eiszeit vor etwa 150 Jahren ist wenig sinnvoll, weil diese Zeit eine der kältesten Epochen der letzten 10.000 Jahre repräsentiert.
Die Auswahl eines Parameters als Grundlinie nahe dem untersten Extrem eines variablen Parameters ist in der Wissenschaft unüblich.
Das Temperaturniveau des Zeitraumes von 1940 bis 1970 wäre ein viel besser geeignetes Referenz-Niveau, weil es in etwa mit dem mittleren vorindustriellen Temperaturniveau der letzten beiden Jahrtausende korrespondiert".
In einem sogar noch längeren Zeitmaßstab stellte sich heraus, dass die Temperatur gegenwärtig noch nicht einmal über die höchsten Temperaturen einer natürlichen Warmphase hinausgegangen sind, dem "Thermalen Maximum des Holozäns" vor etwa 7000 Jahren.
Die globalen Temperaturen können während jener Warmphase gut über das Limit von 1,5°C hinaus gegangen sein, wenn man Land- und Wassertemperatur zusammen in Betracht zieht.
Die Zunahme dieses natürlichen Temperatur-Fensters und die Verschiebung der Grundlinie vergrößert die Obergrenze des 1,5°C-Limits und muss weiter untersucht werden.
...
|
|
Secrets about the 1.5°C world temperature limit Die Erfindung des 2-Grad-Zieles Wissenschaftliche Debatte zur Aufklärung Manipulation und Terror von Wikipedia: Mainstream vs. Wissenschaft |
↑ Der September zeigt seit über 100 Jahren keine Erwärmung. Wo bleibt die Wirkung der Treibhausgase?
![]()
![]()

-
EIKE Europäisches Institut für Klima und Energie
Josef Kowatsch
2018-10-04 de Der September zeigt seit über 100 Jahren keine Erwärmung. Wo bleibt die Wirkung der Treibhausgase?Eine sich fortsetzende und aufschaukelnde Klimaerwärmung aufgrund des anthropogenen CO2-Ausstoßes ist die irrige Behauptung der Erwärmungswissenschaftler, die in Deutschland laufend die Medien füttern, um die Bevölkerung zu ängstigen.
Richtig bei dieser Aussage ist lediglich, dass die CO2-Konzentration in den letzten 50 Jahren angestiegen ist, und zwar von 0,03 % = 300 ppm auf 400 ppm.
Das bedeutet aber auch: 99,96 % der Luft bestehen immer noch aus anderen Gasen.
Und Kohlendioxid ist kein Giftgas, sondern lebensnotwendig für das Leben auf der Erde.
Es ist physikalisch unmöglich, dass ein Gas wie CO2 in den Sommermonaten in Deutschland erwärmend und im September abkühlend wirkt.
Gesamtergebnis: Es wird höchste Zeit, dass die CO2-Erwärmungsirrlehre zu den Akten gelegt wird und weltweit eine neue Umweltschutzethik entsteht.
Sauberes Wasser, saubere Luft und saubere Nahrungsmittel gleichmäßig verteilt, wären ein gemeinsames ethisches Ziel, das die Menschheit anstreben sollte.
Der angebliche Klimaschutz ist ein raffiniertes Geschäftsmodell.
|
|

↑ Klimawandel in Österreich: So veränderte sich die Temperatur
-
Die kalte Sonne (Fritz Vahrenholt & Sebastian Lüning)
2018-09-18 de Klimawandel in Österreich: So veränderte sich die TemperaturEin Hauptmerkmal des Klimawandels sind Veränderungen der Jahresdurchschnittstemperatur.
Die instrumentell gemessenen Temperaturen Österreichs liegen für die letzten 250 Jahre vor, wobei sich das Messnetz erst im Laufe des 20. Jahrhunderts signifikant verdichtete.
Die darüber hinausreichende Temperaturgeschichte Österreichs wurde in Fallstudien für die vergangenen 10.000 Jahre anhand von Höhlentropfsteinen, Seensedimenten und Baumringen rekonstruiert.
Letzte 30 Jahre
Die Jahresdurchschnittstemperaturen haben sich in Österreich während der vergangenen 30 Jahre um mehr als ein halbes Grad erhöht.
Allerdings schwankten die Temperaturen von Jahr zu Jahr um bis zu 2 Grad.
Entwicklung der Jahresdurchschnittstemperaturen in Österreich
während der vergangenen 30 Jahre (1988-2017)

Februartemperaturen während der vergangenen 30 Jahre (1986-2015)
Interessanterweise läuft die Erwärmung nicht in allen Jahreszeiten und Monaten gleichmäßig ab.
So ist die Temperatur in den Monaten Februar und Oktober während der vergangenen 30 Jahre in Österreich nicht angestiegen und blieb stabil.
Entwicklung der Februartemperaturen in Österreich während der
vergangenen 30 Jahre (1986-2015).
Die grüne Linie zeigt den linearen Trend an.

Temperaturdaten der Station Zugspitze 1946-2010 in den Versionen ZAMG/HISTALP und Deutscher Wetterdienst (DWD)
Auf der HISTALP Webseite der österreichischen Zentralanstalt für Meteorologie und Geodynamik (ZAMG) lassen sich Temperaturzeitreihen für einzelne Stationen seit Beginn der Messungen herunterladen und visualisieren.
Die Datenreihen sind "homogenisiert", das heißt, die Originalmessdaten wurden verändert, mit dem erklärten Ziel, die Werte vergleichbar zu machen.
Derartige Eingriffe sind zum Teil notwendig, jedoch nicht immer unumstritten.
Am Beispiel der deutschen Station Zugspitze in unmittelbarer Grenznähe zu Österreich wird deutlich, wie unterschiedlich die nationalen Wetterdienste mit den Messdaten umgehen.
Während die ZAMG im Rahmen des HISTALP-Programmes die Wärmejahre in den 1940er bis 60er Jahren um ein halbes Jahr händisch heruntersetzte
und damit die Erwärmungsrate zusäzlich versteilt hat,
verarbeitet der Deutsche Wetterdienst die Temperaturdaten unverändert
und kommt auf eine deutlich abgebremste Erwärmung
Vergleich der Temperaturdaten der Station Zugspitze 1946-2010
in den Versionen
ZAMG/HISTALP (blau) und Deutscher Wetterdienst (DWD, rot).

↑
"Anthropozän" fällt bei Kommission zur Stratigraphie glatt
durch
en
Blow to warmists, the proposed 'Anthropocene epoch
has been denied by ICS
![]()
![]()
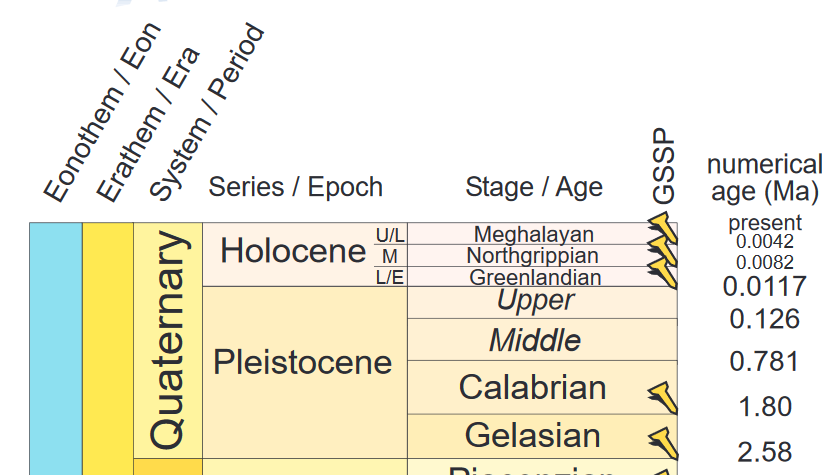
![]() INTERNATIONAL CHRONOSTRATIGRAPHIC CHART
INTERNATIONAL CHRONOSTRATIGRAPHIC CHART
Stratigraphie des Quartärs laut überarbeiteter Tabelle der
International Commission on Stratigraphy (ICS)
-
Die kalte Sonne (Fritz Vahrenholt & Sebastian Lüning)
2018-09-12 de "Anthropozän" fällt bei Kommission zur Stratigraphie glatt durchLeben wir in einer klimatisch außergewöhnlichen Zeit, die alles Vorherige in den Schatten stellt?
Dafür muss man in die klimatische Vergangenheit schauen.
Anhänger des Klimaalarmismus beschränken sich dabei auf die letzte 150 Jahre und kommen zu dem vorschnellen aber persönlich erhebenden Schluss:
Ja, wir sind Teil einer Entwicklung die es noch nie gegegben hat, und wir sind auch noch selber Schuld daran.
Wir mächtigen Menschen haben es geschafft, uns das Klima Untertan zu machen.
Wenn man jedoch den Vergleichszeitraum einige hundert und wenige tausend Jahre nach hinten erweitert, wird schnell klar, dass es stets einen Wechsel zwischen kalt und warm gegeben hat.
Es ist ernüchternd, aber auch unsere Vorfahren hatten bereits unter dem Klimawandel zu leiden bzw. profitierten teilweise auch davon.
Geologen werden speziell dafür ausgebildet, die Naturgeschichte zu dokumentieren und zu entschlüsseln.
Das hierzu benötigte Zeitgerüst heißt "Stratigraphie".
Und damit alles seine Ordnung hat, gibt es eine internationale Kommission zur Stratigraphie, die über Veränderungen im verwendeten Zeitschema wacht.
Eben diese Kommission hat sich im Juli 2018 zusammengesetzt und darüber diskutiert, wie man die letzten 12.000 Jahre (das sogenannte Holozän) am sinnvollsten gliedert.
Vertreter der harte Klimalinie hatten gefordert, die letzten 150 Jahre als "Anthropozän" zu bezeichnen.
Dieser Vorschlag wurde jetzt vom Gremium klar abgelehnt.
Stattdessen unterteilte man das Holozän in drei Stufen.
Oberes Holozän: Meghalayan (4200 Jahre vor heute bis heute)
Mittleres Holozän: Northgrippian (8200 bis 4200 Jahre vor heute)
Unteres Holozän: Greenlandian (11.700 bis 8200 Jahre vor heute)
-
Watts UP With That? (Antony Watts)
2018-08-13 en Blow to warmists, the proposed 'Anthropocene epoch has been denied by ICSThe global body tasked with naming geological eras, the International Commission on Stratigraphy, has rejected the proposed Anthropocene epoch, the controversial 'geological' epoch in which mankind allegedly dominates natural processes.
The international commission has now rejected the proposal and has instead split the Holocene Epoch into three different geological ages, all of which were primarily shaped by natural, not human factors.
Quelle / Source:
-
International Commission on Stratigraphy
2018-07 en ICS chart containing the Quaternary and Cambrian GSSPs and new stages (v 2018/07) is now released!
↑ Wir sollten jetzt die realen und nachteiligen Folgen von Abkühlung fürchten
![]()
![]()
de
Eisbohrkernen zufolge war das letzte Jahrtausend von 1000 bis 2000
das kälteste Millenium des gegenwärtigen Interglazials.
en
According to ice core records, the last millennium 1000AD - 2000AD has
been the coldest millennium of our current Holocene interglacial.

-
EIKE Europäisches Institut für Klima und Energie
Ed Hoskins / Chris Frey
2018-09-09 de Wir sollten jetzt die realen und nachteiligen Folgen von Abkühlung fürchtenUnser gegenwärtiges warmes Interglazial hat es erst möglich gemacht, dass sich die Zivilisation der Menschheit während der letzten 10.000 Jahre entwickeln konnte - von frühesten Ackerbau-Methoden bis zu den jüngsten Technologien.
Eisbohrkernen zufolge war das letzte Jahrtausend von 1000 bis 2000 das kälteste Millenium des gegenwärtigen Interglazials.
Am deutlichsten wird dieser Umstand illustriert, wenn man die Ergebnisse aus den Eisbohrkernen im Zeitmaßstab von Jahrtausenden darstellt, und zwar zurück bis zum Zeitalter des Eemian.
-
Ice Age Now / Ed Hoskins
2018-09-01 de We should now fear the real and detrimental effects of coolingOur current, warm, interglacial has been the enabler of mankind's civilisation for the last 10,000 years, from mankind's earliest farming to the most recent technologies.
According to ice core records, the last millennium 1000AD - 2000AD has been the coldest millennium of our current Holocene interglacial.
This point is more fully illustrated with ice core records on a millennial basis back to the Eemian period here.
↑ Hamburger Forsythie muss wohl auf die schwarze Klimaleugnerliste
-
Die kalte Sonne (Fritz Vahrenholt & Sebastian Lüning)
Sebastian Lüning und Josef Kowatsch
2018-04-13 de Hamburger Forsythie muss wohl auf die schwarze KlimaleugnerlisteAm 4. April 2018 war es wieder soweit.
Auf der Hamburger Lombardsbrücke hat die Forsythie geblüht.
Und in China ist ein Sack Reis umgefallen?
Nein, die Forsythie hat eine wichtige Aufgabe inne, ihr Blühbeginn informiert nämlich über den Klimawandel.
Vereinfacht ausgedrückt:
Je früher sie blüht, desto wärmer das Klima. Das leuchtet ein.
Die Jahreszeiten verschieben sich, lesen wir allerorten in der Zeitung.Ob der Frühling wohl bald schon im Februar beginnt?
Wie viele unser Leser wissen, zeigt sich die Hamburger Forsythie gänzlich unkooperativ.
In den letzten 30 Jahren verpätet sich nämlich ihr Blühbeginn immer weiter.
Als hätte sie das Memo zur Klimakatastrophe nicht erhalten.
Sie macht das glatte Gegenteil von dem, was man erwartet hätte.
Auf Wikipedia zeigte man sich verwirrt und schrieb einfach, was man erwartet hatte, nicht was wirklich auftrat.
Wir ertappten die Aktivisten dabei, was schön peinlich war.
Mit dem 4. April blühte die Promi-Forsythie dieses Jahr besonders spät.
Nur dreimal in den letzten 30 Jahren kamen die Blüten noch später (Abb. 1).
Ganz offensichtlich war es ihr Anfang 2018 viel zu kalt, so dass sie ihre schmucken Blüten möglichst lange im warmen Inneren hielt.
| de | en | fr |
|---|---|---|
|
Neue Kälteperiode Meldungen |
New Cold Period News |
Nouvelle periode froide Actualités |
| de |
▶ Internet-Terror: Manipulation von Wikipedia durch einen Administrator ▶ Das Lexikon der Lügen ▶ Vom Onlinelexikon zur Propagandamaschine: Zensur, Einschüchterung und arglistige Täuschung ▶ Wikipedia: Klima-Fälscher Connolley: Der Mann, der unser Weltbild umschrieb ▶Die dunkle Seite von WIKIPEDIA: EIKE Zensur - kurz und knapp [Who is who (Skeptische Institute): EIKE; Wikipedia: Websites, Opfer: EIKE, Manipulatoren: Andol] |
|||||
|---|---|---|---|---|---|---|
| en |
▶ At Wikipedia, one man engineers the debate on global warmingator |
|||||
| fr |
▶ A Wikipedia, un homme dirige le débat sur le réchauffement climatique et à sa manière |
↑ en Don't Tell Anyone, But We Just Had Two Years Of Record-Breaking Global Cooling
-
Watts UP With That? (Antony Watts)
2018-05-17 en Don't Tell Anyone, But We Just Had Two Years Of Record-Breaking Global CoolingThe drop in temperatures at least merits a "Hey, what's going on here?" story.
Inconvenient Science:
NASA data show that global temperatures dropped sharply over the past two years.
Not that you'd know it, since that wasn't deemed news.
Does that make NASA a global warming denier?
↑ Die WikiManufaktur
↑ Schnee- und Temperaturtrends in den Alpen: 120 Jahre Klimageschichte rund um den Arlberg
-
Günther Aigner
2018-02-01 en
Lech-Zürs: Eine Analyse historischer Temperatur- und Schneemessreihen
Agenda:
de Deutsche Untertitel können "angeklickt" werden.
en GERMAN SUBTITLES AVAILABLE! Please find this Speech with English Subtitles in our YouTube-Channel.
-
01:25 - Zitate des Kulturpessimismus
-
06:52 - Wintertemperaturen am Galzig (und Säntis, CH)
-
14:34 - Schneemessreihen aus Lech
-
22:39 - Schneemessreihen aus Zürs
-
25:52 - Die Entwicklung der Skisaisonlängen (Tage mit Skibetrieb)
-
27:51 - Klimatische Entwicklung der Bergsommer
-
33:26 - Zusammenfassung
-
34:58 - Beantwortung der Eingangsfrage
-
35:51 - Fachlicher Austausch (Experten)
-
36:05 - Literatur und Messdaten
-
36:22 - Biografie Günther Aigner
Vortrag in der "Postgarage Lech" am 01. Februar 2018.
Der Tiroler Skitourismusforscher Günther Aigner gibt einen spannenden Überblick über mehr als 120 Jahre Klimageschichte rund um den Arlberg.
Mit Hilfe von amtlichen Messdaten geht er verschiedenen Fragen nach:
Stimmt es, dass es in Lech früher mehr geschneit hat?
Um wie viel Grad Celsius haben sich die Winter am Arlberg (Galzig) in den letzten Jahrzehnten erwärmt?
Stimmt es, dass die Skisaisonen deshalb immer kürzer werden?
Oder gibt es eine Lücke, die zwischen der öffentlicher Wahrnehmung und den amtlichen Messdaten klafft?
-
Die kalte Sonne (Fritz Vahrenholt & Sebastian Lüning)
2018-02-27 de Schnee- und Temperaturtrends in den Alpen: 120 Jahre Klimageschichte rund um den ArlbergKlimadiskussion in der Sackgasse.
Am Ende zählen nur harte Fakten, langjährige Klimareihen und der vorindustrielle Kontext, der bitte nicht erst in der Kleinen Eiszeit beginnt, sondern auch frühere Wärmephasen mit einschließt.
Der Tiroler Skitourismusforscher Günther Aigner hat dies längst erkannt und setzt sich engagiert für eine rationale Diskussion auf solider Datengrundlage ein.
In mühsamer Fleißarbeit hat er Klimadaten zu Schnee und Temperaturen in den Alpen gesammelt und in anschaulichen Abbildungen zusammengestellt.
Am 1. Februar 2018 hielt er einen sehenswerten Vortrag in der "Postgarage Lech", den sich alle Klimainteressierten und regionalen Entscheidungsträger der Alpenregion auf jeden Fall anschauen sollten:
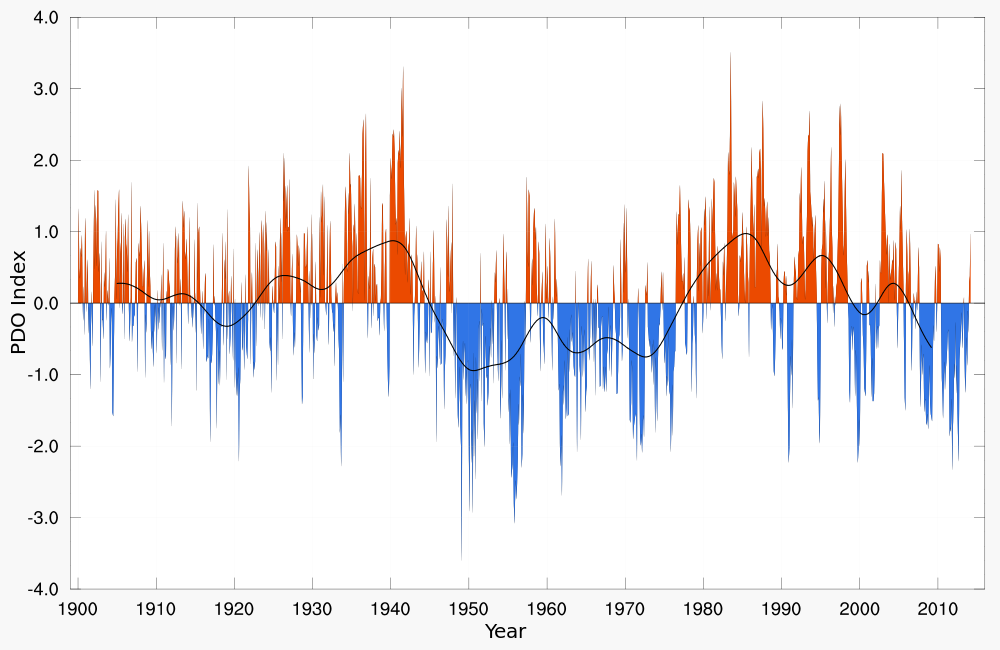
↑ Ach wie gut, dass niemand weiß, dass ich PDO heiß'
![]()
![]() Temperaturentwicklung in den USA während der Sommermonate.
Temperaturentwicklung in den USA während der Sommermonate.

Die Ähnlichkeit im Verlauf mit dem PDO-Ozeanzyklus ist frappierend
![]()
![]() Verlauf des PDO-Ozeanzyklus
Verlauf des PDO-Ozeanzyklus
-
Die kalte Sonne (Fritz Vahrenholt & Sebastian Lüning)
2018-01-28 de Ach wie gut, dass niemand weiß, dass ich PDO heiß'Die Sommertemperaturen in den USA nahmen einen unerwarteten Verlauf in den letzten 90 Jahren.
In den 1930ern waren die Sommer ziemlich heiß, zum Teil sogar heißer als heute.
Dazwischen sackten die Temperaturen jahrzehntelang ab.
Extrapoliert man den Zyklus in die Zukunft,
kann man schon ahnen, was als nächstes kommt:
Die Sommer in den USA werden wieder kälter werden.
Ein Paper von Alter et al. 2017 kommt zu einem interessanten Schluss:
Die Sommertemperaturen in den USA hatten im letzten Jahrhundert wenig mit dem CO2 zu tun.
⇧ 2017
↑
Kein neuer Rekord: Globale Mitteltemperatur 2016 erreichte lediglich
das Niveau von 1998
en
@NOAA data demonstrates that 2016 was not the 'hottest year ever'
in the USA
-
Die kalte Sonne (Fritz Vahrenholt & Sebastian Lüning)
2017-01-11 de Kein neuer Rekord: Globale Mitteltemperatur 2016 erreichte lediglich das Niveau von 1998
-
Die kalte Sonne (Fritz Vahrenholt & Sebastian Lüning)
2017-01-13 de Die ungeliebte Verlangsamung der Erwärmung: Tricksen bis der Arzt kommtMit dem neuen Temperaturrekord hat es 2016 nicht geklappt.
Trotzdem wollten Klimaaktivisten und kooperierende Journalisten zu Jahresbeginn der Bevölkerung eine scharfe Klimaermahnung mit auf den Weg geben.Da kam ihnen ein soeben veröffentlichtes Paper gerade recht:
Die Erwärmungspause ("der Hiatus") bzw. die Verlangsamung der Erwärmung ("Slowdown") der letzten 18 Jahre existiere gar nicht, alles nur Schall und Rauch.In Wahrheit sei es kräftig wärmer geworden, und zwar in den Ozeanen.
Ganz vorne bei der Berichterstattung mit dabei ist Spektrum der Wissenschaft, eine Plattform, auf der auch der Potsdamer Klimaaktivist Stefan Rahsmtorf schreibt.
Der Redaktionsleiter von spektrum.de, Daniel Lingenhöhl, erklärte den Lesern höchstpersönlich:
Klimawandel: Keine verlangsamte Erwärmung im Ozean
Während der letzten 15 Jahre sollen sich die Weltmeere nur verlangsamt erwärmt haben.
Manche sprachen sogar von einer Pause.
Doch das wurde erneut widerlegt.Daniel Lingenhöhl, Joachim Müller-Jung, Zeke Hausfather et al. kämpfen unentwegt gegen den unerwarteten Hiatus an - und machen sich dabei gänzlich lächerlich.
Was werden sie in zehn Jahren im Rückblick zu ihrem Aktivismus zu sagen haben, wenn die wahre Temperaturentwicklung bekannt sein wird?
Jede Wette, dass sie dann gar nicht mehr gerne an ihre wilde Aktivistenzeit erinnert werden wollen
-
Watts Up With That? (Antony Watts)
2017-01-19 en @NOAA data demonstrates that 2016 was not the 'hottest year ever' in the USAMuch of that "record heat" is based on interpolation of data in the Arctic, such as BEST has done.
But in reality, there's just not much data at the poles, there is no permanent thermometers at the North pole, since sea ice drifts, is unstable, and melts in the summer as it has for millennia.
Weather stations can't be permanent in the Arctic ocean.
So, the data is often interpolated from the nearest land-based thermometers.
-
Watts Up With That? (Antony Watts)
2017-01-03 en 2016 edges 1998 as warmest year in satellite record - by 0.02°C
-
Dr. Roy Spencer
2017-01-03 en Global Satellites: 2016 not Statistically Warmer than 1998The resulting 2016 annual average global temperature anomaly is +0.50 deg. C, which is (a statistically insignificant) 0.02 deg. C warmer than 1998 at +0.48 deg. C.
We estimate that 2016 would have had to be 0.10 C warmer than 1998 to be significantly different at the 95% confidence level.
Both 2016 and 1998 were strong El Nino years.
⇧ 2016
↑
Beginnt die globale Abkühlung?
Globale Mitteltemperatur stürzt um mehr als 1 °C steil ab.
en
Steepest drop in global temperature on record
![]()
![]()

-
EIKE Europäisches Institut für Klima und Energie
Michael Limburg
2016-12-01 de Beginnt die globale Abkühlung? Globale Mitteltemperatur stürzt um mehr als 1 °C steil ab.Die globale Mitteltemperatur über Land zeigt eine noch nie so gemessene steile Abkühlung von 1,2 K.
Die Medien übergehen diese dramatische Abkühlung mit Schweigen.
Setzt sie sich fort, stehen wir evtl. am Beginn einer neuen "kleinen Eiszeit".
Nichts würde ich mehr bedauern als das.
-
Watts Up With That? (Antony Watts)
2016-11-28 en Steepest drop in global temperature on record
-
Global average temperatures over land have plummeted by more than 1C
-
Comes amid mounting evidence run of record temperatures about to end
-
The fall, revealed by Nasa satellites, has been caused by the end of El Nino
This means it is possible that by some yardsticks, 2016 will be declared as hot as 2015 or even slightly hotter - because El Nino did not vanish until the middle of the year.
But it is almost certain that next year, large falls will also be measured over the oceans, and by weather station thermometers on the surface of the planet - exactly as happened after the end of the last very strong El Nino in 1998.
If so, some experts will be forced to eat their words.
-
Quelle / Source:
-
THE MAIL ON SUNDAY / DAVID ROSE
2016-11-26 en Stunning new data indicates El Nino drove record highs in global temperatures suggesting rise may not be down to man-made emissions
↑ Was ist da los? Der Hochsommermonat August wird in Deutschland nicht mehr wärmer
Man kann den Temperaturgang seit 1931 in vier Abschnitte einteilen:
-
Während der Nazizeit angenehm warm.
-
Nach dem Kriege sanken die Durchschnittstemperaturen und die kühlen Augustmonate hielten an bis 1975.
-
Ab 1975 erfolgte dann ein rasanter Anstieg auf ein neues Temperaturhoch.
-
Seit der Jahrtausendwende haben wir dieses Temperaturhoch überschritten, die Temperaturen des Monates August sinken wieder.
Insgesamt liegt das Temperaturniveau aber jetzt höher als zu Beginn der Betrachtung seit 1931.
Der nun seit fast 20 Jahren zu beobachtende Temperaturstillstand ist nicht mehr zu sehen!
Um die Entwicklung dramatischer aussehen zulassen als sie ist, greifen einige Berichterstatter zu einem Trick:
Sie lassen die Temperaturbetrachtung inmitten des Kältetales beginnen.
Meist beginnt ihre Betrachtungskurve 1961 (Abbildung 2).
Tatsächlich sind aus dem Kältetal der 60er Jahre heraus bis heute die Augusttemperaturen deutlich angestiegen.
Der Hochsommermonat August wurde in den letzten 55 Jahren deutlich wärmer.
Die Durchschnittstemperaturen lagen damals laut Trendlinie bei 16 Grad, während wir in der Gegenwart um 2 Grad höher liegen.
|
|
|
|
|
|


-
Die kalte Sonne (Fritz Vahrenholt & Sebastian Lüning)
Josef Kowatsch und Sebastian Lüning
2016-09-03 de Was ist da los? Der Hochsommermonat August wird in Deutschland nicht mehr wärmer
↑
Mogeln, tricksen, täuschen
Bei Harald Lesch sind Hopfen (und Malz) verloren
-
Harald Lesch 2016-06-29 de
Das AfD-Programm wissenschaftlich geprüft
-
EIKE Europäisches Institut für Klima und Energie
2016-07-01 de ZDF Wissenschaftserklärer Harald Lesch gegen die AfD: Mogeln, tricksen, täuschen.Das ZDF hat es sich nicht nehmen lassen, seinen mit Gebührengeldern bezahlten Wissenschaftserklärer Prof. Harald Lesch, auf die Klimaaussagen des AfD Programmes loszulassen.
Streng wissenschaftlich sachlich, wie Lesch gleich am Anfang versichert.
Mit seinem Youtube Video zu den Klimaaussagen im AfD Programm sorgt er nun für großes Aufsehen.
Mehr als 120.000 Besucher in wenigen Tagen zeigen, dass das Thema für viele im Lande von hohem Interesse ist.
Unsere Autoren Prof. Dr. Horst-Joachim Lüdecke und Michael Limburg haben sich das Lesch Video angesehen und fanden folgendes....
EIKE Europäisches Institut für Klima und Energie
2016-07-09 de Bei Harald Lesch sind Hopfen (und Malz) verloren
-
EIKE Europäisches Institut für Klima und Energie
Helmut Kuntz
2016-08-24 de Wenn der Hopfen nicht stirbt, stirbt dann der Klimawandel?Der Hopfen - wohl eine Leitpflanze des Klimawandels - muss in den Vorhersagen regelmäßig sterben, aber er spielt die Klimahysterie nicht mit.
Aus einem unerfindlichen Grund haben sich Klimawandel-Jünger(-innen) auf Hopfen als eine "Leitpflanze" für den in Deutschland besonders schlimmen Klimawandel "eingeschossen".
Regelmäßig leidet er darunter und Prof. Harald Lesch als neuer Klimawandel-Guru Bayerns ging sogar so weit, die Hopfenpflanze deshalb in Deutschlands Zukunft ganz aussterben zu lassen.
-
Die kalte Sonne (Fritz Vahrenholt & Sebastian Lüning)
2016-07-20 de Harald Leschs Prüfung des AfD-Klimaprogramms wissenschaftlich geprüft
| Harald Lesch |
Astrophysiker, Naturphilosoph, Wissenschaftsjournalist, Fernsehmoderator, Professor für Physik an der LMU München Lehrbeauftragter für Naturphilosophie an der Hochschule für Philosophie München. ▶Harald Lesch: Who is who (Aktivist der anthropogenen Globalen Erwärmung) ▶Harald Lesch: Wikipedia (Profiteure) |
↑ en Say Hello to La Niña Conditions
![]()
![]() Say Hello to La Niña Conditions
Say Hello to La Niña Conditions

-
Watts Up With That? (Antony Watts)
2016-07-18 en Say Hello to La Niña Conditions
↑ Globale Mitteltemperatur! Abschluss-Statistik 2015: jetzt einschließlich Dezember 2015
Final 2015 Statistics (Now Includes December Data)
![]()
![]()
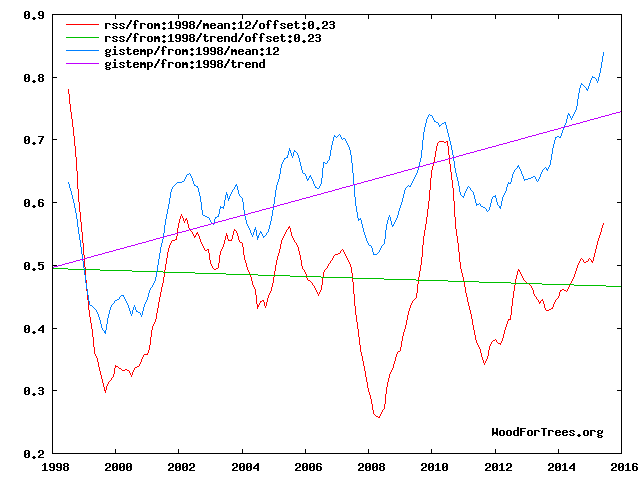
-
EIKE Europäisches Institut für Klima und Energie
2016-02-01 de Globale Mitteltemperatur! Abschluss-Statistik 2015: jetzt einschließlich Dezember 2015Eine der großen Schlagzeilen des Jahres 2015 sind die Rekorde brechenden Anomalien der Temperatur-Datensätze des Jahres 2015 im Vergleich zu den sich aus Satellitenbeobachtungen ergebenden Anomalien, die das Jahr 2015 an die dritte Stelle setzen.
Die Diskrepanz zwischen 1998 und 2015 zwischen beiden Quellen ist nunmehr größer denn je, wie man auf der Graphik rechts erkennt.
Man vergleiche die blauen Endpunkte mit den roten Endpunkten.
-
Watts Up With That? (Antony Watts)
2016-01-27 en Final 2015 Statistics (Now Includes December Data)One of the big stories from 2015 is the record shattering anomalies
on the surface temperature data sets for 2015
versus the third ranked satellite anomalies for 2015.
The discrepancy between 1998 and 2015 is now larger than it has ever been between the satellites and surface records as can be seen on the graphic above.
Compare the blue end points with the red end points.
| de | en | fr |
|---|---|---|
| Temperatur | Temperature | Température |
| Temperaturmessungen durch Satelliten | Satellite Temperature Data | Température mesurages par satelllites |
| de | en | fr |
|---|---|---|
|
Klimawandel: Probleme Temperatur-Manipulationen Skandal Manipulationen Teil I, II, III Climategate Institute, Who's who, Mails |
Climate change: Problems Temperature Manipulations Scandal Manipulations Part I, II, III Climategate Institutes, Who's who, Mails |
Climat: Problèmes Manipulation des températures Scandale Manipulations partie I, II, III Climategate Instituts, Qui est qui, Méls |
↑
Wissenschaftler entlarvt schonungslos die Klima Behauptung der NOAA
en
In defense of satellite temperature data -
Dr. John Christy's powerful Senate testimony
-
EIKE Europäisches Institut für Klima und Energie
2016-02-10 en Wissenschaftler entlarvt schonungslos die Klima Behauptung der NOAAAngesichts der intensiven Kritik von alarmistischen Wissenschaftlern, ging Dr. John Christy in einer Kongressanhörung ins Detail, warum die von Satelliten abgeleiteten Temperaturen sehr viel zuverlässigere Indikatoren für die Erwärmung [der Erde] gegenüber Oberflächenthermometern sind.
-
Watts Up With That? (Antony Watts)
2016-02-03 en In defense of satellite temperature data - Dr. John Christy's powerful Senate testimony yesterday2016-02-02 en
Dr John Christy: NOAA data shows downward trend of extreme high temps
since 1930s
Testifying before Congress, atmospheric scientist Dr John Christy illustrates that
NOAA's own data clearly shows that many more 100 degree days occurred in the 1930's than today.
Dr. Christy: "When you look at the United States record of extreme high temperatures
you do not see an upward trend at all.
In fact, it's slightly downward.
That does fly in the face of climate model projections."
Paris Climate Promise: A Bad Deal For America
US House Committee on Science, Space, and Technology
February 2, 2016U.S. House Committee on Science, Space & Technology
2016-02-02 en Testimony of John R. Christy University of Alabama in Huntsville.
⇧ 2015
↑ Solares Paradoxon Deutschlands, Teil I: Solare Zyklen in der deutschen und der globalen Temperaturmessreihe
![]()
![]() Temperatur in Deutschland
Temperatur in Deutschland
Nicht der Einfluss des CO₂, sondern der Einfluss der Sonne
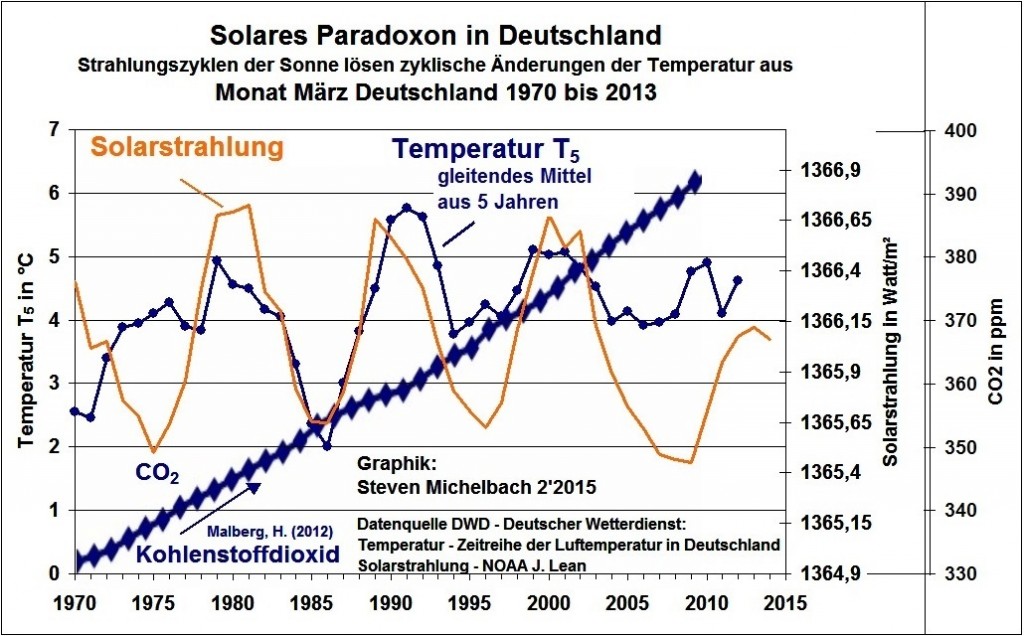
-
Die kalte Sonne (Fritz Vahrenholt & Sebastian Lüning)
Steven Michelbach, Geograph
2015-05-29 de Solares Paradoxon Deutschlands, Teil I: Solare Zyklen in der deutschen und der globalen TemperaturmessreiheFür Deutschland als Vorreiter beim Klimaschutz ist es deshalb ausgesprochen paradox,
dass gerade hier in den Temperaturen nicht der Einfluss des CO2, sondern der Einfluss der Sonne auf Klima und Wetter so markant hervortritt.
So hat die Sonne nicht nur die zurückliegende Klimageschichte geschrieben,
sondern sie ist auch für die Gegenwart und die Klimazukunft als wesentliche Kraft verantwortlich.
Die Graphik widerlegt die Aussage des IPCC
Die Aussage des IPCC: "Die Erwärmung des Klimasystems ist eindeutig.
Der größte Teil der beobachteten Zunahme der globalen mittleren Temperaturen seit Mitte des 20. Jahrhunderts ist sehr wahrscheinlich verursacht durch die beobachtete Zunahme anthropogener Treibhausgas-Emissionen."
ist mit der Graphik eindeutig widerlegt.
Es ist demnach sehr unwahrscheinlich, dass das anthropogene CO2 für die Klimaerwärmung der letzten Jahrzehnte verantwortlich ist!
Die Energiewende auf einer CO2-Verunglimpfung aufzubauen und den Einfluss der Sonne weiter zu vernachlässigen, wäre deshalb geradezu paradox.
↑ Klimawandel: Warum es in den Bergen trotzdem kälter wurde
![]()
![]()
![]() Schweizer Alpen
Schweizer Alpen
Stephan Bader erklärt die Entwicklung der Temperatur (SRF)

-
SRF
2015-04-23 de
Klimawandel: Warum es in den Bergen trotzdem kälter wurde
Im Winter 2011/12 mass man auf dem Jungfraujoch den kältesten Winter seit über 40 Jahren.
«Das ist eine signifikante Abkühlung», erklärt Stephan Bader vom Bundesamt für Meteorologie und Klimatologie ( MeteoSchweiz), «seit Anfang der 90er-Jahre stellen wir in den Gebirgsregionen einen Abwärtstrend fest.
Heute sind wir wieder ungefähr im gleichen Bereich wie vor dem Temperatursprung Ende der 80er-Jahre.»
Sicher ist:
Die Winter sind über die vergangenen 20 Jahre gesehen vor allem in den Schweizer Bergen deutlich kälter geworden.
Und es hat dort unterdessen wieder durchschnittlich so viel Schnee wie einst vor 35 Jahren.
Kommentare:
-
Die kalte Sonne (Fritz Vahrenholt & Sebastian Lüning)
2015-05-21 de Norwegens Finanzministerin zweifelt daran, dass der Mensch Hauptursache des Klimawandels istDeutsche IPCC-Freunde springen den Nachbarn zur Seite
Wird der IPCC jetzt den Schweizern die Weltklimaratszentrale in Genf wegnehmen? Deutsche IPCC-Freunde springen den Nachbarn zur Seite:
Einen Erklärungsversuch präsentierten Klimaforscher des deutschen Alfred-Wegener-Instituts. Kältere Winter, so die Fachleute, gebe es nicht trotz Klimaerwärmung, sondern gerade wegen ihr.
Die Ursache für die Abkühlung in West- und Mitteleuropa sehen sie in der fernen Arktis: Der Temperaturunterschied zwischen der kalten Arktis und den warmen Tropen verursache Westwinde, die im Winter eher mildere Luft zu uns bringen.
Eine nett gemeinte Hilfestellung. Allerdings hatte sich die renommierte ETH-Zürich bereits mit dieser Idee beschäftigt und sie als untauglich verworfen.
ETH Zürich lehnt schwindendes arktisches Meereis als Hauptauslöser für kalte europäische Winter ab
Quelle: Die kalte Sonne
2013-12-29 de Neue Studie der ETH Zürich lehnt schwindendes arktisches Meereis als Hauptauslöser für kalte europäische Winter abEs wird daher allmählich brenzlig im Alpenlande. Ganz offensichtlich boykottiert die heimische Bergwelt die Erwärmungsvorgaben des Weltklimarats.
Reise in eine ungewisse Zukunft...
Stategie vom Blick
Eine ganz andere Strategie als das SRF scheint das Boulevardblatt Blick zu fahren.
Hier ignoriert man einfach die wissenschaftlichen Fakten und behauptet frech das Gegenteil.
Offenbar fühlt man sich ziemlich sicher, dass niemand aus der Leserschaft die Fachliteratur und wahren Daten kennt.
Blick.ch behauptete am 24. April 2015 frech:Klimawandel: In den Bergen wird es schneller warm In Hochgebirgen wie den Alpen, den Rocky Mountains und dem Himalaya schreitet der Klimawandel schneller voran als in Tiefländern.
Wassermangel könnte schnell zum Problem werden.
Quelle: Blick
2015-04-24 de In den Bergen wird es schneller warm
| de | en | fr |
|---|---|---|
|
Auswirkungen des Klimas Gletscher |
Impacts of Climate Change Glaciers |
Impacts du changement climatique Glaciers |
↑
DWD widerspricht seinen eigenen Messungen
"Der Trend zu einem wärmeren Klima ist ungebrochen" (?)
en
German DWD Weather Services Own Data Contradict Its Alarmist Claims
Of "Uninterrupted Warming"
![]()
![]() DWD widerspricht seinen eigenen Messungen
DWD widerspricht seinen eigenen Messungen
"Der Trend zu einem wärmeren Klima ist ungebrochen" (?)

-
EIKE Europäisches Institut für Klima und Energie
Dr. D. E. Koelle
2015-04-30 de Der Deutsche Wetterdienst hat ein Problem mit dem KlimaEigentlich hält man den Deutschen Wetterdienst für eine seriöse Organisation, die uns zuverlässige Wetterdaten liefert.
Aber auf dem Klima-Gebiet wachsen die Zweifel, wenn man die Äußerungen führender DWD-Vertreter anlässlich ihrer Pressekonferenz in Berlin über das Jahr 2013 liest.
Dort wurde verkündet, "dass die Erwärmung fortschreitet" - auch wenn dies nicht der Fall ist, nach den Daten des DWD speziell nicht in Deutschland.
Selbst der Leiter des MPI für Meteorologie in Hamburg, Prof. Dr. Marotzke, stellte fest
"Ich kenne keinen seriösen Kollegen, der leugnen würde, dass es in den letzten Jahren nicht mehr wärmer geworden ist".
-
NoTricksZone (Pierre L. Gosselin)
2015-04-29 en German DWD Weather Services Own Data Contradict Its Alarmist Claims Of "Uninterrupted Warming"
Quelle / Source:
de Panik-Küche en Panic laboratory fr Marmite alarmiste
-
DWD Deutscher Wetterdienst
2015-03 de März 2015: Der Trend zu einem wärmeren Klima ist ungebrochen
de Klimaentwicklung in Deutschland
| de | en | fr |
|---|---|---|
|
Neue Kälteperiode Kaltzeit |
New Cold Period Cold Period |
Nouvelle periode froide Periode froide |
| Voraussagen | Predictions | Prédictions |
| Kälte: Warnungen | Cooling: Warnings | Refroidissement: Avertissements |
| Erwärmung: Entwarnung | Warming: All-Clear | Réchauffement: Fin de l'alerte |
| Eiszeiten | Ice Ages | Glaciations |
↑ en No global warming for 18 years 9 months
-
Watts Up With That? (Anthony Watts)
Christopher Monckton of Brenchley
2015-12-04 en The robust Pause resists a robust el Niño Still no global warming at all for 18 years 9 months
↑ Deutschland Temperaturen 2015
-
Die kalte Sonne (Fritz Vahrenholt & Sebastian Lüning)
2016-01-17 de Wo bleibt die 'ungebremste' Erwärmung? Kein neuer Wärmerekord 2015 - trotz El Nino-UnterstützungVon Sebastian Lüning und Josef Kowatsch
2016-01-25 de Deutschland-Temperaturen 2000-2015: 7 Monate wärmer, 5 Monate kälter2016-02-08 de Deutschlandtemperaturen 1995-2015: 8 Monate wärmer, 4 Monate kälter
2016-02-13 de Deutschland-Temperaturen 1990-2015: 7 Monate wärmer, 5 Monate kälterr
Quellen: Wikipedia de Zeitreihe der Lufttemperatur in Deutschland
↑ en WoodForTrees.org 1985-2015
![]()
![]() 1987_2002_2015
1987_2002_2015

⇧ 2014
↑
Erwärmungspause seit 1998
en
Hiatus in Global Warming since 1998

|
|
|
|
|
|

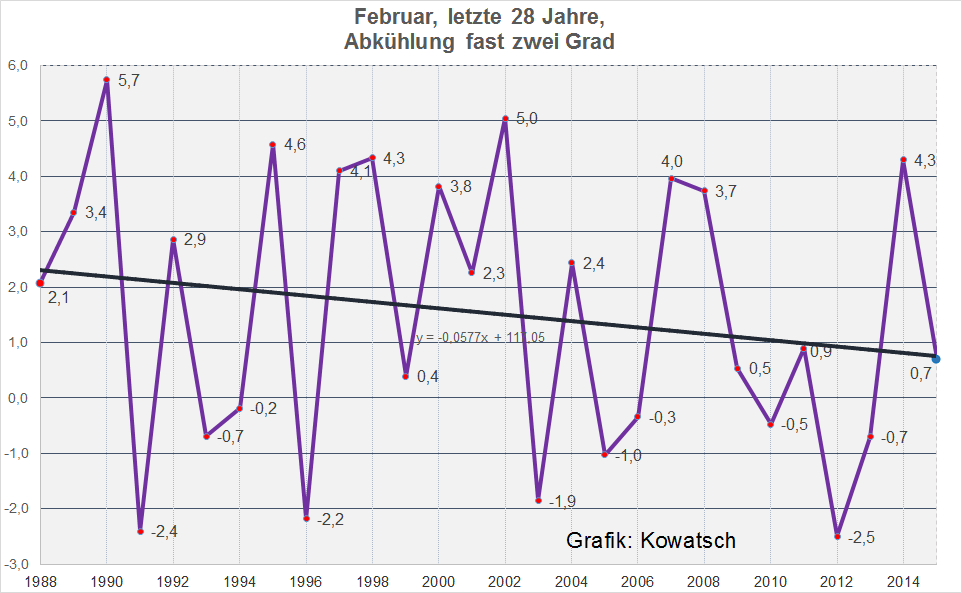
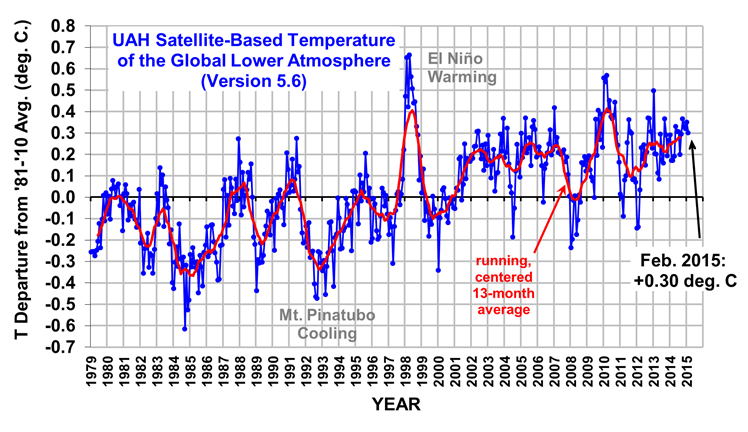


↑
en
100 Year Snow Records broken across the South Eastern US on October
31st and November 01st
2015-2035 Mini Ice Age
Agricultural Losses 2014 from Cold Temperatures
-
Watts Up With That? (Antony Watts)
David DuByne
2014-11-03 en
100 Year Snow Records broken across the South Eastern US on October
31st and November 01st
2014-10-02 en
2015-2035 Mini Ice Age
(
Source)
1 Sunspots and Rising Grain Prices
2 Snow and Record Cold 2014
3 Nine Arctic Seas Gain Ice 2014
4 Agricultural Losses 2014 from Cold Temperatures
⇧ 2012
↑
Globale Temperatur seit 16 Jahren nicht mehr angestiegen
en
Global warming stopped 16 years ago
![]()
![]()

|
|
|
-
Die kalte Sonne (Fritz Vahrenholt & Sebastian Lüning)
2012-10-16 de Neue HadCRUT-Daten belegen: Globale Temperatur seit 16 Jahren nicht mehr angestiegenDie globale Temperatur ist seit nunmehr 16 Jahren nicht mehr angestiegen
Erklärung zu den Datensätzen:
Einer der wichtigsten globalen Temperaturdatensätze stammt vom Hadley Centre des britischen meteorologischen Dienstes in Zusammenarbeit mit der Climate Research Unit (CRU) der University of East Anglia.
- Während das Hadley Centre für die Meeresoberflächentemperaturen zuständig ist,
- kümmert sich die CRU um die Temperaturen auf den Kontinenten.
-
Zusammen geben sie den sogenannten
HadCRUT-Datensatz heraus.
-
Wood for Trees
en Interactive Graphs
-
Wood for Trees
-
EIKE Europäisches Institut für Klima und Energie
2012-10-16 de Erneut offiziell bestätigt: Globale Erwärmung hörte vor 16 Jahren auf!Neuen, während der vorigen Woche veröffentlichten, Daten zufolge, hat die Welt vor fast 16 Jahren aufgehört, sich weiter zu erwärmen.
-
Die Abbildungen zeigen, dass es seit Anfang 1997 bis August 2012 keinen erkennbaren der globalen Temperaturen gegeben hat;
-
Dies bedeutet, dass die 'Pause' der globalen Erwärmung jetzt schon genauso lange gedauert hat wie die vorhergehende Periode, während der die Temperaturen gestiegen sind, also von 1980 bis 1996.
Vorhersage der verwendeten Computermodelle:
Professor Judith Curry, Leiterin des Climate Science Department an der amerikanischen Eliteuniversität Georgia Tech, sagte der Mail on Sunday, dass es ganz klar sei, dass die zur Vorhersage der zukünftigen Erwärmung verwendeten Computermodelle 'ein totaler Fehlschlag' waren.Phil Jones University of East Anglia:
Phil Jones räumte ein, dass er und seine Kollegen den Einfluss der 'natürlichen Variabilität' nicht verstünden - Faktoren wie langzeitliche Zyklen der Wassertemperatur und Änderungen der Sonnenstrahlung.Dabei hat er schon im Jahr 2009 in einer durch ClimateGate bekannt gewordenen E-Mail an einen Kollegen gesagt: "Das Plateau, das sich bereits abzeichnet und von Wissenschaftlern diskutiert wird - unter dem Strich: der 'Nicht-aufwärts-Trend' muss insgesamt 15 Jahre andauern, bevor wir uns Sorgen machen".
Aber obwohl dieser Zeitpunkt jetzt vorüber ist, hat er gesagt, dass er seine Meinung über die bedrohlichen Vorhersagen der Modelle nicht geändert hat:
"Ich glaube immer noch, dass die gegenwärtige Dekade um 0,17 Grad wärmer ausfallen wird als die vorige, die wärmer war als die neunziger Jahre".
-
-
Watts Up With That? (Antony Watts)
2012-10-13 en Report: Global warming stopped 16 years ago
2012-10-15 en The Met office responds to 'Global warming stopped 16 years ago'
'Yet in 2009, when the [temperature] plateau was already becoming apparent and being discussed by scientists, Jones told a colleague in one of the Climategate emails: "Bottom line: the 'no upward trend' has to continue for a total of 15 years before we get worried.
Climat Change Dispatch
Quellen / Sources:
-
Daily Mail (Mail Online)
2012-10-13 en Global warming stopped 16 years ago, reveals Met Office report quietly released... and here is the chart to prove it-
The figures reveal that from the beginning of 1997 until August 2012 there was no discernible rise in aggregate global temperatures
-
This means that the 'pause' in global warming has now lasted for about the same time as the previous period when temperatures rose, 1980 to 1996
-
-
Wood for Trees
en Interactive Graphs
de Panik-Küche en Panic laboratory fr Marmite alarmiste
-
EIKE Europäisches Institut für Klima und Energie
2012-11-07 de Klima-Katastrophe nun "schon" vor 2099 !? Deutsche Behörden wissen, was im Laufe des 21. Jahrhunderts beim Extrem-Wetter los ist.Einige Deutsche Behörden/Institute wie der (Deutsche Wetter Dienst) DWD haben in einer Presse-Mitteilung am 30. Oktober 2012 ausgeführt, wie sich in Deutschland im Laufe des 21. Jahrhunderts extreme Wetterlagen infolge einer Erderwärmung häufen werden, und was dagegen zu tun ist.
Daß es seit 14 Jahren keine Erderwärmung mehr gibt, daß weder die Wetterdienste noch das IPCC bisher solche Trends finden, und daß alle diese Annahmen auf unsicheren Computer-Szenarien beruhen - das wird mit keinem Wort erwähnt.
-
Pressemitteilung
BBK, BBSR, DWD, THW und UBA
2012-10-30 de
Gewappnet sein für extreme Wetterereignisse
Extreme Wetterereignisse stellen unsere Gesellschaft schon heute immer wieder vor Herausforderungen:
Hitzewellen, wie etwa im Sommer 2003, bringen enorme gesundheitliche Belastungen mit sich und können viele Todesopfer fordern, Starkniederschläge und Winterstürme verursachen immer wieder immense Schäden an Infrastruktur und Gebäuden und bringen Menschen in Gefahr.
Es ist zu erwarten, dass Extremwetterereignisse und deren Folgen künftig eine noch größere Bedeutung für Mensch und Umwelt haben werden.
Daher stellt sich die Frage, wie sich die Häufigkeit und Intensität von Extremwetterereignissen verändern wird und wie wir uns darauf vorbereiten können.
- Das Bundesamt für Bevölkerungsschutz und Katastrophenhilfe (BBK),
- das Bundesinstitut für Bau-, Stadt- und Raumforschung (BBSR),
- der Deutsche Wetterdienst (DWD),
- die Bundesanstalt Technisches Hilfswerk (THW)
- und das Umweltbundesamt (UBA)
haben sich in der Strategischen Behördenallianz Anpassung an den Klimawandel zusammengefunden, um diesen Fragen gemeinsam nachzugehen.
Im Rahmen der heutigen Pressekonferenz werden daher nicht nur ausgewählte Ergebnisse eines gemeinsamen Forschungsvorhabens, sondern anhand dessen auch die Arbeitsschwerpunkte der beteiligten Behörden innerhalb der Behördenallianz vorgestellt.
Deutschland muss sich auf Wetterextreme vorbereiten
(Dr. Paul Becker, Vizepräsident des DWD)In Konsequenz die Warnung der Bevölkerung und deren Selbsthilfefähigkeit verbessern
(Christoph Unger, Präsident BBK)Städte müssen sich gegen Hitze wappnen
(Dir. Prof. Harald Herrmann, Leiter des BBSR)Extremwetterereignisse erfordern immer wieder den Einsatz von Helferinnen und Helfern im Bereich des gesamten Bevölkerungsschutzes
(Gerd Friedsam, Vizepräsident des THW)Über Klimarisiken muss intensiv informiert werden
(Dr. Kora Kristof, Leiterin Grundsatzabteilung des UBA)
-
Die kalte Sonne (Fritz Vahrenholt & Sebastian Lüning)
2012-11-05 de IPCC-Anhänger argumentieren gegen den Erwärmungsstopp: Zeit für einen Faktencheck
↑ Langfristiger Abkühlungstrend Nordeuropas über die letzten Jahrtausende
Langfristiger Abkühlungstrend Nordeuropas über die letzten Jahrtausende erstmals präzise berechnet
![]()
![]() Langfristiger Abkühlungstrend Nordeuropas über die letzten
Jahrtausende
Langfristiger Abkühlungstrend Nordeuropas über die letzten
Jahrtausende
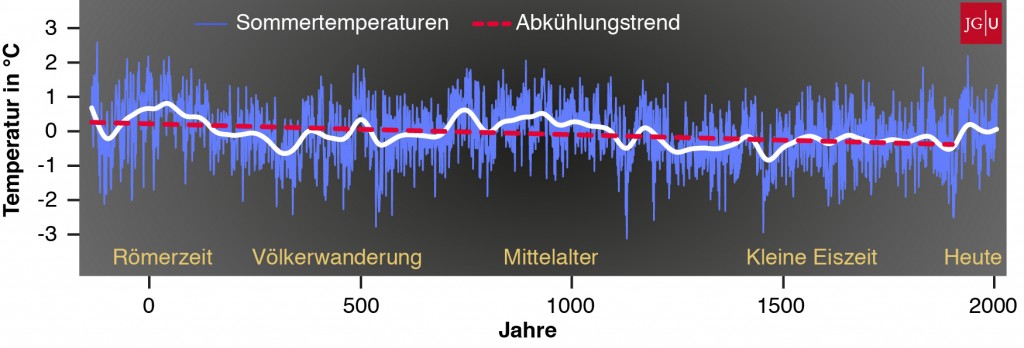
Eine 2.000-jährige Klimarekonstruktion für Nordeuropa
Langfristigen Abkühlungstrend über die letzten Jahrtausende präzise berechnet.
Temperaturen zur Römerzeit und im Mittelalter wurden bis dato als zu kühl eingeschätzt
"Diese Befunde sind auch insofern von klimapolitischer Bedeutung, da sie die Beurteilung des aktuellen Klimawandels im Vergleich zu den historischen Warmphasen beeinflussen."
Längerfristigen Abkühlungstrend Abkühlung von -0.3°C pro Jahrtausend
Die neue Klimakurve zeigt neben diesen Kalt- und Warmphasen aber noch ein Phänomen, mit dem in dieser Form nicht zu rechnen war.
Erstmalig konnten die Forscher anhand der Baumjahrringe einen viel längerfristigen Abkühlungstrend, der sich kontinuierlich über die letzten 2.000 Jahre abspielte, präzise berechnen.
Auf Grundlage der neuen Befunde macht dieser Trend, der durch langsame Veränderungen des Sonnenstandes aber auch der Distanz der Erde zur Sonne verursacht wurde, ein Abkühlung von -0.3°C pro Jahrtausend aus.
"Eigentlich erscheint diese Zahl nicht sonderlich imposant", so Professor Esper, "allerdings ist sie im Vergleich zur globalen Erwärmung, die bis heute auch weniger als 1°C beträgt, nicht zu vernachlässigen.
Wir konnten nun zeigen, dass die großräumigen Klimarekonstruktionen, die auch vom internationalen Klimarat 'IPCC' verwendet werden, den langfristigen Abkühlungstrend über die letzten Jahrtausende unterschätzen."
Temperaturrekonstruktion der letzten 2000 Jahre für Nordskandinavien.
![]()
![]() Temperaturrekonstruktion der letzten 2000 Jahre für Nordskandinavien
Temperaturrekonstruktion der letzten 2000 Jahre für Nordskandinavien

2000-jährigen Untersuchuchungszeitraum mit Abweichungen um 2 Grad.
Wenn man die Sommertemperaturen von 5-Jahres-Perioden betrachtet, findet man Unterschiede von bis zu 5 Grad.
Temperaturentwicklung von Zentral-Grönland für die letzten 4000 Jahre.
![]()
![]() Temperaturentwicklung von Zentral-Grönland für die letzten 4000 Jahre
Temperaturentwicklung von Zentral-Grönland für die letzten 4000 Jahre

Quelle / Source:
-
Die kalte Sonne (Fritz Vahrenholt & Sebastian Lüning)
2012-07-10 de Langfristiger Abkühlungstrend Nordeuropas über die letzten Jahrtausende erstmals präzise berechnet: Temperaturen zur Römerzeit und im Mittelalter wurden bis dato als zu kühl eingeschätzt
↑
Klaus-Eckart Puls:
G l o b a l C o o l i n g : Wo bleibt die Erderwärmung
en
"Goodbye Warming - Hello Cooling"
![]()
![]()
de
Wo bleibt die vorhergesagte Erderwärmung?
en Goodbye Warming - Hello Cooling

![]()
![]() Wo bleibt die vorhergesagte Erderwärmung?
Wo bleibt die vorhergesagte Erderwärmung?
-
EIKE Europäisches Institut für Klima und Energie
2012-02-25 de G l o b a l C o o l i n g : Wo bleibt die Erderwärmung ?
-
Die kalte Sonne (Fritz Vahrenholt & Sebastian Lüning)
2012-02-25 de Klaus-Eckart Puls: Wo bleibt die vorhergesagte Erderwärmung?
-
No Tricks Zone (P Gosselin)
2012-02-25 en Veteran Meteorologist Klaus Eckhart Puls: "Goodbye Warming - Hello Cooling". From Wrong Science To Fraud Science
⇧
2 Klimaverlauf
en Temperatur & Climate
fr Température & climat
- a CO2 Konzentration und Temperatur vor 600 Millionen Jahren
- b Entwicklung seit 100'000 Jahren
- c Temperaturverlauf der letzten 20'000 Jahre in Grönland
- d Holozän
- e Arktischen Meereises in den 1960er Jahren
| de | en | fr |
|---|---|---|
|
Klima Wandel Klima Geschichte |
Climate Change Climate History |
Climat Changement Histoire du climat |
↑
a CO2 Konzentration und Temperatur vor 600
Millionen Jahren
en
CO2-Concentration in the atmosphere in the
last 600 Millions of Years
de CO2 Konzentration und Temperatur vor 600 Millionen Jahren
![]()
-
Man erkennt, dass die CO2-Konzentration in der Zeit, in der es grössere Mengen Lebewesen gibt (seit ca. 500 Millionen Jahren) meist weit höher war ( bis zu 0,7%) als heute (0,04%).
-
In dieser Zeit gab es 4 globale Kaltzeiten mit bis 10°C Unterschied.
-
In der Zusammenstellung ist erkennbar, dass die CO2-Konzentration nie ursächlich parallel der Temperatur lief!
en CO2-Concentration in the atmosphere in the last 600 Millions of Years
![]()
![]()
![]()

-
Watts up with that? (Antony Watts)
2009-02-15 en Hansen on "death trains" and coal and CO2
-
JunkScience
2005-06-21 en Planetary Temperature and Atmospheric Carbon Dioxide (CO2)
-
Plant fossils of West Virginia
en Climate and the Carboniferous Period
-
Earth's atmosphere today contains about 400 ppm CO2 (0.04%).
Compared to former geologic times, our present atmosphere, like the Late Carboniferous atmosphere, is CO2-impoverished!
In the last 600 million years of Earth's history only the Carboniferous Period and our present age, the Quaternary Period, have witnessed CO2 levels less than 400 ppm.
-
There has historically been much more CO2 in our atmosphere than exists today.
For example, during the Jurassic Period (200 mya), average CO2 concentrations were about 1800 ppm or about 4.7 times higher than today.
The highest concentrations of CO2 during all of the Paleozoic Era occurred during the Cambrian Period, nearly 7000 ppm -- about 18 times higher than today.
-
The Carboniferous Period and the Ordovician Period were the only geological periods during the Paleozoic Era when global temperatures were as low as they are today.
To the consternation of global warming proponents, the Late Ordovician Period was also an Ice Age while at the same time CO2 concentrations then were nearly 12 times higher than today -- 4400 ppm.
-
According to greenhouse theory, Earth should have been exceedingly hot.
Instead, global temperatures were no warmer than today.
Clearly, other factors besides atmospheric carbon influence earth temperatures and global warming.
![]()
![]() Die sich ändernden CO2-Gehalte der
Atmosphäre waren seit 600 Mill. Jahren zumeist sehr viel höher als heute,
was weder der Biosphäre geschadet noch Eiszeiten verhindert hat
Die sich ändernden CO2-Gehalte der
Atmosphäre waren seit 600 Mill. Jahren zumeist sehr viel höher als heute,
was weder der Biosphäre geschadet noch Eiszeiten verhindert hat
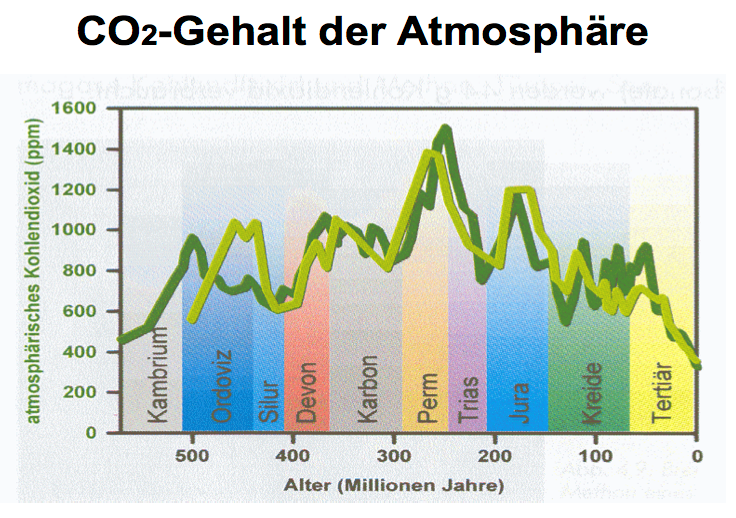
↑ b Entwicklung seit 100'000 Jahren
![]()
![]() Kommentar:
Kommentar:
Offensichtlich besteht kein Zusammenhang zwischen
der mittleren globalen Temperatur mit der Akitvität des
Menschen!
|
1 Materialverbrauch |
2 Globaler Ölkonsum |
| 3 Weltbevölkerung | 4 Kohlendioxid CO2 |
| 5 Globaler Wasserverbrauch | 6 Mittlere globale Temperatur |

↑ c Temperaturverlauf der letzten 20'000 Jahre in Grönland
![]()
![]()

![]()
![]()

Glaubt man den Prognosen des Weltklimarats IPCC, stolpert die Menschheit im Gefolge des globalen Klimawandels unaufhaltsam der grössten Krise ihrer Geschichte entgegen.
-
Basler Zeitung
2014-04-02 de Nichts Neues unter der SonneMehrere Male hat ein dramatischer Klimawandel die Geschichte der Menschheit bereits neu geschrieben.
Nie war der Mensch daran schuld - und immer hat er eine Lösung gefunden.
de Panik-Küche en Panic laboratory fr Marmite alarmiste
IPCC Climat Change 2013/14
en
![]() Videos
WGI,
WGII
Videos
WGI,
WGII
Heute vor rund 12'000 Jahren:
Das Jordantal ist eine Steppenlandschaft. Wild gibt es in Hülle und Fülle. Noch wichtiger für die Jäger und Sammler, die hier leben: die wilden Gräser, die hier überall von selber wachsen. Das Nahrungsangebot ist gut, nirgendwo leben so viele Menschen wir hier. Sie leben scheinbar im Paradies: Sie ernten, ohne zu säen. Bis der Regen ausbleibt...
Eiszeit kam abrupt zurück
Während rund 1000 Jahren, der Epoche der sogenannten Jüngeren Dryas, stiess das Eis noch einmal kräftig vor. Wo zuvor Wälder wuchsen, zogen wieder Rentiere über baumlose Tundra. Der Nordatlantik fror zu. Der regenreiche Westwind blieb aus...
Wie abrupt die Abkühlung wirklich war, ahnte lange niemand. Wenn Geologen über «rasche Änderungen» sprechen, meinen sie Jahrtausende. Doch neue Forschungen zeigen ein anderes Bild: Der Rückfall in die Eiszeit fand innerhalb eines Jahrzehnts statt.
In Europa warm, im Süden Regen
Die letzte schnelle Erwärmung vor rund 11'500 Jahren änderte das Klima fundamental: Die Gletscher schmolzen auf das heutige Niveau, es wurde warm in Europa, und es regnete wieder im Nahen Osten.
Jahrhundertelang war es in Europa wärmer als heute. Im Süden, im Nahen Osten und in Nordafrika, regnete es mehr. Was heute die Sahara ist, war eine Savanne.
Lesen Sie weiter...
-
Basler Zeitung 2014-04-02 de Nichts Neues unter der Sonne
↑
d Das Holozän
en Holocene
fr Holocène
de Das Holozän en The Holocene fr Le holocène
|
|
||||||
|

![]() Die unterschlagene historische COMNISPA-Temperaturkurve
Die unterschlagene historische COMNISPA-Temperaturkurve
![]()
![]() Temperaturentwicklung der letzten 2000 Jahre auf der außertropischen
Nordhemisphäre
Temperaturentwicklung der letzten 2000 Jahre auf der außertropischen
Nordhemisphäre
RWP = Roman Warm Period
DACP = Dark Ages Cold Period
MWP = Medieval Warm Period
LIA = Little Ice Age
CWP = Modern Warm Period
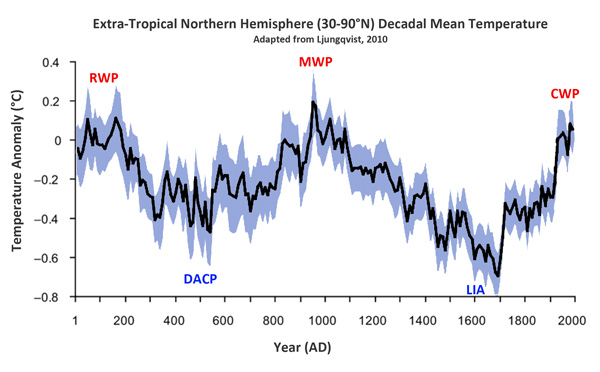
![]()
![]() Wassertemperaturen der vergangenen 2000 Jahre
Wassertemperaturen der vergangenen 2000 Jahre

↑ e Arktischen Meereises in den 1960er Jahren
![]()
![]() Bedeutende Schmelzphase des arktischen Meereises in den 1960er Jahren
Bedeutende Schmelzphase des arktischen Meereises in den 1960er Jahren
Die blaue Kurve gibt die Entwicklung des Meereises vor Neufundland für die vergangenen 150 Jahre wieder.
Ausschlag nach oben markiert Schrumpfen, Ausschlag nach unten Zuwachs.
de
![]() Übersetzung der englischen Passagen
Übersetzung der englischen Passagen

-
Die kalte Sonne
2014-12-21 de Ertappt: Geomar verschweigt in Pressemitteilung bedeutende Schmelzphase des arktischen Meereises in den 1960er JahrenDie wohl bekannteste historische Schmelzphase des arktischen Meereises fand vor 1000 Jahren statt, als die Wikinger munter durch das eisarme Nordmeer schipperten und in diesem Zuge Island und Grönland kolonisierten.
Das mag man heute nicht mehr so gerne hören, da es nicht in die Storyline der Klimakatastrophe passt.
Aber man muss gar nicht so weit zurückgehen. Auch zwischen 1920 und 1940 ereignete sich eine starke Schmelzphase im Nordpolarmeer. Der ehemalige Hamburger Max-Planck-Direktor Lennart Bengtsson fasste 2004 im Journal of Climate das Wissen über die Warmphase zusammen.
-
Journal of Climate - Bengtsson et al
2004 en The Early Twentieth-Century Warming in the Arctic - A Possible Mechanism
-
PNAS - Halfar et al
2013 en Arctic sea-ice decline archived by multicentury annual-resolution record from crustose coralline algal proxy
⇧
3 Sonnenaktivität
en Solar Activity
fr Activité solaire
- a de
400 Jahre Sonnenflecken-Beobachtung
en 400 Years of Sunspot Observations - b de Fakten zum Klimawandel seit der Kleinen Eiszeit
- c de Sonnenstrahlung
- d de Sonnenstrahlung und Temperaturentwicklung
- e de Effektiv an die Erdoberfläche gelangende Solarstrahlung
- f de Magnetfelder der Sonnenflecken
↑
a 400 Jahre Sonnenflecken-Beobachtung
en 400 Years of Sunspot Observations
fr 400 ans d'observation d'éruptions solaire
![]()
de
Sonnenfleck
Sonnenaktivität
400 Jahre Sonnenflecken Beobachtung
en
Sunspot
Solar variation
400 Years of Sunspot Observations
fr
Tache solaire
Cycle solaire
![]()
![]()
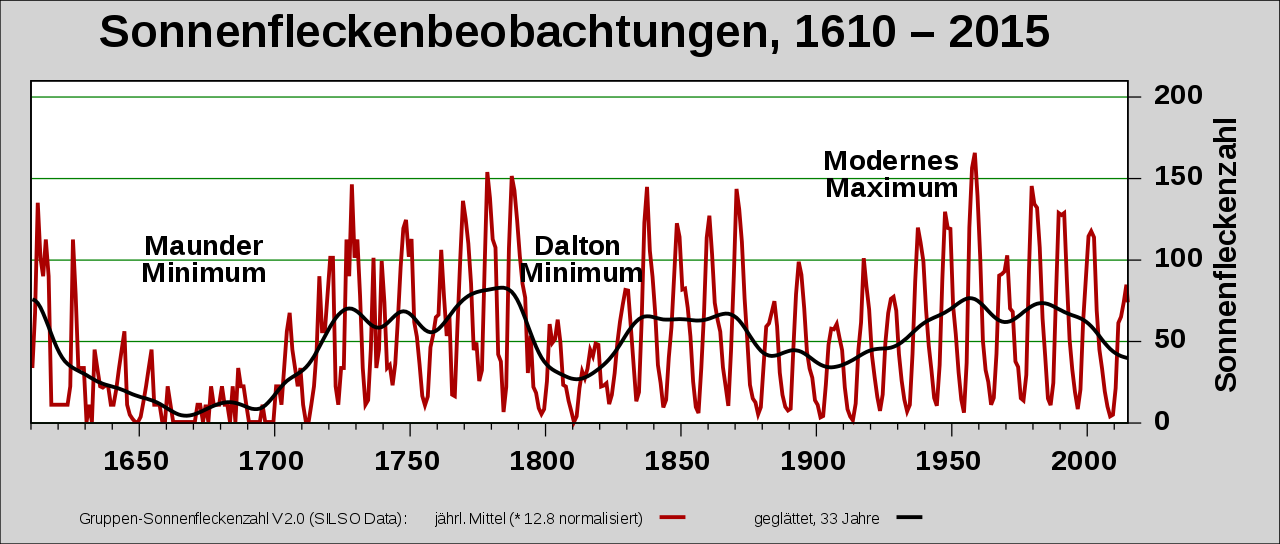
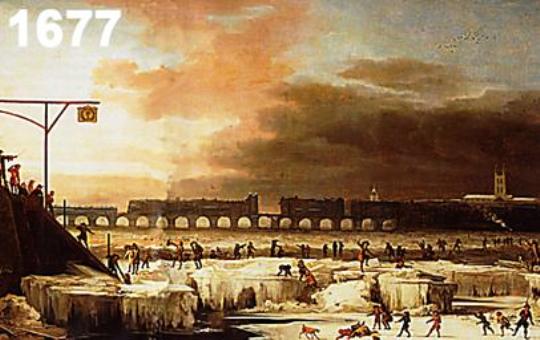
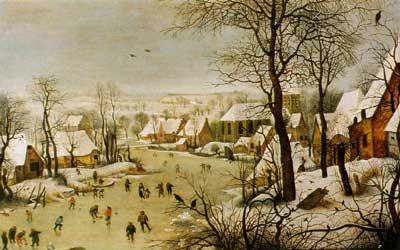
de Sonnenflecken sind dunkle Stellen auf der sichtbaren Sonnenoberfläche, die kühler sind und daher weniger sichtbares Licht abstrahlen als der Rest der Oberfläche.
Ihre Zahl und Größe ist das einfachste Maß für die Sonnenaktivität.
Ursache der Flecken und der in ihrer Nähe auftretenden Ausbrüche sind Magnetfelder.
en Sunspots are temporary phenomena on the photosphere of the Sun that appear visibly as dark spots compared to surrounding regions.
They are caused by intense magnetic activity.
fr Une tache solaire est une région sur la surface du Soleil qui est marquée par une température inférieure à son environnement et à une intense activité magnétique.
Die kleine Eiszeit (Maunder Minimum (1645-1715 AD)
Die kleine Eiszeit (Maunder Minimum (1645-1715 AD) zeigt den Einfluß des solaren Magnetfelds auf die globale Abkühlung.
Während einer 30 jährigen Periode von 1672-1699 AD konnte man weniger 50 Sonnenflecken entdecken während im 20. Jahrhundert im gleichen Zeitraum ca. 40,000-50,000 Sonnenflecken entstanden.
Während der kleinen Eiszeit gab es kaum Sonnenwind, was mehr kosmische Strahlung zur Erde brachte und dies führte zur mehr Wolkenbildung und einer erheblichen Abkühlung der Erdoberfläche.
Diese Zeit war die kälteste der letzten 2,000 Jahre.
↑ b Klimawandel seit der Kleinen Eiszeit
-
Die kalte Sonne (Fritz Vahrenholt & Sebastian Lüning)
Horst Malberg Univ. Prof. (A.D.) für Meteorologie und Klimatologie
2013-05-12 de Klimawandel seit der Kleinen Eiszeit: Die Wirkung der Sonne wurde unterschätztEinleitung
Die über den Klimawandel und seine primäre Ursache aussagekräftigsten Klima-/ Temperaturreihen finden sich in West- und Mitteleuropa.
Dabei reichen die Beobachtungsdaten der Central England Temperatures (CET) bis ins 17. Jahrhundert, die der Mitteleuropareihe (Klimamittel aus Berlin, Basel, Prag, Wien) bis 1701 zurück.
Bei der nachfolgenden Analyse ab 1671 wurden für die drei Dekaden 1671-1700 die Mitteleuropatemperaturen aus den CET-Daten abgeleitet (Reduktionsfaktor -0,5°C).
Zur Berliner Wetterkarte
In den Beiträgen zur Berliner Wetterkarte (BWK) SO 29/09 bzw. SO 37/09 war der Zusammenhang zwischen Sonnenaktivität und Klimawandel in Mittel- bzw. Westeuropa getrennt untersucht worden.
Im ersten Fall konnte dadurch die Auswirkung des integralen solaren Effekts auf einen primär kontinental geprägten, im zweiten auf einen ozeanischen Klimabereich erfasst werden.
In Analogie zur Betrachtung des globalen Klimawandels, d.h. des Mittels aus primär ozeanischer Südhemisphäre und stark kontinental geprägter Nordhemisphäre, wird bei der vorliegenden Analyse eine Europa-Temperaturreihe als Mittel aus Central-England-Reihe und Mitteleuropareihe gebildet.
Auf diese Weise wird eine repräsentative empirische Aussage über die integralen (direkten und indirekten) Auswirkungen solarer Aktivitätsänderungen auf den Klimawandel seit der Kleinen Eiszeit möglich.
...
Schlussbetrachtungen
Die durchgeführte Klimaanalyse belegt auf der Grundlage zuverlässiger Beobachtungsdaten mit hoher statistischer Sicherheit den dominierenden Einfluss der Sonne auf den Klimawandel.
Jede langfristige Änderung des solaren Klimaantriebs führte in den vergangenen Jahrhunderten zu einer Veränderung des Klimas in Europa.
Sonnenaktivität und Klimaverhalten weisen unverkennbar eine synchrone, rund 200-jährige Schwingung auf (De-Vries-Zyklus).
Im Gegensatz zum solaren Effekt vermag das CO2 diesen sinusartigen Klimaverlauf seit 1670 nicht zu erklären.
Zwischen 1670 und 1850 lag der CO2-Gehalt der Luft konstant bei 280 ppm, d.h. sein Einfluss auf den Klimawandel war in diesem Zeitraum gleich Null.
Kleine Eiszeit, die nachfolgende Erwärmung im 18. Jahrhundert und der Temperatursturz zu Beginn des 19. Jahrhunderts vollzogen sich bei konstantem CO2-Gehalt allein als Folge natürlicher, primär solar angetriebener Klimaprozesse.
Warum der integrale solare Klimaeffekt nach 1850 nur noch eine unbedeutende Rolle beim Klimawandel spielen soll,
wie es das IPCC und seine Anhänger behaupten, entbehrt jeder Logik und muss nach den obigen Ergebnissen als nicht haltbar angesehen werden.
Jede Stagnation und jeder Rückgang der Temperatur ist ein elementarer Widerspruch zur angeblichen Dominanz des CO2-Effekts, denn nach der Hypothese vom dominierenden anthropogenen CO2-Klimaeffekt dürfte es nur noch Erwärmungen geben.
Die Varianz des Temperaturverhaltens kann daher durch den CO2-Effekt nicht erklärt werden.
Wenn aber Stagnation und Abkühlungen "naturbedingt" sind, sollte die Natur auch heute in der Lage sein, bei Erwärmungen die wesentliche Rolle zu spielen.
Alles andere wäre paradox.
Alle Korrelationen zwischen Sonnenaktivität und Klimawandel
sind nicht nur für die Zeit vor 1850, sondern auch für die Erwärmung im 20. Jahrhundert auf hohem Niveau statistisch signifikant.
Es ist daher nicht nachvollziehbar, wenn von CO2-Anhängern behauptet wird, der integrale solare Effekt betrüge nur 10%, obwohl er 80% der klimarelevanten Temperaturvarianz der Erwärmung (regional wie global) hochsignifikant erklärt.
Der Einwand, Europa spiegele nicht den globalen Klimawandel wider, ist nicht stichhaltig.
Aber selbst, wenn dem so wäre, wenn also die Änderungen der Sonnenaktivität nur in Europa klimabestimmend wären, käme dem solaren Effekt eine grundlegende Bedeutung für die hier lebenden Menschen, die Natur im allgemeinen und die Landwirtschaft im speziellen zu.
Doch ist der Einwand vor allem deswegen nicht stichhaltig, weil die Klimaerwärmung in Europa nach 1850 synchron zum globalen Temperaturanstieg verlaufen ist, d.h. der Klimawandel in Europa ist Teil des globalen/nordhemisphärischen Klimaverhaltens.
So liegt die Korrelation zwischen dekadischem globalen
Temperaturverhalten und dem Temperaturverlauf in Europa über +0,90, d.h. das Klima in Europa ist über die allgemeine atmosphärische und ozeanische Zirkulation in alle wesentlichen Veränderungen des globalen Klimas eingebunden.
Ausblick:
Die Sonne ist derzeit am Beginn einer ruhigen Aktivitätsphase und wird voraussichtlich im aktuellen Zyklus bereits den kritischen Mittelwert von 50 Sonnenflecken erreichen bzw. unterschreiten, also den Grenzwert zwischen einer Wärme- und einer Kälteperiode.
Analog zu den Klimabedingungen zur Zeit des Dalton-Minimums vor 200 Jahren gilt es daher, sich auf eine Klimaabkühlung in den kommenden
Jahrzehnten einzustellen.
Allein die "launige" Sonne wird über das grundsätzliche Ausmaß der zu erwartenden Abkühlung entscheiden und auch darüber, wann es mit der Temperatur allmählich wieder aufwärts geht.
Letzteres ist voraussichtlich im Verlauf der 2. Hälfte des 21. Jahrhunderts zu erwarten, wenn die Sonne wieder in eine aktivere Phase wechselt.
Sowohl der 200-jährige De-Vries-Zyklus als auch der 80-90-jährige Gleißberg-Zyklus der Sonnenaktivität deuten auf die bevorstehende Talfahrt der Sonnenaktivität hin
mit allen Folgen für das globale Klima und die Welternährung.
Zum gleichen Ergebnis kommt auch I. Abdussamatov vom russischen Hauptobservatorium Pulkovo bei St.Petersburg.
Auch nach seinen Ergebnissen wird das solare Minimum - und entsprechend der Höhepunkt der Abkühlung - während der Sonnenfleckenzyklen um 2055 zu erwarten sein.
Das CO2 wird nach den obigen Auswertungen weder Europa noch den Globus vor der kommenden Abkühlung bewahren.
Es kann den Temperaturrückgang höchstens etwas abmildern.
Seit 15 Jahren ist es global nicht mehr wärmer geworden.
Die Globaltemperatur stagniert bzw. weist in jüngster Zeit eine fallende Tendenz auf, und zwar trotz jährlich kräftig weiter steigender CO2-Emissionen.
(Warum wird die Öffentlichkeit von den Medien darüber nicht informiert?).
Für den politisch motivierten "Weltklimarat" (IPCC) und seine Anhänger ist es an der Zeit, das Dogma vom dominierenden CO2-Klimaeffekt aufzugeben
und mit der Ausgrenzung bis Verketzerung der Klima-Querdenker aufzuhören.
Nicht weil man dem mainstream angehört, hat man in der Wissenschaft automatisch die besseren Erkenntnisse.
Globale Erwärmungen von 4°C nebst apokalyptischen Folgen bis 2100 mittels CO2-dominierter Klimamodelle "vorherzusagen", (Weltbank, PIK), sind reine Hypothesen.
Wird der solare Effekt mit all seinen Wechselwirkungen unter- und der CO2-Effekt überschätzt, kann man keine realistischen Klimaaussagen erwarten.
Wie die früheren Klimaanalysen so lässt auch die vorliegende nur einen Schluss zu:
Im Vergleich zum integralen solaren Klimaeffekt mit all seinen komplexen, nicht-linearen Wirkungsmechanismen (Ozean, Wolken, Albedo, Biosphäre, kosmische Strahlung,...) ist der anthropogene Treibhaus-/CO2-Effekt nur von untergeordneter Bedeutung.
Auch der medienwirksame Versuch, singuläre Extremwetterereignisse auf einen anthropogenen Klimaeinfluss zurückzuführen, entbehrt jeden Beweises.
Orkane, tropische Wirbelstürme, Tornados, Dürren, Überschwemmungen hat es, wie die Chroniken belegen, in allen Jahrhunderten infolge außergewöhnlicher synoptischer Konstellationen mal mehr und mal weniger gegeben. Allerdings werden durch das anhaltende Bevölkerungswachstum auf bald 7 Mrd. immer mehr Menschen sowie ihre Güter von den Naturkatastrophen betroffen.
An die Stelle eines überschätzten, ineffektiven Klimaschutzes sollten sich alle Anstrengungen auf einen weltweiten Umweltschutz konzentrieren:
Saubere Luft, sauberes Wasser, unbelastete Böden und ein intaktes Ökosystem zählen zu den Grundrechten des Menschen.
Auch sind wegen der Begrenztheit der fossilen Ressourcen und der Umweltbelastungen durch Verbrennungsprozesse Maßnahmen zur CO2-Reduzierung gut zu begründen.
Der sog. Klimaschutz ist dagegen die ineffektivste aller Maßnahmen.
Ein stabiles Klima hat es in der Klimageschichte nie gegeben, und wird es auch in Zukunft nicht geben.
-
Prof. Horst Malberg
2011-04-06 de
Klimawandel seit der kleinen Eiszeit
Vortrag über den Klimawandel seit der kleinen Eiszeit von Prof. Horst Malberg, ehemals Leiter des Instituts für Meteorologie an der Freien Universität Berlin, auf der Konferenz der Bürgerrechtsbewegung Solidarität in Bad Salzuflen, 20. März 2010.
![]()
![]() Abb. 3 Mittlere Sonnenfleckenzahl je Sonnenfleckenzyklus 1672-1999
Abb. 3 Mittlere Sonnenfleckenzahl je Sonnenfleckenzyklus 1672-1999

![]()
![]() Abb.4 Mitteltemperaturen in Europa 1672-1999
Abb.4 Mitteltemperaturen in Europa 1672-1999

In Abb.3 ist die Änderung der solaren Aktivität für den Zeitraum 1672-1999 wiedergegeben,
in Abb.4 ist die Temperatur-/Klimaentwicklung im gleichen Zeitraum dargestellt.
Unschwer zu erkennen ist zum einen, dass Klimawandel ein permanenter Prozess ist und nicht erst ein Phänomen des Industriezeitalters.
Auch vor 1850 mussten die Menschen mit nachhaltigen Erwärmungen und Abkühlungen leben.
Besonders bemerkenswert ist, dass die Klimaerwärmung von der Kleinen Eiszeit bis zum Ende des 18. Jahrhunderts mit rund 1°C genau so groß war wie die aktuelle seit 1850.
Die natürlichen Klimaprozesse sind somit auch ohne anthropogene "CO2-Hilfe" jederzeit in der Lage, nachhaltige Erwärmungen zu verursachen.
Unverkennbar zeigt der Vergleich der beiden Abbildungen zum anderen das grundsätzlich synchrone Verhalten von solarer Aktivität und Temperatur/Klima.
Der "ruhigen" Sonne zur Zeit des Maunder- sowie des Dalton-Minimums entsprechen die beiden Kälteperioden.
Der "aktiven" Sonne im 18. und 20.Jahrhundert entsprechen die beiden Erwärmungsperioden.
![]()
![]()
-
EIKE Europäisches Institut für Klima und Energie
Prof. Dr. Horst Malberg
2013-02-13 de Abkühlung kommt? Fakten zum Klimawandel seit der Kleinen EiszeitDie UN-Klimakonferenz 2012 in Katar ist Geschichte. Wieder wurde im Vorfeld eine globale Katastrophen-Erwärmung nebst drastischen Folgen verkündet, wurden durch die Medien unkritisch Horrormeldungen verbreitet. Diesen CO2-basierten apokalyptischen Klima-Szenarien sollen die Klimafakten, soll die Klimarealität gegenüber gestellt werden.
Die über den Klimawandel und seine primäre Ursache aussagekräftigsten Klima-/ Temperaturreihen finden sich in West- und Mitteleuropa.
Dabei reichen die Beobachtungsdaten der Central England Temperatures (CET) bis ins 17. Jahrhundert,
die der Mitteleuropareihe (Klimamittel aus Berlin, Basel, Prag, Wien) bis 1701 zurück.
Bei der nachfolgenden Analyse ab 1671 wurden für die drei Dekaden 1671-1700 die Mitteleuropatemperaturen aus den CET-Daten abgeleitet (Reduktionsfaktor -0,5°C).
-
Beiträge zur Berliner Wetterkarte
Herausgegeben vom Verein BERLINER WETTERKARTE e.V.
c/o Institut für Meteorologie der Freien Universität Berlin
Horst Malberg, Univ.Prof. (A.D.) für Meteorologie und Klimatologie
2013-01-08 de
Fakten zum Klimawandel seit der Kleinen Eiszeit
|
|
Fakten zum Klimawandel seit der Kleinen Eiszeit Klima-Beobachtungen: Sonnenaktivität Sonnenaktivität: Schwankungen der Sonnenaktivität steuern das Klima Klimawandel-Wissenschaft: Klima-Zyklen |
↑
c Sonnenstrahlung
en Solar irradiance
fr Raionnement solaire

-
de Einfluss des solaren Magnetfelds auf die globale Abkühlung
Die Wärmestrahlung der Sonne steigt seit ca. 300 Jahren an und stagniert seit 1990.
Die Sonne ist verantwortlich, daß die meisten kosmischen Strahlen von der Erde abgelenkt werden.
Das magnetische Feld der Sonne und die Sonnenfleckenaktivität ist jedoch nicht konstant.
-
en
Global Warming - from the Sun
These new findings demonstrate that the sun alone can account for all the observed warming early in the century.
- fr Le grand responsable du réchauffement actuel (et aussi des réchauffements et des refroidissements passés), c'est tout simplement... le SOLEIL!
![]()
![]()
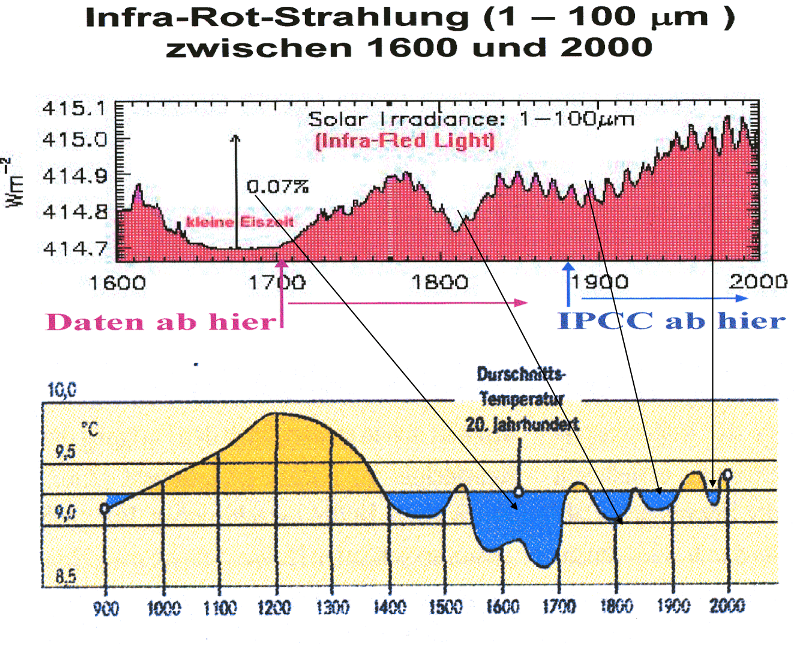
↑
d Sonnenstrahlung und Temperaturentwicklung
en Total Solar Irradiance (TSI) & Temperature Development
fr Raionnement solaire et températures
![]() Professor Fritz Vahrenholt
Professor Fritz Vahrenholt
de
![]() Sonne und Treibhausgase - Ursachen des Klimawandels
Sonne und Treibhausgase - Ursachen des Klimawandels
(
Quelle 1,
Quelle 2)
en
![]() Global Warming: Second Thoughts of an Environmentalist
Global Warming: Second Thoughts of an Environmentalist
A) Total Solar Irradiance (TSI)
B) Temperature Development

Two things are noteworthy:
-
Every time when solar activity was low, there were periods of cold weather.
Whenever the sun was strong (like in the current warm period, the Roman Warm Period and the Medieval Warm Period), there were warm periods.
-
Secondly, there is obviously a 1,000-year cycle with alternating hot and cold periods.
|
Fritz Vahrenholt
Homepage
KlimaNachrichten/Die Kalte Sonne
Wikipedia
|
Professor, Dr., Deutscher Politiker (SPD), Manager, Wissenschaftler
und Buchautor. ►Fritz Vahrenholt: Who is who (Skeptiker) ▶Fritz Vahrenholt: Präsentationen (Bilder & Grafiken) ▶Fritz Vahrenholt: Video-Präsentationen ▶Fritz Vahrenholt: Wikipedia (Opfer von Wikipedia) |
↑
e de
Effektiv an die Erdoberfläche gelangende Solarstrahlung
en
Surface Solar Radiation
![]()
![]() Mittelfristige Variation der mittleren globalen Wolkenbedeckung
nach den Daten des ISCCP im Zeitraum 1983 bis 2010
Mittelfristige Variation der mittleren globalen Wolkenbedeckung
nach den Daten des ISCCP im Zeitraum 1983 bis 2010

![]()
![]() Die ursprüngliche GISS-Temperaturhistorie für die USA, wie sie bis
1999 gültig war; danach wurde sie durch eine neue Kurve ersetzt, die den
Maximalwert auf 1998 verschob.
Die ursprüngliche GISS-Temperaturhistorie für die USA, wie sie bis
1999 gültig war; danach wurde sie durch eine neue Kurve ersetzt, die den
Maximalwert auf 1998 verschob.
![]()
![]() Effektive Solarstrahlung (Insolation) am Erdboden für Stockholm
1922-2010
Effektive Solarstrahlung (Insolation) am Erdboden für Stockholm
1922-2010

![]()
![]() Reale Temperaturmesswerte für 10 Städte auf dem Globus
Reale Temperaturmesswerte für 10 Städte auf dem Globus

-
Die kalte Sonne (Fritz Vahrenholt & Sebastian Lüning)
D. E. Koelle
2013-12-01 de Neuer IPCC-Bericht entdeckt den wichtigsten Klimafaktor ... und ignoriert ihnEntscheidend für das Klima- und die Temperatur-Änderungen ist nicht die Solarstrahlung am Rand der Atmosphäre, sondern das was auf der Erdoberfläche ankommt.
Dazwischen liegt die Atmosphäre mit ihren Wolken und Aerosolen verschiedener Art, die bestimmen, wie viel Solarstrahlung auf die Erdoberfläche gelangt.
Seit 1983 gibt es daher das ISCCP (International Satellite Cloud Climatology Program) zur Bestimmung der mittleren globalen Wolkenbedeckung.
Ein spektakuläres Ergebnis war die Beobachtung eines Rückganges der globalen Wolkenbedeckung im Zeitraum 1987 - 2000 von 69 auf 64 %, d.h. genau in der Periode der Erwärmung, welche die CO2-Hypothese auslöste.
IPCC
Auch wenn der wichtige Klimafaktor SSR erstmals in einem IPCC-Bericht erwähnt wird, bedeutet das nicht, dass er in den weiteren Kapiteln des Berichtes und speziell bei der Temperaturentwicklung berücksichtigt worden wäre - im Gegenteil.
Hier gilt noch ausschließlich die CO2-Hypothese.
Dabei kann der gesamte Temperaturanstieg von 0,8°C in den letzten 100 Jahren, für den ganz oder teilweise der CO2-Anstieg verantwortlich gemacht wurde, nach den neuen Erkenntnissen über den entscheidenden Einfluss der effektiven Solarstrahlung am Boden auch ohne jeden CO2-Einfluss erklärt werden.
-
NoTricksZone (Pierre L. Gosselin)
D. E. Koelle
2013-12-01 en New IPCC report discovers the important climate factor ... and ignores it!Decisive for the climate and temperature changes is not the solar irradiance at the edge of the atmosphere, rather it is the amount of solar energy that makes it to the Earth's surface.
Between the Earth's surface and the outer edge of the atmosphere we have the atmosphere with its clouds and aerosols, which determine how much solar radiation eventually reaches the surface of the Earth.
IPCC
Even if the important SSR factor gets mentioned for the first time in an IPCC report, this does not mean it was taken into account in other chapters of the report, and especially for the temperature development - to the contrary - it was ignored.
Only the CO2 hypothesis is valid.
Here the entire 0.8°C temperature rise of the last 100 years, for which part or all of it gets attributed to CO2, can be explained by the impacts of the effective solar radiation at the Earth's surface without any CO2 effects.
↑
f Magnetfelder der Sonnenflecken
en Magnetic Fields of the Sunspots
fr Champs magnétiques des taches solaires
![]()
![]()

![]()
![]() The frozen Thames, A. Hondius 1677 London Museum
The frozen Thames, A. Hondius 1677 London Museum
If sunspots do go away, it wouldn't be the first time. In the 17th century, the sun plunged into a 70-year period of spotlessness known as the Maunder Minimum that still baffles scientists.
The sunspot drought began in 1645 and lasted until 1715; during that time, some of the best astronomers in history (e.g., Cassini) monitored the sun and failed to count more than a few dozen sunspots per year, compared to the usual thousands.
-
NASA
2009-09-03 de Are Sunspots Disappearing?The sun is in the pits of the deepest solar minimum in nearly a century.
Weeks and sometimes whole months go by without even a single tiny sunspot.
The quiet has dragged out for more than two years, prompting some observers to wonder, are sunspots disappearing?
| de | en | fr |
|---|---|---|
| Die Sonne | The Sun | Le soleil |
| Sonnenflecken | Sunspots | Taches solaires |
⇧
4 Sonnenzyklen
en Solar cycles
fr Cycles solaires
- a 1000 Jahre Eddy Zyklus
- b Weizenpreise und Sonnentätigkeit (William Herschel entdeckte den Zusammenhang)
- c Solare Zyklen in der deutschen und der globalen Temperaturmessreihe
| de | en | fr |
|---|---|---|
|
Die Sonne Sonnenzyklen |
The Sun Sunspot cycles |
Le soleil Cycles solaires |
↑
a 1000 Jahre Eddy Zyklus
en 1000 Year Eddy Cycle
fr Le cycle solaire de 1000 ans Eddy
Neue norwegische Studien
-
Die kalte Sonne (Fritz Vahrenholt Sebastian Lüning)
2012-03-05 de Neue norwegische Studien: Ein erheblicher Teil der Klimaerwärmung der letzten 150 Jahre ist durch die Sonne verursachtIn einer parallelen Studie untersuchte das Trio die Temperaturgeschichte der letzten 4000 Jahre im grönländischen GISS-Eiskern.
Die Forscher fanden hier einen charakteristischen Temperaturzyklus mit einer Periode von etwa 1000 Jahren.
In der Temperaturkurve aus Grönland sind deutlich zu erkennen:
-
Minoische Wärmephase (1000 v. Chr.),
-
Römische Wärmephase (Jahr 0),
-
Mittelalterliche Wärmephase (1000 n. Chr.)
-
und die Moderne Wärmephase (heute).
Dazwischen ereigneten sich jeweils Kaltzeiten, in denen die Temperatur um mehr als 1°C absank.
Die logische Fortschreibung dieses natürlichen Zyklus in die Heutezeit ergibt laut Humlum et al. (2011), dass ein großer Teil der Erwärmung des 20. Jahrhunderts auf natürliche Klimamechanismen (vermutlich vor allem die Sonne) zurückgehen muss.
-
Bestätigung des natürlichen 1000-Jahres-Klimazyklus in aktueller Atlantik-Studie
|
|
de ... Sie fanden, dass die Temperaturen in den vergangenen 10.000 Jahren rhythmisch um einige Grad Celsius im Takte eines deutlich erkennbaren 1000-Jahres-Zyklus schwankten. Der Vergleich mit der Sonnenaktivitätsentwicklung im gleichen Zeitraum ergab eine beeindruckende Synchronität zwischen den beiden Größen. Der solare 1000-Jahres-Zyklus ist ein Grundzyklus der schwankenden Sonnenaktivität und wurde von Abreu et al. (2010) "Eddy-Zyklus" benannt. en Wavelet transform analysis revealed a 1000-year period pacing the d18O signal over the early Holocene. This 1000-year frequency band is significantly coherent with the 1000-year frequency band of Total Solar Irradiance (TSI) between 9.5 ka and 7 ka and both signals are in phase over the rest of the studied period. |
|
de Sicher nicht ganz zufällig gehörten die letzten Jahrzehnte zu den solar aktivsten Zeiten der vergangenen 10.000 Jahre. |
en It is not a mere coincidence that the last decades have been the most solar active of the last 10,000 years. |
|
de Die derzeit vom Weltklimarat verwendeten Klimamodelle können diese Millenniums-Zyklen nicht reproduzieren, da sie der Sonne nur eine sehr geringe Klimawirksamkeit zubilligen.
Auch das kürzlich vom Hamburger Max-Planck-Institut vorgestellte
neue Klimamodell unterliegt dieser Fehleinschätzung, so dass die
Modellierungsergebnisse zwangsläufig unrealistisch werden |
en The climate models used by the IPCC are not able to reproduce these millennial cycles because they assign only a very small climate impact to the sun. Also the recently introduced new climate model from the Max Planck Institute in Hamburg suffers from the same deficiency, and thus the results of that model are essentially unrealistic. |

-
Die kalte Sonne (Fritz Vahrenholt Sebastian Lüning)
2012-03-02 de Bestätigung des natürlichen 1000-Jahres-Klimazyklus in aktueller Atlantik-StudieDie vom Weltklimarat weitgehend ignorierten natürlichen Klimaschwankungen haben sich mit einem lauten Trompetenstoß wieder in Erinnerung gerufen.
Ein Forscherteam aus den USA, Frankreich und den Niederlanden veröffentlichte jetzt in der angesehenen und begutachteten Fachzeitschrift Paleoceanography Ergebnisse zu einem Bohrkern, den sie vor der Küste von Cape Hatteras in North Carolina in einer Wassertiefe von 620 m aus dem Meeresboden zogen.
Der untersuchte geologische Schichtenstapel wurde während der letzten 10.000 Jahre abgelagert.
Anhand von Isotopenstudien an Schalen von Einzellern (sogenannten Foraminiferen) konnten die Wissenschaftler um Caroline Cléroux vom Lamont-Doherty Earth Observatory der Columbia University in Palisades, New York, die Temperaturgeschichte vor Cape Hatteras detailliert rekonstruieren.
Bereits vor etlichen Jahren wies der Heidelberger Geowissenschaftler Augusto Mangini auf die Bedeutung des 1000-Jahreszyklus für die Diskussion des aktuellen Klimawandels hin.
-
Watts Up With That? (Antony Watts)
2012-03-04 en New Study Shows A Clear Millennial Solar Impact Throughout HoloceneDr. Sebastian Lüning writes at the Die kalte Sonne site:
The new findings once again clearly underscore that the last several thousands of years are characterized by natural temperature cycles that are controlled by fluctuations in solar activity (see p. 68-75 in 'Die kalte Sonne').
The logical continuation of these natural cycles through today shows that an important part of the warming of the last 150 years has to be attributed to the increase in solar activity.
Quelle / Source:
-
Paleoceanography
2012-02-09 en High-resolution sea surface reconstructions off Cape Hatteras over the last 10 ka
|
|
↑
b Weizenpreise und Sonnentätigkeit
(William Herschel entdeckte den Zusammenhang)
en 200 years ago: Wheat prices and sunspots
fr William Herschel: Prix des céréales et taches solaires
-
Wikipedia de
Wilhelm Herschel
en William Herschel
fr William Herschel
de
Sonnenaktivität und Weizenpreis
Schon William Herschel entdeckte den Zusammenhang
Vor über zwei Jahrhunderten bemerkte der britische königliche Astronom William Herschel einen Zusammenhang zwischen den Sonnenflecken und dem Weizenpreis in England.
Wenn wenige Flecken beobachtet wurden, stiegen die Preise.
en
Solar Activity and Wheat Prices
William Herschel noted a correlation
More than two centuries ago, the British Astronomer Royal William Herschel noted a correlation between sunspots and the price of wheat in England.
He suggested that when there were few sunspots, prices rose.
-
When the latter were few in number, he noted, the climate turned colder and drier, crop yields fell and wheat prices rose.
-
In the last few years, sunspot activity has dropped to its lowest point for a century.
One of our biggest worries is that our politicians are so fixated on the idea that CO2 is causing global warming that most of them haven't noticed that the problem may be that the world is not warming but cooling, with all the implications that has for whether we get enough to eat.
|
|
↑ c Solare Zyklen in der deutschen und der globalen Temperaturmessreihe
![]()
![]() Temperatur in Deutschland
Temperatur in Deutschland
Nicht der Einfluss des CO₂, sondern der Einfluss der Sonne
-
Die kalte Sonne (Fritz Vahrenholt & Sebastian Lüning)
Steven Michelbach, Geograph
2015-05-29 de Solares Paradoxon Deutschlands, Teil I: Solare Zyklen in der deutschen und der globalen TemperaturmessreiheFür Deutschland als Vorreiter beim Klimaschutz ist es deshalb ausgesprochen paradox,
dass gerade hier in den Temperaturen nicht der Einfluss des CO2, sondern der Einfluss der Sonne auf Klima und Wetter so markant hervortritt.
So hat die Sonne nicht nur die zurückliegende Klimageschichte geschrieben,
sondern sie ist auch für die Gegenwart und die Klimazukunft als wesentliche Kraft verantwortlich.
Die Graphik widerlegt die Aussage des IPCC
Die Aussage des IPCC: "Die Erwärmung des Klimasystems ist eindeutig.
Der größte Teil der beobachteten Zunahme der globalen mittleren Temperaturen seit Mitte des 20. Jahrhunderts ist sehr wahrscheinlich verursacht durch die beobachtete Zunahme anthropogener Treibhausgas-Emissionen."
ist mit der Graphik eindeutig widerlegt.
Es ist demnach sehr unwahrscheinlich, dass das anthropogene CO2 für die Klimaerwärmung der letzten Jahrzehnte verantwortlich ist!
Die Energiewende auf einer CO2-Verunglimpfung aufzubauen und den Einfluss der Sonne weiter zu vernachlässigen, wäre deshalb geradezu paradox.
⇧
5 Ozeanische Oszillationen
en Ocean oscillations
fr Oscillations océaniques
- a de Die Pazifisch Dekadische Oszillation (PDO)
- b en PDO: We Can't Think of Anything Else It Could Be
- c de Sechzig-Jahres-Ozeanzyklus jetzt auch in der Meeresspiegelentwicklung gefunden
- d de Trends der ozeanischen Zyklen und langfristige Veränderungen der Lufttemperaturen in Europa
| de | en | fr |
|---|---|---|
|
Klimawandel: Wissenschaft Ozeanzyklen & Ozeanische Oszillationen |
Climate change: Science Ocean Cycles & Ocean Oscillations |
Changement climatique: Science Cycles et oscillations océaniques |
| Ozeanzyklen steuern das Klima / El Niño (der Knabe/warm) & La Niña (das Mädchen/kalt) / ENSO: El Niño-Southern Oscillation / AMO: Atlantic Multidecadal Oscillation / NAO: North Atlantic Oscillation / AO: Arctic Oscillation / IOD: Indischer Ozean Dipol / PDO: Pacific decada oscillation | ||
↑ a Die Pazifisch Dekadische Oszillation (PDO)
![]()
![]() Die Pazifisch Dekadische Oszillation (PDO) besitzt eine
Zyklendauer von ca. 60 Jahren.
Die Pazifisch Dekadische Oszillation (PDO) besitzt eine
Zyklendauer von ca. 60 Jahren.

Die Pazifisch Dekadische Oszillation erhöht bzw. erniedrigt die Temperatur um jeweils etwa 0,2°C je nach PDO-Phase.
Der Erwärmungsstop im Jahr 2000 fällt mit dem Abstieg der PDO zusammen und stellt eine Wiederholung der Situation aus den 1940er Jahren dar
Aber es gibt ja nicht nur die PDO, sondern eine ganze Flöte von weiteren klimasysteminternen Zyklen.
Nehmen wir zum Beispiel die AMO. Auch sie besitzt einen etwa 60-jährigen Zyklus, der jedoch um 10-20 Jahre zeitverzögert zur PDO abläuft.
Und auch die Nordatlantische Oszillation (NAO) schwingt in diesem Größenmaßstab.
Ist es nicht verwunderlich, dass all diese Zyklen in ähnlichen Zeitmaßstäben schwingen, wenn auch nicht synchron?
-
Die kalte Sonne (Fritz Vahrenholt & Sebastian Lüning)
2012-07-28 de La Ola im Ozean: Die klimazyklische Stadionwelle
![]()
![]() Temperaturzyklen sind dem Langzeittrend überlagert.
Temperaturzyklen sind dem Langzeittrend überlagert.

Die Temperaturprognose aus dem 2007er IPCC-Bericht folgt offensichtlich der durch die Ozeanzyklen übersteilten Flanke, wäre jedoch besser dem Langzeittrend gefolgt.
Der Langzeittrend wird zudem vermutlich in Kürze für eine Weile abknicken, da die Sonnenaktivität als wichtige Einflussgröße in den kommenden Jahrzehnten abnehmen wird.
-
Die kalte Sonne (Fritz Vahrenholt & Sebastian Lüning)
2012-06-19 de Wu et al. 2011: Erwärmung im späten 20. Jahrhundert durch Ozeanzyklen verstärkt
↑ b PDO: We Can't Think of Anything Else It Could Be
PDO = Pacific Decadal Oscillation
![]()
![]()

![]()
![]()

-
Climate Skeptic
2008-09-18 en We Can't Think of Anything Else It Could Be
↑ c Sechzig-Jahres-Ozeanzyklus jetzt auch in der Meeresspiegelentwicklung gefunden en Is There a 60-Year Oscillation in Global Mean Sea Level?
![]()
![]()
de Die Meeresspiegelentwicklung des letzten Jahrhunderts ist durch einen ausgeprägten 60-Jahres-Zyklus geprägt.
Auch das Ende der Erwärmung 1940 und 2000 lag wiederum 60 Jahre auseinander.
en We find that there is a significant oscillation with a period around 60-years in the majority of the tide gauges examined during the 20th Century, and that it appears in every ocean basin.
-
Die kalte Sonne (Fritz Vahrenholt & Sebastian Lüning)
2012-09-20 de Sechzig-Jahres-Ozeanzyklus jetzt auch in der Meeresspiegelentwicklung gefundenWenn man die Temperaturentwicklung der letzten gut hundert Jahre anschaut muss man sich fast ein wenig wie der berühmte Alfred Wegener fühlen:
Deutlich zeichnet sich in den Daten ein Zyklus ab, der etwa 60 Jahre umfasst.
So begannen die beiden jüngsten Erwärmungsepisoden gegen 1915 und 1975, also im Abstand von 60 Jahren.
Aber auch das Ende der Erwärmung 1940 und 2000 lag wiederum 60 Jahre auseinander.
Der Weltklimarat kann sich mit dieser zyklischen Eigendynamik des Klimas so gar nicht anfreunden.
Anstatt den Ozeanzyklus als steuernde Größe anzuerkennen, denkt sich das Gremium allerlei wackelige Hilfskonstruktionen aus, nur um den deutlichen Herzschlag der Natur nicht in die Temperaturprognosen einbauen zu müssen.
Und die Quittung kam prompt: Keines der ehemals so hochgelobten IPCC-Modelle hat den seit nunmehr 14 Jahren andauernden Erwärmungsstop vorhergesagt.
Warum sträubt sich der IPCC so sehr gegen eine sinnhafte Einbeziehung der Ozeanzyklen?
Es spricht viel dafür, dass ein gewichtiger Teil der Erwärmungsepisode von 1977-2000 auf das Konto der aufstrebenden Ozeanzyklen geht.
Denn genau in dieser Zeit stieg auch die Pazifisch Dekadische Oszillation (PDO) stark an und verharrte dann auf einem warmen, hohen Plateau.
Die Mitwirkung der Ozeanzyklen würde damit automatisch die Klimakraft des CO2 schwächen.
Kritik am CO2 hingegen ist beim IPCC unerwünscht und wird mit allen Mitteln unterdrückt.
Aus der Kurzfassung
Wir haben lange Datenreihen von Küstenpegeln in allen Ozeanbecker der Erde untersucht, um zu überprüfen, ob sich in der globalen Meeressiegelentwicklung ein etwa 60-Jahre langer Zyklus wiederfinden lässt, und ob es sich um einen wirklich global wirkenden Zyklus oder nur ein Artefakt in einer kleinen Anzahl von Pegeln handelt.
Wir fanden, dass in der Tat eine bedeutende Oszillation mit einer Periode von etwa 60 Jahren in der überwiegenden Mehrheit der untersuchten Küstenpegel während des 20. Jahrhunderts existiert, und dass diese in jedem Ozean der Erde auftritt.
Mittelt man die Küstenpegel für die einzelnen Ozeanbecken, so zeigt sich, dass sich die Phase und Amplitude der Zyklik im Nordatlantik, westlichen Nordpazifik und Indischen Ozean stark ähneln.
Im westlichen Südpazifik hingegen setzt die Entwicklung um etwa 10 Jahre verzögert ein.
Die einzige untersuchte Region, in der kein deutlicher 60-Jahreszyklus im Meeresspiegel existiert, ist der zentrale und östliche Nordpazifik.
Die in den Küstenpegeldaten identifizierte Phase des 60-Jahres-Zyklus ist so ausgebildet, dass sich der Meeresspiegel im Nordatlantik, westlichen Nordpazifik und Indischen Ozean seit etwa 1985-1990 zusätzlich angehoben hat.
Leider gibt es in Bezug auf die zeitliche als auch räumliche Abdeckung noch nicht genügend Küstenpegeldaten, um den 60-Jahreszyklus in der Meeresspiegelentwicklung zweifelsfrei nachweisen zu können.
Dennoch sollte der Zyklus berücksichtigt werden, wenn es um Betrachtungen zur Beschleunigung des Meeresspiegelanstiegs und die regionale Meeresspiegelentwicklung geht.
Aus dem Diskussionsabschnitt
Bis wir nicht vollständig verstanden haben, ob die Meeresspiegelentwicklung im Zeitraum von mehreren Jahrzehnten durch charakteristische Umbiegepunkte oder einen 60-Jahres-Zyklus geprägt wird und sich dies global auswirkt, sollte man mit Berechnungen eines beschleunigten Meeresspiegelanstiegs sehr vorsichtig sein.
Ausnahmen wären, wenn die verwendeten Datenreihen länger als zwei Zyklenperioden sind oder das Modell die Möglichkeit einer 60-Jahres-Oszillation bereits berücksichtigt.
Diese Einschränkungen gelten insbesondere für die Interpretation eines beschleunigten Meeressiegelanstiegs unter Verwendung von Satellitendaten, die lediglich 20 Jahre zurückreichen sowie für einzelne Pegel mit kurzen Datenreihen.
-
GEOPHYSICAL RESEARCH LETTERS
Don P. Chambers, Mark A. Merrifield, R. Steven Nerem
2012-08-17 en Is There a 60-Year Oscillation in Global Mean Sea Level?We examine long tide gauge records in every ocean basin to examine whether a quasi 60-year oscillation observed in global mean sea level (GMSL) reconstructions reflects a true global oscillation, or an artifact associated with a small number of gauges.
We find that there is a significant oscillation with a period around 60-years in the majority of the tide gauges examined during the 20th Century, and that it appears in every ocean basin.
Averaging of tide gauges over regions shows that the phase and amplitude of the fluctuations are similar in the North Atlantic, western North Pacific, and Indian Oceans, while the signal is shifted by 10 years in the western South Pacific.
The only sampled region with no apparent 60-year fluctuation is the Central/Eastern North Pacific.
The phase of the 60-year oscillation found in the tide gauge records is such that sea level in the North Atlantic, western North Pacific, Indian Ocean, and western South Pacific has been increasing since 1985-1990.
Although the tide gauge data are still too limited, both in time and space, to determine conclusively that there is a 60-year oscillation in GMSL, the possibility should be considered when attempting to interpret the acceleration in the rate of global and regional mean sea level rise.
↑ c Trends der ozeanischen Zyklen und langfristige Veränderungen der Lufttemperaturen in Europa
![]()
![]() Verlauf von AMO/PDO-Index,
Lufttemperaturen in Genf
Verlauf von AMO/PDO-Index,
Lufttemperaturen in Genf

-
Die kalte Sonne (Fritz Vahrenholt & Sebastian Lüning)
Dr. Hans-J. Dammschneider (IFHGK, Schweiz)
2017-01-31 de Trends der ozeanischen Zyklen und langfristige Veränderungen der Lufttemperaturen in Europa
⇧
6 Korrelationen mit der Sonne
en Correlations with the Sun
fr Corrélations avec le soleil
Mit folgenden Links wird von anderen Webseiten auf diese Seite verwiesen:
| de | en | fr |
|---|---|---|
|
Klima: Wandel Klima-Beobachtungen Korrelationen mit der Sonne |
Climate: Change Climate Observations Correlations with the Sun |
Climat: Changement Observations sur le climat Corrélations avec le soleil |
- 1 Sonnenflecken und Temperatur
- 2 Sonnenaktivität und globale Temperatur
- 3 de
Das Klima wird von der Sonne gesteuert !
en The sun is at the origin of climate change !
fr Le soleil est à l'origine du changement climatique ! - 4 de Fakten zum Klimawandel seit der Kleinen Eiszeit
- 5 Korrelation zwischen magnetischer Aktivität der Sonne und kosmischer Strahlung
- 6 Korrelation zwischen Sonnenstrahlung, kosmischen Strahlung und Wolkenbildung
- 7 Kosmische Strahlung und Wolkenbedeckung
- 8 de
Korrelation zwischen den Zyklenlängen der Sonne und der Erdtemperatur
en Correlation between Solar Cycle Length and Earth Temperature
fr Corrélation entre la durée des cycles solaires et la température du globe - 9 en Solar amplification mechanism by which solar activity & cosmic rays control climate
- 10 Korrelation der Sonnenfleckenanzahl mit der Wasseroberflächentemperatur
- 11 Tropical sea-surface temperatures and cosmic-rays
- 12 Südpazifische Oszillation (SO) und Kosmische Strahlung
- 13 Sea level rise and solar cycles
- 14 Sea Level Rise and Solar Activity
- 15 Solare Aktivität und Niederschläge
- 16 Enge Korrelation zwischen Sonnenaktivität und Wassermengen in Flüssen und Seen
- 17 de
Arktische Lufttemperatur verglichen mit der Sonnenstrahlung
en Arctic surface air temperature compared with total solar irradiance
fr Température arctique comparé avec la radiation solaire - 18 Übereinstimmung des Eises in der Arktis mit der Länge der Sonnenzyklen
- 19 Zusammenhang zwischen Tageslänge und Sonnenaktivität
- 20 Erkrankungshäufigkeit und Sonnenaktivität
- 21 Atmosphäre des Uranus verändert sich im Takt der Sonne
- 22 Strahlungszyklen lösen zyklische Änderungen der Temperaturen aus
- 23 Über einen Zeitraum von 2000 Jahren lässt sich eine natürliche Zyklik erkennen
- 24 Grönlandisches Eisschild: Temperatur & Sonne; Temperatur & CO2
- 25
Korrelation der Sonne mit Niederschlägen
Vergleich der Februarniederschläge in Deutschland mit der
Sonnenaktivität
Blaue Kurve: Regenmengen des Monats Februar in Deutschland seit 1900.
Rot: Verlauf der Sonnenaktivität
↑
1 Sonnenflecken und Temperatur
en Solar activity and Earth Temperature
fr Activité solaire et température terrestre
![]()
![]() Korrelation Sonnenflecken / Temperatur
Korrelation Sonnenflecken / Temperatur
en
Correlation between — Solar activity and —
Earth Temperature
fr
Corrélation entre — l'activité solaire et
— la température terrestre
Dünne Kurve:
Variation der Intensität der Sonnenfleckentätigkeit
(nach Friis-Christensen und Lassen)
Dicke Kurve: Die an der Erdoberfläche gemessene Lufttemperatur der nördlichen Atmosphäre für die Jahre 1865 bis 1985.

►Landscheidt (2003): New Little Ice Age Instead of Global Warming?
Fig. 4:
Close correlation between surface land air temperature in the Northern Hemisphere (thick curve)
and the changing length of the 11-year sunspot cycle (thin curve),
indicating the varying intensity of the sun's eruptional activity (From Friis-Christensen and Lassen, 1991).
►Landscheidt (1998):
Sonnenaktivität als dominanter Faktor der Klimadynamik
→
Gleissberg-Zyklus der Sonnenaktivität und Klimaschwankungen
Abb. 3:
Enge Korrelation zwischen der an der Erdoberfläche gemessenen Lufttemperatur der nördlichen Hemisphäre (dicke Kurve)
und der Intensität der Sonnenfleckentätigkeit im säkularen Gleissberg-Zyklus (dünne Kurve) nach Friis-Christensen und Lassen.
▶Nigel Calder (1998): Globale Erwärmung? Die Sonne ist schuld!
Unentschieden bei der Sonnenhelligkeit
Abb. 1: Korrelation Sonnenflecken/Temperatur
Die an der Erdoberfläche gemessene Lufttemperatur der nördlichen Atmosphäre für die Jahre 1865 bis 1985 (dicke Kurve) zeigt eine enge Korrelation
mit der Variation der Intensität der Sonnenfleckentätigkeit im säkularen Gleissberg-Zyklus (dünne Kurve) (nach Friis-Christensen und Lassen).
|
|
↑ 2 Sonnenaktivität und globale Temperatur
![]()
![]() Sonnenaktivität und globale Temperaturen
Sonnenaktivität und globale Temperaturen
en
Solar activity and Global Temperatures
fr
Activité solaire et températures globales
Dicke Kurve: Modell der Sonnenaktivität von D. V. Hoyt und K. H. Schatten
Dünne Kurve: Zeitreihen der globalen Temperatur

►Landscheidt (1998):
Sonnenaktivität als dominanter Faktor der Klimadynamik
→
Gleissberg-Zyklus der Sonnenaktivität und Klimaschwankungen
Abb. 5:
Übereinstimmung zwischen dem Modell der Sonnenaktivität von D. V. Hoyt und K. H. Schatten [39] (dicke Kurve)
und Zeitreihen der globalen Temperatur (gestrichelte Kurve),
die für einen starken Einfluss der Sonnenaktivität auf das Klima spricht.
|
|
Sonnenaktivität und globale Temperatur Ursache: →Korrelationen mit der Sonne Beobachtungen: →Korrelationen mit der Sonne Dr Theodor Landscheidt: →Gleissberg-Zyklus der Sonnenaktivität und Klimaschwankungen |
↑
3 Das Klima wird von der Sonne gesteuert
en The sun is at the origin of climate change
fr Le soleil est à l'origine du changement climatique!
|
|
|
↑ 4 Klimawandel seit der Kleinen Eiszeit
-
Die kalte Sonne (Fritz Vahrenholt & Sebastian Lüning)
Horst Malberg Univ. Prof. (A.D.) für Meteorologie und Klimatologie
2013-05-12 de Klimawandel seit der Kleinen Eiszeit: Die Wirkung der Sonne wurde unterschätztEinleitung
Die über den Klimawandel und seine primäre Ursache aussagekräftigsten Klima-/ Temperaturreihen finden sich in West- und Mitteleuropa.
Dabei reichen die Beobachtungsdaten der Central England Temperatures (CET) bis ins 17. Jahrhundert, die der Mitteleuropareihe (Klimamittel aus Berlin, Basel, Prag, Wien) bis 1701 zurück.
Bei der nachfolgenden Analyse ab 1671 wurden für die drei Dekaden 1671-1700 die Mitteleuropatemperaturen aus den CET-Daten abgeleitet (Reduktionsfaktor -0,5°C).
Zur Berliner Wetterkarte
In den Beiträgen zur Berliner Wetterkarte (BWK) SO 29/09 bzw. SO 37/09 war der Zusammenhang zwischen Sonnenaktivität und Klimawandel in Mittel- bzw. Westeuropa getrennt untersucht worden.
Im ersten Fall konnte dadurch die Auswirkung des integralen solaren Effekts auf einen primär kontinental geprägten, im zweiten auf einen ozeanischen Klimabereich erfasst werden.
In Analogie zur Betrachtung des globalen Klimawandels, d.h. des Mittels aus primär ozeanischer Südhemisphäre und stark kontinental geprägter Nordhemisphäre, wird bei der vorliegenden Analyse eine Europa-Temperaturreihe als Mittel aus Central-England-Reihe und Mitteleuropareihe gebildet.
Auf diese Weise wird eine repräsentative empirische Aussage über die integralen (direkten und indirekten) Auswirkungen solarer Aktivitätsänderungen auf den Klimawandel seit der Kleinen Eiszeit möglich.
...
Schlussbetrachtungen
Die durchgeführte Klimaanalyse belegt auf der Grundlage zuverlässiger Beobachtungsdaten mit hoher statistischer Sicherheit den dominierenden Einfluss der Sonne auf den Klimawandel.
Jede langfristige Änderung des solaren Klimaantriebs führte in den vergangenen Jahrhunderten zu einer Veränderung des Klimas in Europa.
Sonnenaktivität und Klimaverhalten weisen unverkennbar eine synchrone, rund 200-jährige Schwingung auf (De-Vries-Zyklus).
Im Gegensatz zum solaren Effekt vermag das CO2 diesen sinusartigen Klimaverlauf seit 1670 nicht zu erklären.
Zwischen 1670 und 1850 lag der CO2-Gehalt der Luft konstant bei 280 ppm, d.h. sein Einfluss auf den Klimawandel war in diesem Zeitraum gleich Null.
Kleine Eiszeit, die nachfolgende Erwärmung im 18. Jahrhundert und der Temperatursturz zu Beginn des 19. Jahrhunderts vollzogen sich bei konstantem CO2-Gehalt allein als Folge natürlicher, primär solar angetriebener Klimaprozesse.
Warum der integrale solare Klimaeffekt nach 1850 nur noch eine unbedeutende Rolle beim Klimawandel spielen soll,
wie es das IPCC und seine Anhänger behaupten, entbehrt jeder Logik und muss nach den obigen Ergebnissen als nicht haltbar angesehen werden.
Jede Stagnation und jeder Rückgang der Temperatur ist ein elementarer Widerspruch zur angeblichen Dominanz des CO2-Effekts, denn nach der Hypothese vom dominierenden anthropogenen CO2-Klimaeffekt dürfte es nur noch Erwärmungen geben.
Die Varianz des Temperaturverhaltens kann daher durch den CO2-Effekt nicht erklärt werden.
Wenn aber Stagnation und Abkühlungen "naturbedingt" sind, sollte die Natur auch heute in der Lage sein, bei Erwärmungen die wesentliche Rolle zu spielen.
Alles andere wäre paradox.
Alle Korrelationen zwischen Sonnenaktivität und Klimawandel
sind nicht nur für die Zeit vor 1850, sondern auch für die Erwärmung im 20. Jahrhundert auf hohem Niveau statistisch signifikant.
Es ist daher nicht nachvollziehbar, wenn von CO2-Anhängern behauptet wird, der integrale solare Effekt betrüge nur 10%, obwohl er 80% der klimarelevanten Temperaturvarianz der Erwärmung (regional wie global) hochsignifikant erklärt.
Der Einwand, Europa spiegele nicht den globalen Klimawandel wider, ist nicht stichhaltig.
Aber selbst, wenn dem so wäre, wenn also die Änderungen der Sonnenaktivität nur in Europa klimabestimmend wären, käme dem solaren Effekt eine grundlegende Bedeutung für die hier lebenden Menschen, die Natur im allgemeinen und die Landwirtschaft im speziellen zu.
Doch ist der Einwand vor allem deswegen nicht stichhaltig, weil die Klimaerwärmung in Europa nach 1850 synchron zum globalen Temperaturanstieg verlaufen ist, d.h. der Klimawandel in Europa ist Teil des globalen/nordhemisphärischen Klimaverhaltens.
So liegt die Korrelation zwischen dekadischem globalen
Temperaturverhalten und dem Temperaturverlauf in Europa über +0,90, d.h. das Klima in Europa ist über die allgemeine atmosphärische und ozeanische Zirkulation in alle wesentlichen Veränderungen des globalen Klimas eingebunden.
Ausblick:
Die Sonne ist derzeit am Beginn einer ruhigen Aktivitätsphase und wird voraussichtlich im aktuellen Zyklus bereits den kritischen Mittelwert von 50 Sonnenflecken erreichen bzw. unterschreiten, also den Grenzwert zwischen einer Wärme- und einer Kälteperiode.
Analog zu den Klimabedingungen zur Zeit des Dalton-Minimums vor 200 Jahren gilt es daher, sich auf eine Klimaabkühlung in den kommenden
Jahrzehnten einzustellen.
Allein die "launige" Sonne wird über das grundsätzliche Ausmaß der zu erwartenden Abkühlung entscheiden und auch darüber, wann es mit der Temperatur allmählich wieder aufwärts geht.
Letzteres ist voraussichtlich im Verlauf der 2. Hälfte des 21. Jahrhunderts zu erwarten, wenn die Sonne wieder in eine aktivere Phase wechselt.
Sowohl der 200-jährige De-Vries-Zyklus als auch der 80-90-jährige Gleißberg-Zyklus der Sonnenaktivität deuten auf die bevorstehende Talfahrt der Sonnenaktivität hin
mit allen Folgen für das globale Klima und die Welternährung.
Zum gleichen Ergebnis kommt auch I. Abdussamatov vom russischen Hauptobservatorium Pulkovo bei St.Petersburg.
Auch nach seinen Ergebnissen wird das solare Minimum - und entsprechend der Höhepunkt der Abkühlung - während der Sonnenfleckenzyklen um 2055 zu erwarten sein.
Das CO2 wird nach den obigen Auswertungen weder Europa noch den Globus vor der kommenden Abkühlung bewahren.
Es kann den Temperaturrückgang höchstens etwas abmildern.
Seit 15 Jahren ist es global nicht mehr wärmer geworden.
Die Globaltemperatur stagniert bzw. weist in jüngster Zeit eine fallende Tendenz auf, und zwar trotz jährlich kräftig weiter steigender CO2-Emissionen.
(Warum wird die Öffentlichkeit von den Medien darüber nicht informiert?).
Für den politisch motivierten "Weltklimarat" (IPCC) und seine Anhänger ist es an der Zeit, das Dogma vom dominierenden CO2-Klimaeffekt aufzugeben
und mit der Ausgrenzung bis Verketzerung der Klima-Querdenker aufzuhören.
Nicht weil man dem mainstream angehört, hat man in der Wissenschaft automatisch die besseren Erkenntnisse.
Globale Erwärmungen von 4°C nebst apokalyptischen Folgen bis 2100 mittels CO2-dominierter Klimamodelle "vorherzusagen", (Weltbank, PIK), sind reine Hypothesen.
Wird der solare Effekt mit all seinen Wechselwirkungen unter- und der CO2-Effekt überschätzt, kann man keine realistischen Klimaaussagen erwarten.
Wie die früheren Klimaanalysen so lässt auch die vorliegende nur einen Schluss zu:
Im Vergleich zum integralen solaren Klimaeffekt mit all seinen komplexen, nicht-linearen Wirkungsmechanismen (Ozean, Wolken, Albedo, Biosphäre, kosmische Strahlung,...) ist der anthropogene Treibhaus-/CO2-Effekt nur von untergeordneter Bedeutung.
Auch der medienwirksame Versuch, singuläre Extremwetterereignisse auf einen anthropogenen Klimaeinfluss zurückzuführen, entbehrt jeden Beweises.
Orkane, tropische Wirbelstürme, Tornados, Dürren, Überschwemmungen hat es, wie die Chroniken belegen, in allen Jahrhunderten infolge außergewöhnlicher synoptischer Konstellationen mal mehr und mal weniger gegeben. Allerdings werden durch das anhaltende Bevölkerungswachstum auf bald 7 Mrd. immer mehr Menschen sowie ihre Güter von den Naturkatastrophen betroffen.
An die Stelle eines überschätzten, ineffektiven Klimaschutzes sollten sich alle Anstrengungen auf einen weltweiten Umweltschutz konzentrieren:
Saubere Luft, sauberes Wasser, unbelastete Böden und ein intaktes Ökosystem zählen zu den Grundrechten des Menschen.
Auch sind wegen der Begrenztheit der fossilen Ressourcen und der Umweltbelastungen durch Verbrennungsprozesse Maßnahmen zur CO2-Reduzierung gut zu begründen.
Der sog. Klimaschutz ist dagegen die ineffektivste aller Maßnahmen.
Ein stabiles Klima hat es in der Klimageschichte nie gegeben, und wird es auch in Zukunft nicht geben.
-
Prof. Horst Malberg
2011-04-06 de
Klimawandel seit der kleinen Eiszeit
Vortrag über den Klimawandel seit der kleinen Eiszeit von Prof. Horst Malberg, ehemals Leiter des Instituts für Meteorologie an der Freien Universität Berlin, auf der Konferenz der Bürgerrechtsbewegung Solidarität in Bad Salzuflen, 20. März 2010.
![]()
![]() Abb. 3 Mittlere Sonnenfleckenzahl je Sonnenfleckenzyklus 1672-1999
Abb. 3 Mittlere Sonnenfleckenzahl je Sonnenfleckenzyklus 1672-1999
![]()
![]() Abb.4 Mitteltemperaturen in Europa 1672-1999
Abb.4 Mitteltemperaturen in Europa 1672-1999
In Abb.3 ist die Änderung der solaren Aktivität für den Zeitraum 1672-1999 wiedergegeben,
in Abb.4 ist die Temperatur-/Klimaentwicklung im gleichen Zeitraum dargestellt.
Unschwer zu erkennen ist zum einen, dass Klimawandel ein permanenter Prozess ist und nicht erst ein Phänomen des Industriezeitalters.
Auch vor 1850 mussten die Menschen mit nachhaltigen Erwärmungen und Abkühlungen leben.
Besonders bemerkenswert ist, dass die Klimaerwärmung von der Kleinen Eiszeit bis zum Ende des 18. Jahrhunderts mit rund 1°C genau so groß war wie die aktuelle seit 1850.
Die natürlichen Klimaprozesse sind somit auch ohne anthropogene "CO2-Hilfe" jederzeit in der Lage, nachhaltige Erwärmungen zu verursachen.
Unverkennbar zeigt der Vergleich der beiden Abbildungen zum anderen das grundsätzlich synchrone Verhalten von solarer Aktivität und Temperatur/Klima.
Der "ruhigen" Sonne zur Zeit des Maunder- sowie des Dalton-Minimums entsprechen die beiden Kälteperioden.
Der "aktiven" Sonne im 18. und 20.Jahrhundert entsprechen die beiden Erwärmungsperioden.
![]()
![]()
-
EIKE Europäisches Institut für Klima und Energie
Prof. Dr. Horst Malberg
2013-02-13 de Abkühlung kommt? Fakten zum Klimawandel seit der Kleinen EiszeitDie UN-Klimakonferenz 2012 in Katar ist Geschichte. Wieder wurde im Vorfeld eine globale Katastrophen-Erwärmung nebst drastischen Folgen verkündet, wurden durch die Medien unkritisch Horrormeldungen verbreitet. Diesen CO2-basierten apokalyptischen Klima-Szenarien sollen die Klimafakten, soll die Klimarealität gegenüber gestellt werden.
Die über den Klimawandel und seine primäre Ursache aussagekräftigsten Klima-/ Temperaturreihen finden sich in West- und Mitteleuropa.
Dabei reichen die Beobachtungsdaten der Central England Temperatures (CET) bis ins 17. Jahrhundert,
die der Mitteleuropareihe (Klimamittel aus Berlin, Basel, Prag, Wien) bis 1701 zurück.
Bei der nachfolgenden Analyse ab 1671 wurden für die drei Dekaden 1671-1700 die Mitteleuropatemperaturen aus den CET-Daten abgeleitet (Reduktionsfaktor -0,5°C).
-
Beiträge zur Berliner Wetterkarte
Herausgegeben vom Verein BERLINER WETTERKARTE e.V.
c/o Institut für Meteorologie der Freien Universität Berlin
Horst Malberg, Univ.Prof. (A.D.) für Meteorologie und Klimatologie
2013-01-08 de
Fakten zum Klimawandel seit der Kleinen Eiszeit
|
|
Fakten zum Klimawandel seit der Kleinen Eiszeit Klima-Beobachtungen: Sonnenaktivität Sonnenaktivität: Schwankungen der Sonnenaktivität steuern das Klima Klimawandel-Wissenschaft: Klima-Zyklen |
↑
5 Korrelation zwischen magnetischer Aktivität der Sonne und
kosmischer Strahlung
en Correlation between solar activity and Cosmic Rays
fr Corrélation entre activité solaire et rayons cosmiques
![]()
![]() Korrelation zwischen
Korrelation zwischen
der magnetischen Aktivität der Sonne
(ap-Index: blau)
und der kosmischen Strahlung (Neutronen invertiert: grün)

-
EIKE Europäisches Institut für Klima und Energie
2012-11-20 de Die falschen Klimathesen des Professors Mojib Latif
Korrelation zwischen der magnetischer Aktivität der Sonne und der kosmischen Strahlung:
Je kleiner die Ativität der Sonne
(dh. je kleiner der ap-Index)
→ je grösser die kosmische Strahlung
(dh. je grösser ist die Anzahl Neutronen, die auf der
Erdoberfläche gemessen werden)
→ und dadurch je grösser ist die von der kosmischen Strahlung erzeugte Wolkenbildung.
Mehr Wolken bedeuten geringere Einstrahlung und sinkende Temperaturen und vice versa.
Die magnetische Aktivität der Sonne
Die magnetische Aktivtät der Sonne wird mit dem ap-Index gemessen.
Kosmische Strahlung:
Die Intensität der kosmischen Strahlung wird mit der Anzahl Neutronen auf der Oberfläche der Erde gemessen.
Je mehr Neutronen gemessen werden umso stärker ist die kosmische Strahlung
Die kosmische Strahlung fördert die Wolkenbildung.
|
|
|
↑
6 Korrelation zwischen Sonnenstrahlung, kosmischen Strahlung
und Wolkenbildung
en Correlation between Solar Irradiation,
Cosmic Rays and formation of Clouds
fr Corrélation entre rayonnement solaire,
rayons cosmiques et formation de nuages
![]()
![]() Korrelation zwischen der Sonnenstrahlung, der kosmischen Strahlung
und der Wolkenbildung
Korrelation zwischen der Sonnenstrahlung, der kosmischen Strahlung
und der Wolkenbildung
red: Cosmic Ray Flux
blue: Solar Flux
black: Cloud Fraction
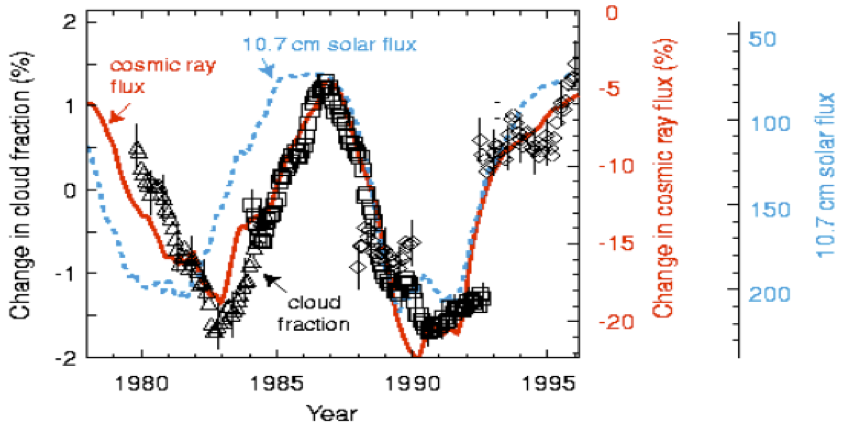
de Die Graphik zeigt zweifelsfrei, dass es eine enge Korrelation zwischen der kosmischen Strahlung und der Wolkenbildung gibt.
Mehr Wolken bedeuten geringere Einstrahlung und sinkende Temperaturen und vice versa.
-
EIKE Europäisches Institut für Klima und Energie
2012-11-20 de Die falschen Klimathesen des Professors Mojib Latif
↑
7 Kosmische Strahlung und Wolkenbedeckung
en Cosmic Rays and Cloud Cover
fr Rayons cosmiques et couverture nuages
![]() de
de
![]() en
en
![]()
The correlation between cosmic ray flux (orange)
as measured in Neutron count monitors
in low magnetic latitudes,
and the low altitude cloud cover (blue) using ISCCP
satellite data set, following Marsh & Svensmark, 2003.

-
Science Skeptical Blog / Rudolf Kipp
2012-12-17 de Wie im kommenden IPCC-Report der Einfluss der Sonne auf das Klima kleingeredet wird2013 ist wieder Weltklimarat-Jahr. Dann erscheint der inzwischen 5. Sachstandsbericht des UN-Gremiums über den Zustand und die Zukunft des globalen Klimas.
Und dieses Mal haben wir das Glück, live an der Entstehung des Berichts teilhaben zu können.
Ermöglicht hat dies der Blogger und bekennende Skeptiker Alec Rawls, indem er die Vorab-Version des Dokuments im Internet öffentlich gemacht hat (wir berichteten).
Um es vorweg zu nehmen, eine wirkliche Sensation scheint der neue Report nicht zu enthalten.
Der Grundtenor ist in etwa der folgende:
Alles ist so schlimm, wie wir schon im letzten Report (2007) gesagt haben.
Manches (etwa der erwartete Anstieg der Meeresspiegel) ist sogar noch ein bisschen schlimmer.
IPCC geht scheinbar auf Kritik ein
Und so wie es aussieht, hat sich das IPCC sogar zaghaft auf manche seiner Kritiker zu bewegt.
Etwa solche die bislang vorgeworfen haben, der Einfluss der Sonne auf das Klima wäre in den bisherigen Reports gar nicht oder nur sehr unzureichend berücksichtigt worden.
Als klimarelevant wurden bisher nur die Veränderungen der Strahlungsintensität (Total Solar Irradiance, TSI) im Laufe der solaren Zyklen angesehen.
Allerdings ist dieser Beitrag äußerst gering.
Obwohl zum Beispiel die Klimaschwankungen der letzten Jahrhunderte mit seiner "kleinen Eiszeit" zeitlich mit den Schwankungen der Sonnenaktivität (gemessen an der Anzahl der Sonnenflecken) zusammenfallen, wäre die damit verbundene Veränderung der Sonneneinstrahlung höchstens ausreichend, um etwas mehr als 10% der beobachteten Temperaturschwankungen zu erklären.
Eine überzeugende Hypothese vom dänische Physiker Henrik Svensmark
Eine überzeugende Hypothese, wie wechselnde Sonnenaktivität auch Klimaschwankungen der beobachteten Größenordnung auslösen kann hat vor einigen Jahren der dänische Physiker Henrik Svensmark vorgelegt
Ausführlich wird seine Theorie in unserem Artikel Zusammenhang zwischen Sonnenaktivität und Wolkenbildung" beschrieben.
Demnach beeinflusst die Stärke des Sonnen-Magnetfelds (die sich mit der Aktivität der Sonne verändert) die Bildung von niedrig hängenden Wolken (unter 3000 Meter).
Kurz gesagt führt eine aktivere Sonne zu weniger niedrigen Wolken und damit zu einer globalen Erwärmung.
Der Zusammenhang zwischen kosmischen Strahlen und der Bedeckung mit niedrigen Wolken ist in der Abbildung links zu sehen
(Quelle: Nir J. Shaviv nach Henrik Svensmark).
Sonne laut IPCC kaum an Klimaschwankungen beteiligt
Auflistung von wissenschaftlichen Arbeiten die den Einfluss der Sonne auf das Klima bestätigen
-
Watts UP With That? (Antony Watts) / Alec Rawls
2012-12-16 en A rebuttal to Steven Sherwood and the solar forcing pundits of the IPCC AR5 draft leak
-
Watts UP With That? (Antony Watts) / Alec Rawls
2012-12-13 en IPCC AR5 draft leaked, contains game-changing admission of enhanced solar forcing - as well as a lack of warming to match model projections, and reversal on 'extreme weather'
-
ScienceBits / Nir J. Shaviv
2006-12-02 en Cosmic Rays and Climate
|
|
↑
8 Korrelation zwischen den Zyklenlängen der Sonne und
der Erdtemperatur
en
Correlation between Solar Cycle Length and Earth Temperature
fr
Corrélation entre la durée des cycles solaires et la
température du globe
|
|
de Sonnenaktivität und Temperartur Man muss blind sein um den Zusammenhang nicht zu sehen! en Solar activity and temperature One must be blind not to see the relation! fr Corrélation entre la durée des cycles solaires et la température du globe A moins d'être aveugle, on voit que cela a bien l'air d'être le cas! |
|
|
|
-
Pensée unique fr Le débat en cours sur le réchauffement climatique sous la loupe ...
Des chercheurs astrophysiciens Danois qui travaillent depuis une dizaine d'années sur ce problème ont eu l'idée originale de tracer sur un même graphique la température moyenne du globe de 1750 à 2000 (courbe blanche ci-contre) et la durée des cycles solaires pendant la même période (en jaune sur le même graphique).
-
Skyfall / Changement climatique
2007-07-10 fr Corrélation à la carte
↑ 9 Solar amplification mechanism by which solar activity & cosmic rays control climate
![]()
![]()

-
Watts UP With That? (Antony Watts)
2017-12-11 en Study: finds a solar amplification mechanism by which solar activity & cosmic rays control climateAs to the false belief that solar activity does not correlate to global temperatures, the sunspot 'integral', the accumulated mean sunspot activity, and Fourier analysis all demonstrate this belief to be false, there is a good correlation.
↑ 10 Korrelation der Sonnenfleckenanzahl mit der Wasseroberflächentemperatur
|
|
Die Erde ist von 71% Wasser bedeckt, das Polareis enthält 80% des Süßwassers der Erde. Deshalb wirkt die Bestrahlung durch die Sonne primär auf die Wasser und Eismassen der Erde, die das Wärmegeschehen hauptsächlich bestimmen. Die Abbildung zeigt klar die Korrelation der Sonnenfleckenanzahl mit der Wasseroberflächentemperatur. ( Quelle) |

- Wasserplanet de Der hydrologische Zyklus
↑ 11 Tropical sea-surface temperatures and cosmic-rays
|
|
en The red curve shows changes in tropical sea-surface temperatures over the past 500 million years. In the blue curve, drawn upside down to match, cosmic-rays intensities have varied according to our position relative to the Galaxy's spiral arms. After Shaviv and Veizer. |

-
en
Danish National Space Center
Experimental evidence shows that cosmic rays from exploding stars can help to make clouds in the atmosphere.
Getting closer to the cosmic connection to climate
Frenzied star-making in the Milky Way Galaxy starting about 2400 million years ago had extraordinary effects on life on Earth.
The Milky Way shaped life on Earth
↑ 12 Südpazifische Oszillation (SO) und Kosmische Strahlung
|
|
Südpazifischen Oszillation und kosmischen Strahlung
Eine Gegenüberstellung der um 30 Monate zeitverzögerten gleitenden 3 Jahresmittel der Südpazifischen Oszillation und der durch die Sonnenaktivität modulierten kosmischen Strahlung zeigt in Abb. 4d eine gute Übereinstimmung im periodischen Verlauf von 1980 bis 2008 und weist auf die extraterrestrische Beeinflussung der La Nina - El Nino Perioden hin.
|
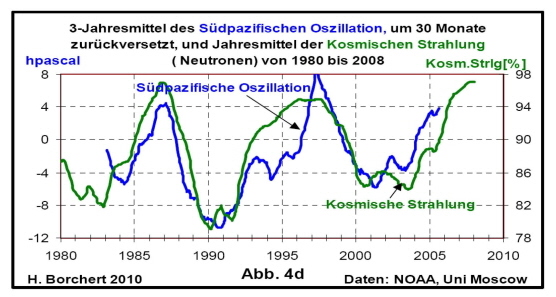
de Kurzfassung
Vergleichbar mit den Untersuchungsergebnissen der Nordatlantischen Oszillation (NAO) wird auch die Südpazifische Oszillation (SO) durch Sonnenaktivität beeinflusst:
Während der Wärmeperiode ab 1980 wird eine Resonanz zwischen den Periodizitäten der Sonnenfleckenhäufigkeit in der 22. und 23. Sonnenfleckenperiode und des Sonnenwindindex "aa" mit der zeitverzögerten Südpazifischen Oszillation beobachtet.
Auch die durch die Magnetfelder der Sonnenwinde ausgelösten Periodizitäten der Kosmischen Strahlung sind in diesem Zeitraum mit der zeitverzögerten Südpazifische Oszillation (SO) in Resonanz (K=0,8).
Das führt zu solar gesteuerter Bewölkungsreduktion durch den Svensmark-Effekt und dadurch zu verstärkter Sonneneinstrahlung.
Es erfolgt so ein zusätzlicher Temperaturanstieg und eine zusätzliche Erwärmung des Ozeans in der südlichen Hemisphäre.
Diese solar bewirkte Meereserwärmung führt zur Emission von gelöstem CO2, was als Zusatzdüngung der Weltflora dient.
Eine Temperaturerhöhung durch CO2 lässt sich aus den Messwerten nicht ableiten.
Mit Beendigung der Sonnenaktivität im Dezember 2006 hat auch in der südlichen Hemisphäre eine kalte Wetterperiode begonnen.
en Abstract
It was found that the South Pacific Oscillation (SO) is influenced by Sun activity similar to the North Atlantic Oscillation (NAO).
Especially during the warming period from 1980 to 2009 the oscillation of Sunwind - Index "aa" was in good resonance with the delayed South Pacific Oscillation.
The same observation was found between the Oscillation of Cosmic Radiation, which is controlled by the Forbush - Reduction by the magnetic fields of the sun protons of the Sunwind and the delayed SO (K=0,8).
The consequence of this observations is the postulation, that the increase of global temperature in the Southern Hemisphere was caused by sun activity with strong emissions of Proton-rays in Earth's direction during the 22. and 23. Sunspot-Periods reducing Cosmic Rays with the consequence of reduction of cloudiness, increasing global rays and warming up the lower atmosphere (Svensmark - Effect).
As a consequence resolved CO2 was continuously emitted from the slowly warming up Ocean giving a good fertilizer of the flora of the world.
A relevance of CO2 concerning Climate Change could not be found.
With the end of Sun activity in 2006 a cold weather period has started in the Southern Hemisphere too.
| de | en | fr |
|---|---|---|
|
Klimawandel: Wissenschaft Ozeanzyklen & Ozeanische Oszillationen |
Climate change: Science Ocean Cycles & Ocean Oscillations |
Changement climatique: Science Cycles et oscillations océaniques |
| Ozeanzyklen steuern das Klima / El Niño (der Knabe/warm) & La Niña (das Mädchen/kalt) / ENSO: El Niño-Southern Oscillation / AMO: Atlantic Multidecadal Oscillation / NAO: North Atlantic Oscillation / AO: Arctic Oscillation / IOD: Indischer Ozean Dipol / PDO: Pacific decada oscillation | ||
↑ 13 Sea level rise and solar cycles
⇧ 2012
↑ en Quantifying Sea Level Fall
-
Wattts Up With That? (Antony Watts)
2012-02-03 en Quantifying Sea Level Fall
⇧ 2009
↑ en Archibald on sea level rise and solar cycles
-
Wattts Up With That? (Antony Watts)
2009-04-07 en Archibald on sea level rise and solar cycles
Sea Level Rise and Solar Cycles

The saw tooth pattern reminded someone of the solar cycles and he overlaid it.
The correlation is striking.
The reason the Earth came out of the Little Ice Age is because we had a more active Sun, more active than at any time for the previous 8,000 years.
Holgate determined that 70% of the sea level rise of the 20th century was due to thermal expansion of the oceans and the rest due to melting glaciers.
Now that the Sun has become less active, that will work in reverse.
↑ 14 Sea Level Rise and Solar Activity
de Verzeichnis en Contents fr Sommaire
- 2018
- de
Der Levermann Skandal im deutschen Bundestag
"Es gibt keinen Beweis, dass CO2 einen großen Effekt auf das Klima hat".
Seine Folie zeigt die Schwankungen des Meeresspiegels im Einklang mit der Sonnenaktivität. - 2017
- en Closely Coupled: Solar Activity and Sea Level
- en Thus It Begins
- 2012
- de F10.7 Flux, Sea Level and the Holocene
- 2010
- en Sea Level Rise and Solar Activity
de Text en Text fr Texte
⇧ 2018
↑ Der Levermann Skandal im deutschen Bundestag
-
EIKE Europäisches Institut für Klima und Energie
Prof. Dr. Horst-Joachim Lüdecke und Dipl.-Ing. Michael Limburg
2018-12-12 de Der Levermann Skandal im deutschen BundestagVideoausschnitt der Auftritte von Prof. Anders Levermann, PIK und Prof. Nir Shaviv, Racah Institut of Physics Jerusalem, anlässlich des Fachgespräches zur COP 24 am 28.11.18 im Deutschen Bundestag.
"Es gibt keinen Beweis, dass CO2 einen großen Effekt auf das Klima hat".
Seine Folie zeigt die Schwankungen des Meeresspiegels im Einklang mit der Sonnenaktivität.
Nir Shaviv, Professor und Chairman des Racah Instituts für Physik der Hebräischen Universität von Jerusalem

⇧ 2017
↑ en Closely Coupled: Solar Activity and Sea Level
-
Wattts Up With That? (Antony Watts)
David Archibald
2017-07-03 en Closely Coupled: Solar Activity and Sea Level
![]()
![]() Solar Cycles and Sea Level 1909 to 2000
Solar Cycles and Sea Level 1909 to 2000
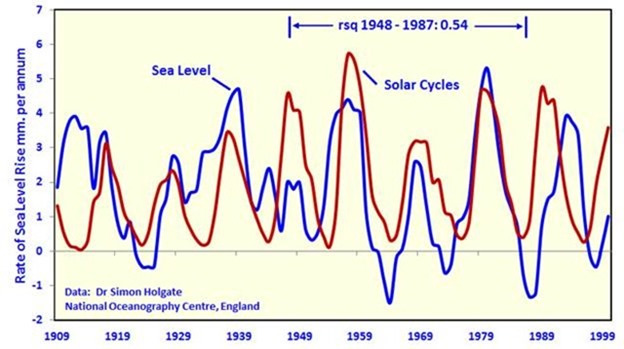
![]()
![]() Sea Level Change and Solar Activity 1948 to 1987
Sea Level Change and Solar Activity 1948 to 1987
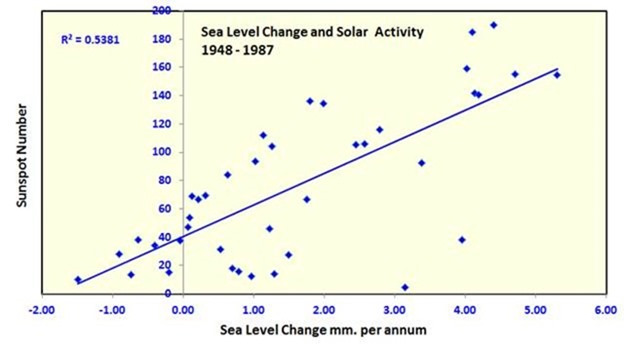
↑ en Thus It Begins
-
Wattts Up With That? (Antony Watts)
David Archibald
2017-07-01 en Thus It BeginsThe F10.7 index
F10.7 flux 2014 - 2017

Relative to the climate of the last century,
an F10.7 flux above 100 causes warming
and below that level causes cooling.
As of today, the F10.7 flux is 71, not far above the activity floor of 64.
Solar minimum is three years away and then we are likely to have at least two years of activity below 100 as activity rises into Solar Cycle 25.
Thus some of the heat that built up in the second half of the 20th century due to the highest solar activity in 8,000 years will have a chance to radiate into space.
Late spring frosts will become more frequent.
NOAA NATIONAL OCEANIC AND ATMOSPHERIC ADMINISTRATION
SPACE WEATHER PREDICTION CENTER
F10.7 CM RADIO EMISSIONS
The solar radio flux at 10.7 cm (2800 MHz) is an excellent indicator of solar activity.
Often called the F10.7 index, it is one of the longest running records of solar activity.
The F10.7 radio emissions originates high in the chromosphere and low in the corona of the solar atmosphere.
The F10.7 correlates well with the sunspot number as well as a number of UltraViolet (UV) and visible solar irradiance records.
The F10.7 has been measured consistently since 1947, first at Ottawa, and then at the Penticton Radio Observatory in British Columbia.
Unlike many solar indices, the F10.7 radio flux can easily be measured reliably on a day-to-day basis from the Earth's surface, in all types of weather.
Reported in "solar flux units", (s.f.u.), the F10.7 can vary from below 50 s.f.u., to above 300 s.f.u., over the course of a solar cycle.
The F10.7 Index has proven very valuable in specifying and forecasting space weather.
Because it is a long record, it provides climatology of solar activity over six solar cycles.
Because it comes from the chromosphere and corona of the sun, it tracks other important emissions that form in the same regions of the solar atmosphere.
The Extreme UltraViolet (EUV) emissions that impact the ionosphere and modify the upper atmosphere track well with the F10.7 index.
Many Ultra-Violet emissions that affect the stratosphere and ozone also correlate with the F10.7 index.
And because this measurement can be made reliably and accurately from the ground in all weather conditions, it is a very robust data set with few gaps or calibration issues.
| de | en | fr |
|---|---|---|
|
Die Sonne Sonnenaktivität |
The Sun Solar Activity |
Le soleil Activité solaire |
⇧ 2012
↑ en F10.7 Flux, Sea Level and the Holocene
-
2012-09-15 en F10.7 Flux, Sea Level and the Holocene
⇧ 2010
↑ en Sea Level Rise and Solar Activity
-
Wattts Up With That? (Antony Watts)
David Archibald
2010-12-01 en Sea Level Rise and Solar Activity
![]()
![]() Sea Level Rise and Solar Activity
Sea Level Rise and Solar Activity

en Successful prediction of levels of solar activity suggests that prediction of other phenomena driven by solar activity might also be successful, and useful.
Sea level rise is a concern of some people.
President Obama said in June 2008 that his nomination in the Democratic primaries was "the moment when the rise of the oceans began to slow".
The graph shows the satellite data from the University of Colorado from late 1992.
A change of trend is evident in 2004.
Prior to that, sea level was rising at 4.2 mm/annum, and after 2004 at 1.5 mm/annum.
2003 was the recent peak in solar activity in terms of flares, F10.7 flux and proton flux.
It is likely that the lower rate of rise post 2004 is due to lower subsequent solar activity.
↑ 15 Solare Aktivität und Niederschläge
| de | en | fr |
|---|---|---|
|
Wetterphänomene Niederschläge |
Weather phenomena Precipitation |
Phénomènes météorologiques Précipitation |
↑
16 Enge Korrelation zwischen Sonnenaktivität und Wassermengen in Flüssen und Seen
en Solar to river flow and lake level correlations
|
|
|
|
de Korrelation zwischen der Sonnenaktivität (gemessen an der Zahl der Sonnenflecken) und der Wassermenge, die der südamerikanische Fluß Parana führt. Der Parana ist der zweitgrößte Fluß Südamerikas. Der gewaltige Itaipu-Damm mit einer installierten Kraftwerksleistung von 14.000 MW staut den Parana. |
en The figure above is after a figure from Maus et al 2010 "Long term solar activity influences on South American rivers". It shows a very good correlation between solar activity, as measured by sunspot number, and the flow rate of the Parana River, the second largest river in South America. The Parana River now hosts the Itaipu Dam with installed capacity of 14,000 MW. |
|
|
Die AGW-Anhänger behaupten, der Einfluß der Sonne auf das Klima sei gering, da sich der Betrag der Sonnenstrahlung nur gering mit dem Sonnenfleckenzyklus ändere. Wenn aber die Sonnenaktivität offenbar die Wassermengen in Flüssen und Seen steuert, ist ein Einfluß auf andere Aspekte des Wettergeschehens mindestens plausibel. |
|
de Der nur sehr zögerlich gestartete und sich schwach entwickelnde Zyklus 24 läßt angesichts des Einflusses auf die Flüsse verschiedene Folgen erwarten:
Wenn diese vorhergesagte Folgen eines schwachen Sonnenfleckenzyklus 24 eintreten, werden die CAGW-Anhänger zweifellos versuchen, sie als Konsequenzen der vermeintlichen globalen Erwärmung zu vermarkten - selbst wenn es bis dahin global kälter werden sollte. |
en Given the link between East African and central South American rainfall and solar activity, the list of economic impacts from the current solar minimum (Solar Cycles 24 and 25) can be expanded to:
This list is by no means exhaustive. The last time the world witnessed mass starvation was the 1965-67 drought in India which killed 1.5 million people. Things don't look pretty. |
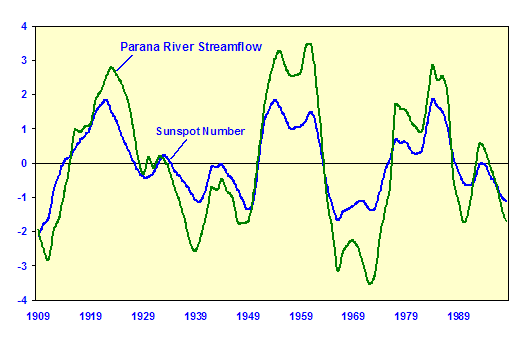
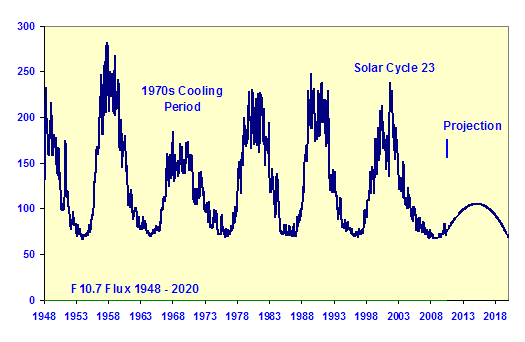
↑
17 Arktische Lufttemperatur verglichen mit der Sonnenstrahlung
en
Arctic surface air temperature compared with total solar irradiance
fr
Température arctique comparé avec la radiation solaire
|
|
de Die Temperatur hängt von der Sonnenaktivität ab. Das CO2 hat praktisch keinen Einfluss. |
|
|
en Atmospheric temperature is regulated by the sun Minor greenhouse gases such as CO2 have little effect The 6-fold increase in hydrocarbon use since 1940 has had no noticeable effect on atmospheric temperature or on the trend in glacier length. |

- Petition Project en Figure 3: Arctic surface air temperature compared with total solar irradiance
↑
18 Bemerkenswerte Übereinstimmung des Eises in der Arktis mit der
Länge der Sonnenzyklen
en Remarkable correlation of Arctic sea ice to solar cycle length
![]()
![]() Solar Cycle Length [SCL] shown by dotted line,
Solar Cycle Length [SCL] shown by dotted line,
Sea ice extent shown by solid line

-
Whats Up With That? (Antony Watts)
2013-07-18 en Remarkable correlation of Arctic sea ice to solar cycle lengthRemarkable correlation of Arctic sea ice observations over the past 500 years to the solar cycle length, which is a measure of solar activity.
A close correlation (R=0.67) of high significance (0.5 % probability of a chance occurrence) is found between the two patterns, suggesting a link from solar activity to the Arctic Ocean climate.
The paper adds to several others demonstrating that Arctic sea ice extent and climate is controlled by natural variations in solar activity, ocean & atmospheric oscillations, winds & storm activity, not man-made CO2.
↑
19 Zusammenhang zwischen Tageslänge und Sonnenaktivität
fr La longueur du jour sous influence des rayons
cosmiques et du soleil
![]()
![]()

-
Klimaskeptiker Info
2010-10-13 de Zusammenhang zwischen Tageslänge und Sonnenaktivität
Nach der Studie haben die von der Sonenaktivität modulierten kosmischen Strahlen Einfluß auf bestimmte Windmuster.
Die sich verändernden Winde beschleunigen und verlangsamen die Erdrotation.
-
CNRS
2010-09-16 fr La longueur du jour sous influence des rayons cosmiques et du soleil
fr L'amplitude de la variation semi-annuelle de la longueur du jour (en bleu) est anti-corrélée au nombre de taches solaires (avec un glissement d'un an) (rouge en haut),
et corrélées au flux de rayons cosmiques galactiques (rouge en bas).
-
Klimaskeptiker Info
2010-10-13 de Zusammenhang zwischen Tageslänge und SonnenaktivitätEine Studie von französisischen und russischen Wissenschaftlern belegt einen Zusammenhang zwischen der Sonnenaktivität und kleinen Schwankungen der Tageslänge der Erde.
Nach der Studie haben die von der Sonenaktivität modulierten kosmischen Strahlen Einfluß auf bestimmte Windmuster.
Die sich verändernden Winde beschleunigen und verlangsamen die Erdrotation.
Dies ist neben einem interessanten wissenschaftlichen Ergebnis auch ein Hinweis darauf, über welchen Mechanismus die Sonne Einfluß auf der Erdklima nimmt.
Die AGW-Vertreter wollen den Sonneneinfluß stets mit dem Hinweis abtun, während ihres Aktivitätszyklus von normalerweise etwa 11 Jahren verändere die Sonne ihre Strahlung nur um so wenig, daß damit eine Erwärmung bzw. Abkühlung der Erde in dem beobachteten Umfang nicht erklärt werden könne.
Aber: Der Einfluß der Sonne funktioniert nicht direkt über die Stärke ihrer Strahlung, sondern durch die vom zyklisch stärker und schwächer werdenden Sonnenwind mehr oder weniger weggefegte kosmische Strahlung.
Die kosmische Strahlung wiederum steuert ganz offenbar starke Winde und - nach einer anderen Hypothese - auch die Wolkenbildung.
Diese Einflüsse wären zusammen weit stärker als der logarithmische (sprich geringe) Einfluß der Infrarot-Absorption durch "Treibhausgase" wie CO2 oder Methan.
-
Techno-Science
2010-09-09 fr La longueur du jour sous influence des rayons cosmiques et du soleilLes jours ne durent pas 24h00... Une équipe franco-russe de géophysiciens et de mathématiciens appliqués conduite par Jean-Louis Le Mouël, physicien à l'Institut de Physique du Globe de Paris (INSU-CNRS, Paris Diderot), vient d'identifier une corrélation forte entre certaines variations de la longueur du jour et l'évolution décennale à multi-décennale de l'activité solaire.
Une étude parue récemment dans la revue Geophysical Research Letters de l'American Geophysical Union.
La longueur du jour (en moyenne 86 400 secondes) n'est pas tout à fait constante et varie de quelques millisecondes ou fractions de millisecondes dans une vaste gamme de périodes allant de quelques mois (et moins) à plusieurs siècles (et plus à l'échelle des temps géologiques).
Comment la vitesse de rotation de la Terre peut-elle donc être sensible à la modulation des rayons cosmiques ?
Une corrélation entre rayon cosmiques et couverture nuageuse a été observée et une théorie proposée par Svensmark et Friis-Christensen dès les années 90.
Une expérience (CLOUD) est en cours au CERN pour en tester la validité: elle devrait très bientôt fournir ses premiers résultats.
C'est ce qui conduit l'équipe à penser que le rôle du Soleil dans les variations climatiques des dernières décennies a pu être notablement sous-évalué.
↑ 20 Erkrankungshäufigkeit und Sonnenaktivität
|
Erkrankungshäufigkeit an Rückfalltyphus in Rußland (dicke Kurve) und Sonnenaktivität. |
|
|
|
Quelle/Source:
|

↑ 21 Atmosphäre des Uranus verändert sich im Takt der Sonne
-
Die kalte Sonne (Fritz Vahrenholt & Sebastian Lüning)
2018-01-15 de Atmosphäre des Uranus verändert sich im Takt der SonneDie Sonne ist unser wichtigster Energielieferant.
Als wir vor einigen Jahren darlegten, dass solare Schwankungen das Erdklima beeinflussen, landeten wir kurzerhand auf der Schwarzen Liste des Umweltbundesamtes.
Und das obwohl eine Vielzahl von wissenschaftlichen Publikationen einen solchen Zusammenhang zwischen Sonne und Klima für die vergangenen Jahrhunderte und Jahrtausende eindrucksvoll belegten.
Man könnte nun auf die Idee kommen, auf anderen Planeten nach einem solaren Effekt in der Planetenatmosphäre zu suchen.
Hört sich irre an, oder?
Wäre es nicht viel einfacher, auf der Erde danach zu forschen? Aus politischen Gründen ist dieser Weg leider verbaut.
Zu unbequem wären die Folgen.
Was auf der Erde verborgen bleiben muss, ist jetzt zum Glück auf dem Uranus als Nachweis geglückt.
Aplin & Harrison veröffentlichten am 18. Dezember 2017 ein spannendes Paper in den Geophysical Research Letters.
Thema: Änderungen der Uranus-Atmosphäre im Takte der Sonnenaktivität:
Der Mechanismus funktioniert offenbarüber die kosmischen Strahlung sowie die UV-Strahlungskomponente, beides vernachlässigte Größen in den irdischen Klimamodellen.
Die Autoren deuten an, dass auch auf dem Neptun ähnliche Effekte registriert werden können.
Ein weiterer wichtiger Schritt, die solaren Verstärkerprozesse besser zu verstehen und am Ende korrekt in die Klimamodelle einzubauen.
Bislang tut man so, als gäbe es lediglich Effekte der solaren Gesamtstrahlung (total solar irradiance), was den empirisch bestens belegten solaren Klimaeffekt jedoch massiv unterschätzt.
-
AGU Geophysical Research Letters
2017-12-18 en Solar-Driven Variation in the Atmosphere of Uranus
| de | en | fr |
|---|---|---|
| Universum, Sonne, Erde | Universe, Sun and Earth | Univers, soleil, monde |
| Die Planeten unserer Sonne | The planets of our sun | Les planètes de notre soleil |
↑ 22 Strahlungszyklen lösen zyklische Änderungen der Temperaturen aus
![]()
![]() Temperatur in Deutschland
Temperatur in Deutschland
Nicht der Einfluss des CO₂, sondern der Einfluss der Sonne
-
Die kalte Sonne (Fritz Vahrenholt & Sebastian Lüning)
Steven Michelbach, Geograph
2015-05-29 de Solares Paradoxon Deutschlands, Teil I: Solare Zyklen in der deutschen und der globalen TemperaturmessreiheFür Deutschland als Vorreiter beim Klimaschutz ist es deshalb ausgesprochen paradox,
dass gerade hier in den Temperaturen nicht der Einfluss des CO2, sondern der Einfluss der Sonne auf Klima und Wetter so markant hervortritt.
So hat die Sonne nicht nur die zurückliegende Klimageschichte geschrieben,
sondern sie ist auch für die Gegenwart und die Klimazukunft als wesentliche Kraft verantwortlich.
Die Graphik widerlegt die Aussage des IPCC
Die Aussage des IPCC: "Die Erwärmung des Klimasystems ist eindeutig.
Der größte Teil der beobachteten Zunahme der globalen mittleren Temperaturen seit Mitte des 20. Jahrhunderts ist sehr wahrscheinlich verursacht durch die beobachtete Zunahme anthropogener Treibhausgas-Emissionen."
ist mit der Graphik eindeutig widerlegt.
Es ist demnach sehr unwahrscheinlich, dass das anthropogene CO2 für die Klimaerwärmung der letzten Jahrzehnte verantwortlich ist!
Die Energiewende auf einer CO2-Verunglimpfung aufzubauen und den Einfluss der Sonne weiter zu vernachlässigen, wäre deshalb geradezu paradox.
↑ 23 Über einen Zeitraum von 2000 Jahren lässt sich eine natürliche Zyklik erkennen
![]() Professor Fritz Vahrenholt
Professor Fritz Vahrenholt
de
![]() Sonne und Treibhausgase - Ursachen des Klimawandels
Sonne und Treibhausgase - Ursachen des Klimawandels
(
Quelle 1,
Quelle 2)
en
![]() Global Warming: Second Thoughts of an Environmentalist
Global Warming: Second Thoughts of an Environmentalist
A) Total Solar Irradiance (TSI)
B) Temperature Development
Two things are noteworthy:
-
Every time when solar activity was low, there were periods of cold weather.
Whenever the sun was strong (like in the current warm period, the Roman Warm Period and the Medieval Warm Period), there were warm periods.
-
Secondly, there is obviously a 1,000-year cycle with alternating hot and cold periods.
↑ 24 Grönlandisches Eisschild: Temperatur & Sonne; Temperatur & CO2
![]()
![]() Grönlandisches Eisschild / Greenland ice sheet
Grönlandisches Eisschild / Greenland ice sheet
1 Temperatur & Sonne / Temperature & Sun
Temperature (left scale)
Summer insolation in watts (right scale)
Average ice sheet temperature
1960-1980

![]()
![]() Temperaturentwicklung
and
CO2
des grönlandischen Eisschildes
Temperaturentwicklung
and
CO2
des grönlandischen Eisschildes
2 Temperatur & CO2 /
Temperature & CO2
Temperature (left scale)
Ice core CO2 data, 9000 BCE - 1515 AD

-
Die kalte Sonne (Fritz Vahrenholt & Sebastian Lüning)
2019-04-30 de Anastasios Tsonis: Wir müssen zunächst die natürliche Klimavariabilität verstehen, bevor wir den anthropogenen Anteil am Klimawandel einschätzen könnenGrönlandisches Eisschild: Temperatur & Sonne / Temperatur & CO2
Die Vergangenheit ist der Schlüssel für die Zukunft.
Wenn wir die vorindustrielle Klimageschichte und ihre natürlichen Antriebe verstehen, können wir auch die Klimazukunft besser prognostizieren.
Willis Eschenbach hat auf WUWT einen Blick auf die Klimageschichte Grönlands während der vergangenen 12.000 Jahre geworfen.
In seinem lesenswerten Kurzbeitrag erinnert er daran, dass die Durchschnittstemperaturen dort im Zeitraum von 8300-800 v. Chr. - also mehr als sieben Jahrtausende lang -
oberhalb der Mitteltemperatur von 1960-1980 lag.
Und selbst wenn wir die modernen Temperaturen aus dem 21. Jahrhundert verwenden, bleibt noch immer eine lange vorindustrielle Periode, während der es in Grönland wärmer war als heute.
Hatten Sie das gewusst?
-
Watts UP With That? (Anthony Watts) / Willis Eschenbach
2019-01-08 en Greenland Is Way Cool1 Temperature & Summer insolation
Figure 1 shows the full length of the data, along with the change in summer insolation at 75°N, the general location of the ice cores used to create the temperature dataset.
The insolation swing shown above is about fifty watts per square metre.
Over the period in question, the temperature dropped about two and a half degrees from the peak in about 5800 BCE.
That would mean the change is on the order of 0.05°C for each watt per square metre change in insolation ...
From about 8300 BCE to 800 BCE,
the average temperature of the ice sheet, not the maximum temperature but the average temperature of the ice sheet, was greater than the 1960-1980 average temperature of the ice sheet.
That's 7,500 years of the Holocene when Greenland's ice sheet was warmer than recent temperatures.
2 Temperature and CO2
Figure 2 shows the same temperature data as in Figure 1, but this time with the EPICA Dome C ice core CO2 data.
Hmmm ... for about 7,000 years,
CO2 is going up ...
and Greenland temperature is going down ...
who knew?
|
|
Grönlandisches Eisschild: Temperatur & Sonne / Temperatur & CO2 Klima-Beobachtungen: Korrelationen mit der Sonne Klima Geschichte: Klima vor 10'000 Jahren - Das Holozän Solarer Einfluss in der Klima-Geschichte: Temperatur und CO2-Konzentration |
↑ 24 Korrelation der Sonne mit Niederschlägen
de Verzeichnis en Contents fr Sommaire
- 2019
- de Denkanstöße: Wie macht die Sonne das?
- de Wie Veränderungen auf der Sonne unseren Regen beeinflussen
de Text en Text fr Texte
⇧ 2019
↑ Denkanstöße: Wie macht die Sonne das?
-
Die kalte Sonne (Fritz Vahrenholt & Sebastian Lüning)
2019-09-04 de Denkanstöße: Wie macht die Sonne das?Schauen Sie sich bitte die Graphik unten etwas genauer an.
Die blaue Kurve zeigt die Regenmengen des Monats Februar in Deutschland seit 1900.
In rot ist der Verlauf der Sonnenaktivität dargestellt.
Können Sie einen Zusammenhang erkennen?
Vergleich der Februarniederschläge in Deutschland mit der
Sonnenaktivität
Blaue Kurve: Regenmengen des Monats Februar in Deutschland seit 1900.
Rot: Verlauf der Sonnenaktivität
↑ Wie Veränderungen auf der Sonne unseren Regen beeinflussen
-
Die kalte Sonne (Fritz Vahrenholt & Sebastian Lüning)
Ludger Laurenz, Horst-Joachim Lüdecke, Sebastian Lüning
2019-02-13 de Wie Veränderungen auf der Sonne unseren Regen beeinflussenEin ausgewogenes Maß an Niederschlägen bildet die Grundlage vielfältiger wirtschaftlicher und gesellschaftlicher Aktivitäten in Europa.
Insbesondere Landwirtschaft, Trinkwasserversorgung und Binnenschifffahrt sind hiervon direkt betroffen.
Allerdings schwanken die Regenmengen stark von Jahr zu Jahr.
Während es in einem Jahr wie aus Kübeln gießt, bleibt im anderen Jahr der Regen oft wochenlang aus.
Die Bevölkerung ist an diese Variabilität gewohnt und weiß in der Regel damit umzugehen.
Aber was steckt hinter den starken Veränderungen?
Gibt es hier irgendeine Systematik oder handelt es sich um pures atmosphärisches Rauschen?
Die Zufallsentdeckung eines Agrarwissenschaftlers aus Münster deutet nun an, dass der Regen in Deutschland und anderen Teilen Europas in gewissen Monaten einem bislang verborgen gebliebenen Muster folgt.
Im Rahmen der Agrarberatung durchforstete Ludger Laurenz die jahrzehntelangen Niederschlagsaufzeichnungen der Wetterstation Münster, wobei ihm besonders im Februar ein ständiges Auf und Ab im 11-Jahresrythmus auffiel.
Nach eingehender Prüfung war klar, dass der Rhythmus eng mit der Aktivität der Sonne korrelierte, dem gut dokumentierten 11-jährigen Sonnenfleckenzyklus.
Laurenz tat sich daraufhin mit zwei Kollegen zusammen, um zu überprüfen, inwieweit das beobachtete Muster aus Münster in anderen Teilen Deutschlands und Europas reproduzierbar ist und ob das Phänomen auch in anderen Monaten existiert.
Horst-Joachim Lüdecke von der Hochschule HTW des Saarlandes besorgte sich daraufhin die gesammelten Niederschlagsdaten Europas seit Beginn des 20. Jahrhunderts.
Der emeritierte Physiker entwickelte einen Rechner-Algorithmus, mithilfe dessen die Ähnlichkeit der Veränderungen im Regen und der Sonnenaktivität bestimmt wurde.
Alle 39 europäischen Länder und alle 12 Monate eines Jahres wurden über insgesamt 115 Jahre anhand mathematischer Korrelationen quantifiziert.
Um mögliche Verzögerungseffekte mit einzuschließen, wurden die Datenreihen von Regen und Sonnenflecken dabei auch systematisch auf Verschiebungen hin überprüft.
Dazu wurden die Zeitreihen wie Kämme zeitlich gegeneinander schrittweise verschoben und die jeweilige Veränderung des Korrelationsmaßes notiert.
Die auf diese Weise erhaltenen mehrdimensionalen Daten wurden vom Geowissenschaftler Sebastian Lüning auf systematische Trends hin ausgewertet und kartographisch visualisiert.
Lüning ist mit dem schweizerischen Institut für Hydrographie, Geoökologie und Klimawissenschaften (IFHGK) assoziiert und hat sich auf die Erforschung solarer Klimaeffekte spezialisiert.
Die auskartierten Ergebnisse zeigen, dass die ursprünglich in Münster entdeckte Verknüpfung von Februar-Niederschlägen und der Sonnenaktivität für weite Teile Mitteleuropas und Nordeuropas Gültigkeit und dort sehr hohe statistische Signifikanz besitzt.
In Richtung Südeuropa schwächt sich die Korrelation hingegen deutlich ab.
Die statistische Untersuchung konnte zudem systematische Phasenverschiebungen über den Kontinent hinweg nachweisen.
In Deutschland und Nachbarländern waren die Februar-Niederschläge jeweils besonders gering, wenn die Sonne vier Jahre zuvor sehr stark war.
Die Verzögerung scheint über die langsame Tiefenzirkulation des Atlantiks zustande zu kommen, wie frühere Arbeiten andeuten.
Auf Basis des statistisch-empirisch ermittelten Zusammenhangs lässt sich nun auch der besonders niederschlagsarme Februar 2018 in Deutschland erklären, der einer besonders hohen Intensitätsspitze der Sonnenaktivität Anfang 2014 folgte.
Ähnliche Zusammenhänge zwischen Regen und Sonnenaktivität ließen sich in abgeschwächter Weise auch in einigen anderen Monaten feststellen, insbesondere im April, Juni und Juli, was einen Großteil der Vegetationsperiode in Mitteleuropa ausmacht.
Es entstand ein komplexes Bild des Zusammenspiels von Sonne und Regen in Europa, welches deutliche Trends über 1000 km hinweg erkennen ließ und von Monat zu Monat teils stark variierte.
Die Studie erhärtet damit das Konzept einer solaren Beteiligung an der europäischen hydroklimatischen Entwicklung, was sich bereits aus einer ganzen Reihe von lokalen Fallstudien anderer Autoren angedeutet hatte.
Der genaue Mechanismus, mit dem das Sonnensignal Einfluss auf die Niederschläge nimmt, ist jedoch noch weitgehend unklar und erfordert weitere Forschungsbemühungen.
Der nun erstmals flächenmäßig über Europa auskartierte solare Niederschlagseffekt eröffnet neue Möglichkeiten für eine verbesserte Mittelfrist-Vorhersage von Niederschlägen.
Insbesondere die Landwirtschaft, aber auch die Abwehr von Extremwetterschäden im Zusammenhang mit Starkregen und Dürren könnten davon profitieren.
Nächster Schritt bei der Verfeinerung der Vorhersagemethodik ist eine genauere Quantifizierung von Effekten durch atlantische Ozeanzyklen, die für das Regengeschehen speziell in Westeuropa ebenfalls eine wichtige Rolle spielen.
⇧
7 Korrelation zwischen kosmischer Strahlung und Wolkenbedeckung
en Correlation between Cosmic Rays and Clouds
fr Corrélation entre rayonnement cosmique et nuages
Mit folgenden Links wird von anderen Webseiten auf diese Seite verwiesen:
▶Korrelation zwischen kosmischer Strahlung und Wolkenbedeckung
↑ H. Svensmark: Kosmische Strahlung und Wolkenbedeckung
![]()
![]() Kosmische Strahlung und Wolkenbedeckung
Kosmische Strahlung und Wolkenbedeckung
en Cosmic Rays and Cloud Cover
fr Rayons cosmiques et Nuages
Dünne Kurve: Stärke der kosmischen Strahlung
Dicke Kurve: Die von Satelliten beobachtete Änderung der Wolkenbedeckung (in Prozent)
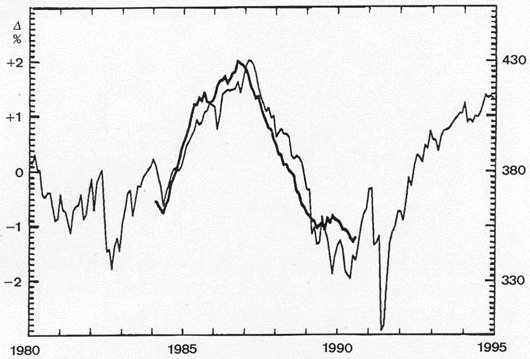
►Landscheidt (1998):
Sonnenaktivität als dominanter Faktor der Klimadynamik
→
Kosmische Strahlung, Sonnenwind und Wolkenausbreitungn
Abb. 6:
Die dünne Kurve entspricht der Stärke der kosmischen Strahlung,
während die dicke Kurve die von Satelliten beobachtete Änderung der Wolkenbedeckung in Prozent abbildet.
Der Gleichlauf der Kurven weist auf einen physikalischen Zusammenhang zwischen Sonnenaktivität, kosmischer Strahlung und irdischem Klima hin. (Nach H. Svensmark und E. Friis-Christensen [111].
Die Wolken haben einen hundertmal stärkeren Einfluss auf Wetter und Klima als das atmosphärische CO2.
Selbst wenn sich der CO2-Gehalt der Atmosphäre verdoppelte, bräuchte sich nach Berechnungen von H. E. Landsberg [53] die Wolkenbedeckung nur um 1% auszudehnen, um den Treibhauseffekt rückgängig zu machen.
Der von Svensmark und Friis-Christensen aufgezeigte Zusammenhang ist deshalb von grosser Bedeutung.
Die dünne Kurve zeigt die Stärke der galaktischen und solaren kosmischen Strahlung an.
Die dicke Kurve gibt die Änderung der globalen Wolkenbedeckung über den Meeren in Prozent wieder.
Sie stützt sich auf besonders homogene Messserien von Satelliten auf geostationärer Umlaufbahn.
Die Korrelation beider Kurven ist eng; der Korrelationskoeffizient erreicht r = 0,95.
|
|
Kosmische Strahlung und Wolkenbedeckung Beobachtungen: →Korrelation zwischen kosmischer Strahlung und Wolkenbedeckung Dr Theodor Landscheidt: →Kosmische Strahlung, Sonnenwind und Wolkenausbreitung |
⇧
8 Korrelation zwischen kosmischer Strahlung und Erdtemperatur
en
Correlation between Cosmic Rays and Earth Temperature
fr
Corrélation entre rayonnement cosmique et
température terrestre
Mit folgenden Links wird von anderen Webseiten auf diese Seite verwiesen:
▶ Korrelation zwischen kosmischer Strahlung und Erdtemperatur
↑
Kosmische Strahlung und Erdtemperatur
en
Cosmaic rays and Earth temperature
fr
Rayonnement cosmique et température terrestre
![]()
![]()
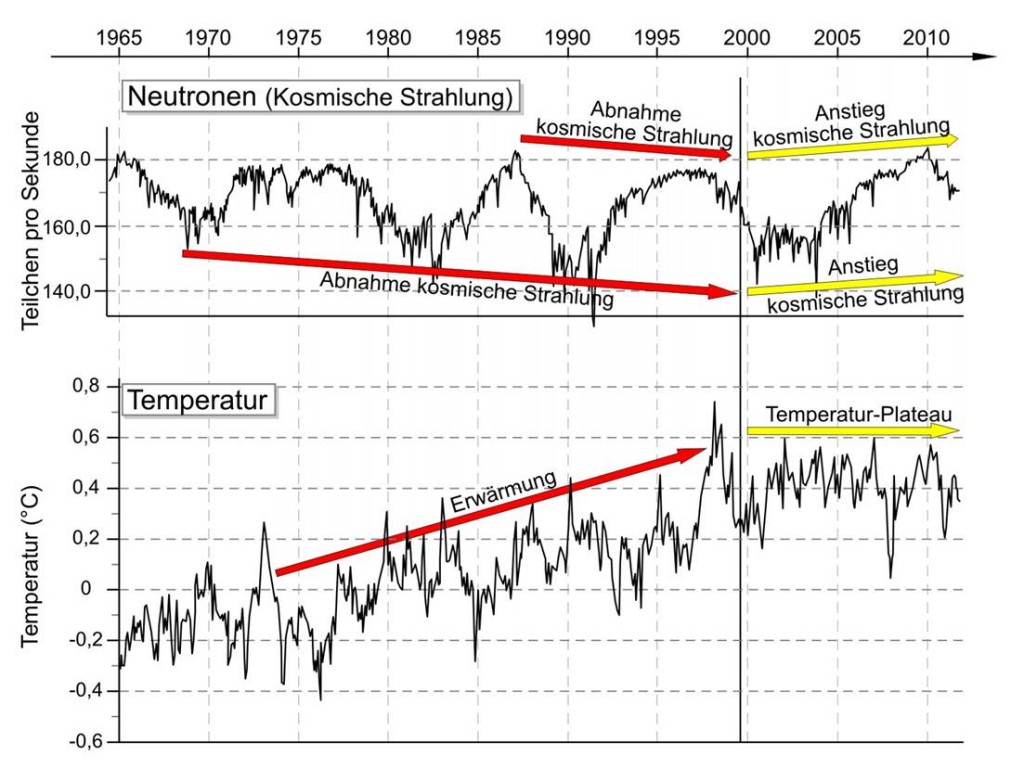
|
1970-2000 (rot) ↑ Zunahme der Sonnenaktivität ↓ Abnahme der kosmischen Strahlung ↓Abnahme der Wolken ↑ Temperaturen steigen |
Seit 2000 (gelb) ↓ Abnahme der Sonnenaktivität ↑ Zunahme der kosmische Strahlung ↑ Zunahme der Wolken ↓ Temperaturen stagnieren |
-
Die kalte Sonne (Fritz Vahrenholt & Sebastian Lüning)
2012-03-25 de Prima gemacht: Trendhinweg-Zauberer Georg Hoffmann1970 bis 2000
Die Abnahme der kosmischen Strahlung von 1970 bis 2000 ist durch die Steigerung der Sonnenaktivität verursacht und fällt genau in Haupterwärmungsepisode.
Seit dem Jahr 2000
Seit dem Jahr 2000 nimmt die kosmische Strahlung wieder zu und die Temperaturen stagnieren
⇧
9 Korrelation zwischen Wolken und Temperatur
en Correlation between Clouds and Temperature
fr Corrélation entre nuages et température
Mit folgenden Links wird von anderen Webseiten auf diese Seite verwiesen:
▶Klima-Beobachtungen: Korrelation zwischen Wolken und Temperatur
de Verzeichnis en Contents fr Sommaire
- 2019
- de
Warum Wolken der Fluch aller Klimaforscher sind
Hamburger Max-Planck-Forscher Stevens: "Unsere Computer sagen nicht einmal mit Sicherheit voraus, ob die Gletscher in den Alpen zu- oder abnehmen werden" - 2018
- de
Die globalen Temperaturen stiegen, als die Wolkenbedeckung
in den 1980er und 1990er Jahren abnahm
de Data: Global Temperatures Rose As Cloud Cover Fell In the 1980s and 90s - 2017
- en Tropical cloud cover 15N - 15S and global air surface temperature 1983 - 2009
- 2012
- de Abkühlung durch tiefere Wolken?
- de Kühlt sich die Erde selbst?
- 2011
- de Neue wissenschaftlich begutachtete Studie: Wolken haben einen großen Abkühlungseffekt auf die Strahlungsbilanz der Erde
|
|
Korrelation zwischen Wolken und Temperatur |
de Text en Text fr Texte
⇧ 2019
↑
Warum Wolken der Fluch aller Klimaforscher sind
Hamburger Max-Planck-Forscher Stevens:
"Unsere Computer sagen nicht einmal mit Sicherheit voraus, ob die
Gletscher in den Alpen zu- oder abnehmen werden"
-
Spiegel (Printausgabe) / Johann Grolle
2019-03-22 de Warum Wolken der Fluch aller Klimaforscher sindVorhersagen zur Erderwärmung sind noch immer erstaunlich ungenau.
Supercomputer und künstliche Intelligenz sollen helfen.
Die Klimasensitivität
Es ist eine schlichte Zahl, doch wird sie das Schicksal dieses Planeten bestimmen.
Sie ist leicht zu beschreiben, doch vertrackt schwierig zu berechnen.
Die Forscher nennen sie: "Klimasensitivität".
Sie gibt an, um wie viel sich die Durchschnittstemperatur auf der Erde erwärmt, wenn sich die Konzentration der Treibhausgase in der Atmosphäre verdoppelt.
Schon in den Siebzigerjahren wurde sie mithilfe primitiver Computermodelle ermittelt.
Die Forscher kamen zu dem Schluss, dass ihr Wert vermutlich irgendwo zwischen 1,5 und 4,5 Grad liegen dürfte.
An diesem Ergebnis hat sich bis heute, rund 40 Jahre später, nichts geändert.
Und genau darin liegt das Problem.
Die Rechenleistung der Computer ist auf das Vielmillionenfache gestiegen, aber die Vorhersage der globalen Erwärmung ist so unpräzise wie eh und je.
"Es ist zutiefst frustrierend", sagt Bjorn Stevens vom Hamburger Max-Planck-Institut für Meteorologie.
Seit mehr als 20 Jahren forscht er nun schon auf dem Feld der Klimamodellierung.
Kommentar und weitere Auszüge:
-
Die kalte Sonne (Fritz Vahrenholt & Sebastian Lüning)
2019-03-30 de Hamburger Max-Planck-Forscher Stevens:
"Unsere Computer sagen nicht einmal mit Sicherheit voraus, ob die Gletscher in den Alpen zu- oder abnehmen werden"Die Klimamodelle stehen weiter in der Kritik.
Sie haben weder die Abbremsung der Erwärmung zu Beginn der Jahrtausendwende kommen sehen,
noch gelingt es ihnen, die Temperaturentwicklung der letzten Jahrtausende zu reproduzieren.
Die Print-Ausgabe des Spiegel brachte am 22. März 2019 einen ausgezeichneten Beitrag über die Probleme der Klimamodelle.
Der Artikel von Johann Grolle ist leider nur für Abonnenten zugänglich, aber er ist es wert, den Gratismonat zu aktivieren bzw. das Heft zu bestellen.
Hier einige Auszüge:
Warum die Vorhersagen zur Erderwärmung so schwierig sind
Vorhersagen zur globalen Erwärmung sind noch immer erstaunlich ungenau. Supercomputer und künstliche Intelligenz sollen helfen.
Zur Klimasensitivität
Schon in den Siebzigerjahren wurde [die Klimasensitivität] mithilfe primitiver Computermodelle ermittelt.
Die Forscher kamen zu dem Schluss, dass ihr Wert vermutlich irgendwo zwischen 1,5 und 4,5 Grad liegen dürfte.
An diesem Ergebnis hat sich bis heute, rund 40 Jahre später, nichts geändert.
Und genau darin liegt das Problem.
Die Rechenleistung der Computer ist auf das Vielmillionenfache gestiegen, aber die Vorhersage der globalen Erwärmung ist so unpräzise wie eh und je.
"Es ist zutiefst frustrierend", sagt Bjorn Stevens vom Hamburger Max-Planck-Institut für Meteorologie.
Stevens hat selbst viel beigetragen zum Fortschritt. Und doch musste er sich immer wieder aufs Neue eingestehen, dass seine Zunft, was die Vorhersage des Klimawandels betrifft, auf der Stelle tritt.
Um sich jedoch konkret auf das Kommende vorzubereiten, taugten die Modelle der Klimaforscher nicht.
Als Entscheidungshilfe beim Bau von Deichen und Entwässerungskanälen seien sie ungeeignet.
"Unsere Computer sagen nicht einmal mit Sicherheit voraus, ob die Gletscher in den Alpen zu- oder abnehmen werden", erklärt Stevens.
Die Schwierigkeiten, denen sich er und seine Forscherkollegen gegenübersehen, lassen sich in ein Wort fassen:
Wolken.
Die träge über den Himmel ziehenden Gebirge aus Wasserdampf
sind der Fluch aller Klimaforscher.
Die Forscher können in ihren Modellen das Wasser nicht verdunsten, aufsteigen und kondensieren lassen, so wie es dies in der Wirklichkeit tut.
Sie müssen sich mit mehr oder weniger plausiblen Faustregeln behelfen.
"Parametrisierung" heißt das Verfahren, doch die Forscher wissen:
In Wirklichkeit ist das der Name einer chronischen Krankheit, von der all ihre Klimamodelle befallen sind.
Oft liefern sie drastisch voneinander abweichende Ergebnisse.
Die Temperaturen in der Arktis zum Beispiel klaffen in den verschiedenen Modellen um teilweise mehr als zehn Grad auseinander.
Das lässt jede Prognose der Eisbedeckung wie bloße Kaffeesatzleserei erscheinen.
Einstweilen allerdings ist nur gewiss, dass die Menschheit noch einige Zeit auf handfestere Klimaprognosen wird warten müssen.
Und selbst wenn sich die Wolken irgendwann den Gleichungen der Forscher fügen,
wird die Welt dann sicher vor Überraschungen sein?
Keiner der beiden Forscher mag da Entwarnung geben.
"Wir betreten unkartiertes Terrain", sagt Schneider.
"Da gibt es keine Gewissheiten."
|
|
⇧ 2018
↑
Die globalen Temperaturen stiegen, als die Wolkenbedeckung
in den 1980er und 1990er Jahren abnahm
en
Data: Global Temperatures Rose As Cloud Cover Fell In the 1980s and 90s
![]()
![]()
de Die Abbildung zeigt die von ISCCP im Durchschnitt gemittelte monatliche Wolkenbedeckung von Juli 1983 bis Dezember 2008, die mit den monatlichen Anomaliedaten von Hadcrut4 blau überlagert ist.
en Figure showing the ISCCP global averaged monthly cloud cover from July 1983 to Dec 2008 over-laid in blue with Hadcrut4 monthly anomaly data.

de Der Rückgang der Wolkenbedeckung fällt mit einem rapiden Temperaturanstieg von 1983-1999 zusammen.
Danach sind sowohl die Temperatur- als auch die Wolkentrends abgeflacht.
Der CO2-Antrieb von 1998 auf 2008 steigt um weitere ~ 0,3 W / m2.
Dies ist ein Beleg dafür, dass Änderungen in den Wolken kein direkter Einfluss auf den CO2-Antrieb haben.
en The fall in cloud cover coincides with a rapid rise in temperatures from 1983-1999.
Thereafter the temperature and cloud trends have both flattened.
The CO2 forcing from 1998 to 2008 increases by a further ~ 0.3 W/m2 which is evidence that changes in clouds are not a direct feedback to CO2 forcing.
-
EIKE Europäisches Institut für Klima und Energie
Anthony Watts / Andreas Demmig
2018-11-06 de Die globalen Temperaturen stiegen, als die Wolkenbedeckung in den 1980er und 1990er Jahren abnahm"Der naheliegendste Weg für eine natürliche Erwärmung besteht in kleinen, natürlichen Schwankungen in den Zirkulationsmustern der Atmosphäre und des Ozeans, die zu einer Abnahme der globalen Bewölkung um 1% oder 2% führen.
Wolken sind der Sonnenschirm der Erde.
Wenn sich die Wolkendecke aus irgendeinem Grund ändert, haben Sie eine globale Erwärmung - oder eine globale Abkühlung."
-
Watts UP With That? (Antony Watts)
2018-11-01 en Data: Global Temperatures Rose As Cloud Cover Fell In the 1980s and 90s"The most obvious way for warming to be caused naturally is for small, natural fluctuations in the circulation patterns of the atmosphere and ocean to result in a 1% or 2% decrease in global cloud cover.
Clouds are the Earth's sunshade, and if cloud cover changes for any reason, you have global warming - or global cooling."
Quelle / Source:
-
notalotofpeopleknowthat / Paul Homewood
2018-10-31 en Global Temperatures Rose As Cloud Cover Fell In the 1980s and 90sClouds have a net average cooling effect on the earth's climate.
Climate models assume that changes in cloud cover are a feedback response to CO2 warming.
Is this assumption valid?
Following a study with Euan Mearns showing a strong correlation in UK temperatures with clouds, we looked at the global effects of clouds by developing a combined cloud and CO2 forcing model to sudy how variations in both cloud cover [8] and CO2 [14] data affect global temperature anomalies between 1983 and 2008.
The model as described below gives a good fit to HADCRUT4 data with a Transient Climate Response (TCR) = 1.6±0.3°C.
The 17-year hiatus in warming can then be explained as resulting from a stabilization in global cloud cover since 1998.
They conclude:
In conclusion, natural cyclic change in global cloud cover has a greater impact on global average temperatures than CO2.
There is little evidence of a direct feedback relationship between clouds and CO2.
Based on satellite measurements of cloud cover (ISCCP), net cloud forcing (CERES) and CO2 levels (KEELING) we developed a model for predicting global temperatures.
This results in a best-fit value for TCR = 1.4 ± 0.3°C.
Summer cloud forcing has a larger effect in the northern hemisphere resulting in a lower TCR = 1.0 ± 0.3°C.
Natural phenomena must influence clouds although the details remain unclear, although the CLOUD experiment has given hints that increased fluxes of cosmic rays may increase cloud seeding [19].
In conclusion, the gradual reduction in net cloud cover explains over 50% of global warming observed during the 80s and 90s, and the hiatus in warming since 1998 coincides with a stabilization of cloud forcing.
⇧ 2017
↑ en Tropical cloud cover 15N - 15S and global air surface temperature 1983 - 2009
-
Watts UP With That? (Antony Watts) / David Archibald
2017-12-31 en Baby It's Cold Outside - evidence of solar cycle affecting Earth's cloud cover
![]()
![]()
Tropical cloud cover 15N - 15S and global air surface temperature 1983 - 2009
The cloud cover data came from the International Satellite Cloud Climatology Project which stopped in 2009 which is a pity because it was showing good support for Svensmark's theory.
Clouds reflect 40 percent of sunlight straight back into space; open ocean absorbs 95 percent so the amount of cloud cover controls global temperature as shown by this graphic:

⇧ 2012
↑ Abkühlung durch tiefere Wolken?
![]()
![]()

Trotz eines starken La Nina Einflusses (Klimaschaukel im äquatorialen Pazifik)bleibt ein Trend zur Abnahme der Wolkenhöhe.
Der Meßzeitraum von 10 Jahren ist noch zu kurz für entgültige Schlußfolgerungen.
Sollte der Trend jedoch anhalten, so ergibt sich daraus womöglich ein abkühlender Effekt,
welcher der globalen Erwärmung - der auslösenden Ursache - tendenziell entgegenwirkt (negatives Feedback), denn je tiefer die Wolken, umso mehr Infrarotstrahlung geben sie von ihrer Oberfläche in Richtung Weltraum ab.
-
Meteo Klima Jens (Christian Heuer)
2012-02-22 de Abkühlung durch tiefere Wolken?Seit dem Jahre 2000 umrundet der US-Satellit Terra die Erde.
Eine seiner Aufgaben ist die Erforschung der Wolken mit dem MISR-Instrument (Multi-angle Imaging SpectroRadiometer).
Das MISR besteht aus 9 Kameras, welche die Wolken der Erde aus verschiedenen Blickwinkeln aufnehmen, so daß räumliche, dreidimensionale Bilder aufgenommen werden können.
Damit lassen sich Höhe, Gestalt und Bewegungsrichtung der Wolken bestimmen.
Eine Auswertung von Wolkenfotos der Jahre 2000-2010 durch die neuseeländischen Klimaforscher Roger Davies und Matthew Malloy an der University of Auckland förderte Überraschendes zu Tage.
Die Wolkenhöhe hat in diesen 10 Jahren weltweit um durchschnittlich 1% abgenommen! Das lag vor allem an einen Rückgang der sehr hohen Eiswolken (Cirren), stellten die Wissenschaftler fest:
Rückgang der hohen Eiswolken - da fällt mir spontan der US-amerikanische Atmosphärenphysiker Prof. Richard Linzen und der von ihm entdeckte Iris-Effekt ein!
Dieser Effekt kommt durch eine Veränderung der Wolken zustande und soll nach Lindzen der globalen Erwärmung durch Kohlendioxid (CO2) und andere vom Menschen in die Atmosphäre entlassene Treibhausgase entgegenwirken:
Infolge der globalen Erwärmung steigen auch die Wassertemperaturen.
Mehr´und mehr Wasser verdunstet und erhöht die Luftfeuchtigkeit.
Da Wasserdampf ein noch stärkeres Treibhausgas ist als CO2, beschleunigt sich die globale Erwärmung durch positive Rückkopplung ganz erheblich (Wasserdampfverstärkung).
Aber eine höhere Luftfeuchtigkeit, so Lindzen, erleichtert auch die Bildung von Regentropfen in den Konvektionszellen der Quellwolken, denn Regentropfen wachsen natürlich umso schneller, je mehr Luftfeuchtigkeit für die Kondensation zur Verfügung steht.
Es entstehen im Verhältnis immer mehr große Regentropfen und immer mehr von ihnen werden zu schwer, um noch von den Aufwinden innerhalb der Konvektionszone der Quellwolken in größere Höhen getragen zu werden, wo sie gefrieren und die hohen Eiswolken (Cirren) bilden können.
Je wärmer es wird, je höher also die Wassertemperaturen, umso weniger hohe Eiswolken (Cirren) bilden sich.
Es überwiegen immer mehr die niedrigeren, hauptsächlich aus Wassertröpfchen bestehenden Quellwolken!
Da Quellwolken abkühlend, Cirren aber erwärmend wirken, ist das gleichbedeutend mit einer negativen Rückkopplung, welche der Erwärmung durch die positive Rückkopplung der Wasserdampfverstärkung entgegenwirkt.
↑ Kühlt sich die Erde selbst?
-
BILD.de
2012-02-23de Kühlt sich die Erde selbst?Eine neue Studie zeigt, dass die durchschnittliche Wolkenhöhe im vergangenen Jahrzehnt um rund 44 Meter abgenommen hat.
Die Erde kühlt sich so selbst ein wenig herunter!
Mit Hilfe des Nasa-Erdbeobachtungssatelliten "Terra" und des Instruments "MISR" (Multi-angle Imaging SpectroRadiometer) konnten Forscher der Universität von Auckland (Neuseeland) die Entwicklung der Wolken über der Erde beobachten.
Ergebnis: Zwischen 2000 und 2010 nahm die Höhe der Wolken-Unterkante um ein Prozent ab.
Tief hängende, dicke Wolken reflektieren die Strahlen der Sonne und kühlen so die Erdoberfläche.
Damit könnten sie unter Umständen den Auswirkungen der globalen Erderwärmung entgegenwirken.
⇧ 2011
↑ Neue wissenschaftlich begutachtete Studie: Wolken haben einen großen Abkühlungseffekt auf die Strahlungsbilanz der Erde
-
EIKE Europäisches Institut fü Klima und Energie Jena
2011-10-18 de Neue wissenschaftlich begutachtete Studie: Wolken haben einen großen Abkühlungseffekt auf die Strahlungsbilanz der ErdeOh weh, jetzt gibt es schon drei wissenschaftlich begutachtete Studien (Lindzen und Choi, Spencer und Braswell und jetzt Richard P. Allan), die auf Beobachtungen eines negativen Feedbacks der Wolken basieren, noch dazu einem starken.
Der Schlüsselabsatz der neuen Studie:
"... es hat sich herausgestellt, dass der strahlungsbedingte Abkühlungseffekt der Wolken infolge Reflektion kurzwelliger Strahlung den langwelligen Erwärmungseffekt überkompensiert, was zu einer Abkühlung des Klimasystems von -21 W/m² führt.
⇧
10 Korrelation mit den Ozeanzyklen
en Correlation with Ocean Cycles
fr Corrélation avec cycles océaniques
Mit folgenden Links wird von anderen Webseiten auf diese Seite verwiesen:
▶Klima-Beobachtungen: Korrelation mit den Ozeanzyklen
- de Ähnlichkeit der Temperaturentwicklung in den USA während der Sommermonate mit dem Verlauf des PDO-Ozeanzyklus
- en
Correlation of Accumulated Cyclone Energy and Atlantic Multidecadal
Oscillations
Mittelfristig lässt sich die Hurrikanaktivität ganz gut vorhersagen, denn sie ist eng an den AMO-Ozeanzyklus gekoppelt, die Atlantische Multidekadenoszillation, die eine Periodizität von 60 Jahren besitzt. - de Trends der ozeanischen Zyklen und langfristige Veränderungen der Lufttemperaturen in Europa
| de | en | fr |
|---|---|---|
|
Klimawandel: Wissenschaft Ozeanzyklen & Ozeanische Oszillationen |
Climate change: Science Ocean Cycles & Ocean Oscillations |
Changement climatique: Science Cycles et oscillations océaniques |
| Ozeanzyklen steuern das Klima / El Niño (der Knabe/warm) & La Niña (das Mädchen/kalt) / ENSO: El Niño-Southern Oscillation / AMO: Atlantic Multidecadal Oscillation / NAO: North Atlantic Oscillation / AO: Arctic Oscillation / IOD: Indischer Ozean Dipol / PDO: Pacific decada oscillation | ||
↑ Ähnlichkeit der Temperaturentwicklung in den USA während der Sommermonate mit dem Verlauf des PDO-Ozeanzyklus
![]()
![]() Temperaturentwicklung in den USA während der Sommermonate.
Temperaturentwicklung in den USA während der Sommermonate.
Die Ähnlichkeit im Verlauf mit dem PDO-Ozeanzyklus ist frappierend
![]()
![]() Verlauf des PDO-Ozeanzyklus
Verlauf des PDO-Ozeanzyklus
-
Die kalte Sonne (Fritz Vahrenholt & Sebastian Lüning)
2018-01-28 de Ach wie gut, dass niemand weiß, dass ich PDO heiß'Die Sommertemperaturen in den USA nahmen einen unerwarteten Verlauf in den letzten 90 Jahren.
In den 1930ern waren die Sommer ziemlich heiß, zum Teil sogar heißer als heute.
Dazwischen sackten die Temperaturen jahrzehntelang ab.
Extrapoliert man den Zyklus in die Zukunft,
kann man schon ahnen, was als nächstes kommt:
Die Sommer in den USA werden wieder kälter werden.
Ein Paper von Alter et al. 2017 kommt zu einem interessanten Schluss:
Die Sommertemperaturen in den USA hatten im letzten Jahrhundert wenig mit dem CO2 zu tun.
↑ en Correlation of Accumulated Cyclone Energy and Atlantic Multidecadal Oscillations
Mittelfristig lässt sich die Hurrikanaktivität ganz gut vorhersagen, denn sie ist eng an den AMO-Ozeanzyklus gekoppelt, die Atlantische Multidekadenoszillation, die eine Periodizität von 60 Jahren besitzt.
Michel de Rougemont erinnerte daran in einem Aufsatz in WUWT.
-
Watts UP With That? (Antony Watts) / Michel de Rougemont
2017-09-04 en Correlation of Accumulated Cyclone Energy and Atlantic Multidecadal OscillationsVarious sources, scientists publishing their opinion in the media, claim that Tropical Storm Harvey, recently landed in Texas, is one more signal of the influence of global warming on such catastrophic events.
These claims are based on model calculations.
Let's examine the facts.
In the Atlantic Ocean, sea surface temperature oscillations are
observed as a multidecadal cycle (AMO).
 The total energy accumulated each year by tropical storms and
hurricanes (ACE) is also showing such a cyclic pattern.
The total energy accumulated each year by tropical storms and
hurricanes (ACE) is also showing such a cyclic pattern.
 A correlation between ACE and AMO is confirmed by regression
analysis.
A correlation between ACE and AMO is confirmed by regression
analysis.

↑ Trends der ozeanischen Zyklen und langfristige Veränderungen der Lufttemperaturen in Europa
![]()
![]() Verlauf von AMO/PDO-Index,
Lufttemperaturen in Genf
Verlauf von AMO/PDO-Index,
Lufttemperaturen in Genf
-
Die kalte Sonne (Fritz Vahrenholt & Sebastian Lüning)
Dr. Hans-J. Dammschneider (IFHGK, Schweiz)
2017-01-31 de Trends der ozeanischen Zyklen und langfristige Veränderungen der Lufttemperaturen in Europa
⇧
11 Korrelationen mit El Niño & La Niña
en Correlation with El Niño & La Niña
fr Corrélation avec El Niño & La Niña
Mit folgenden Links wird von anderen Webseiten auf diese Seite verwiesen:
▶Klima-Beobachtungen: Korrelationen mit El Niño & La Niña
▶El Niño (der Knabe/warm) & La Niña (das Mädchen/kalt)
| de | en | fr |
|---|---|---|
|
Klimawandel: Wissenschaft Ozeanzyklen & Ozeanische Oszillationen |
Climate change: Science Ocean Cycles & Ocean Oscillations |
Changement climatique: Science Cycles et oscillations océaniques |
| Ozeanzyklen steuern das Klima / El Niño (der Knabe/warm) & La Niña (das Mädchen/kalt) / ENSO: El Niño-Southern Oscillation / AMO: Atlantic Multidecadal Oscillation / NAO: North Atlantic Oscillation / AO: Arctic Oscillation / IOD: Indischer Ozean Dipol / PDO: Pacific decada oscillation | ||
↑ El Niño und der Ölpreis
-
Die kalte Sonne (Fritz Vahrenholt & Sebastian Lüning)
2018-08-04 de El Niño und der ÖlpreisEl Niño und der Ölpreis
Die blaue Kurve zeigt El Niño (nach unten) und La Niña
(nach oben),
die orangene Kurve stellt den Rohölpreis dar.
Die Graphik deutet an, dass der Rohölpreis während El-Niño-Phasen zurückgeht.

Zur Wissenschaft gehört es, sich unvoreingenommen erst einmal Entwicklungen anzuschauen, bevor man dann in einem zweiten Schritt überlegt, ob es sich bei bestimmten Mustern um Zufälle oder eine bisher nicht vollständig verstandene Systematik handelt.
Dabei darf der erste Schritte gerne spielerisch ausfallen, denn wer nicht ausprobiert, kann auch nichts finden.
Die Welt der Klimawissenschaften mit ihrer großen Datenfülle und die Börsenwelt haben da sicher einiges gemeinsam. Robert Rethfeld gibt den Börsenbrief "Der Wellenreiter" heraus.
In der Frühausgabe vom 11. Juli 2018 hat er dabei eine interessante Einleitunggewählt, wobei er einfach mal die El-Niño Tätigkeit (ausgedrückt als ONI-Index) und den Rohölpreis zusammen aufgetragen hat:
Der Wellenreiter schreibt:
Die Stärke des Wetterphänomens El Niño und der Ölpreis korrelieren positiv miteinander.
Heizt sich der pazifische Ozean stärker auf als normal (El Niño), hat dies überwiegend einen warmen US-Winter zur Folge.
Ein warmer US-Winter lässt die Nachfrage nach Erdöl sinken, der Preis fällt.
El Niño und sein Gegenpart La Niña sind weitgehend vorhersehbare Phänomene.
Die US-Wetterbehörde NOAA zeigt für das Jahr 2018 eine Entwicklung von La Niña zu El Niño (siehe Pfeil folgender Chart).
Die Wassertemperatur des Pazifiks steigt und bringt den USA aller Voraussicht nach einen warmen Winter 2018/19.
Die Erdölnachfrage müsste dadurch negativ beeinflusst werden, der Preis müsste fallen.
Aktuell sehen wir eine Verzögerung.
Der Ölpreis stieg in den vergangenen Monaten, obwohl der dargestellte Oceanic-Niño-Index (ONI) sich bereits seit Anfang 2018 in Richtung Süden bewegt.
Wir nehmen an, dass der Ölpreis letztendlich dieser Bewegung folgen und fallen wird.
Die positive Korrelation ist in der Tat beachtlich, und auch die Erklärung macht natürlich irgendwie Sinn.
Trotzdem bleibt es spekulatv, weil der Ölpreis letztendlich natürlich von einer Vielzahl von Faktoren abhängt.
Die Prognose des El Nino ist übrigens etwas schwieriger als suggeriert.
Ob jetzt wirklich ein neuer El Niño ins Haus steht?
Die NOAA sieht momentan neutrale ENSO-Bedingungen, hält aber einen El Niño im kommenden Nordhemisphären-Winter mit 70% Wahrscheinlichkeit für möglich.
Prognose vom 30. Juli 2018 als pdf hier.
Oder anders ausgedrückt: Könnte sein, aber nicht ganz sicher.
Warten wir es ab. Siehe auch den Artikel Strong El Niño helps reduce U.S. winter heating demand and fuel prices der US Energy Information Administration von 2016.
-
Wellenreiter Invest
2017-09-22 de La Nina unterstützt den Ölpreis
↑ CO2-Wachstumsrate & El Niño/La Niña
-
Die kalte Sonne (Fritz Vahrenholt & Sebastian Lüning)
2018-08-04 de El Niño und der ÖlpreisCO2-Wachstumsrate & El Niño/La Niña
CO2-Wachstumsrate und
El Niño/La Niña.
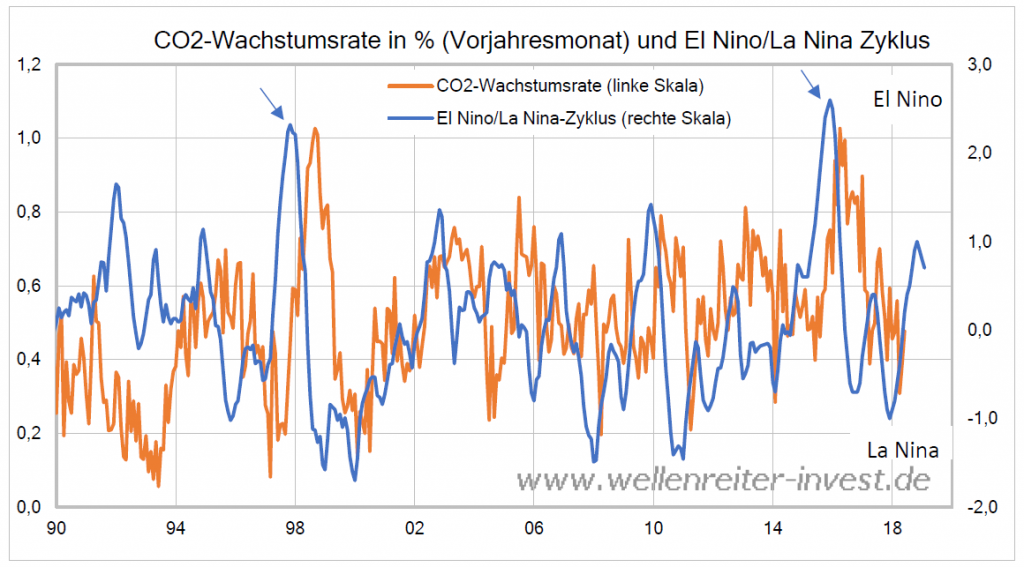
Der Wellenreiter schreibt dazu:
Der El Niño/La Niña-Zyklus (ONI) läuft der Entwicklung der CO2-Wachstumsrate voraus.
Dies ist auf dem obigen Chart gut zu erkennen (siehe auch die Pfeilmarkierungen).
Die Wachstumsrate des CO2-Ausstoßes folgt dem El Niño/La Niña-Zyklus und damit der Temperaturentwicklung.
Das bedeutet nicht, dass der Mensch keinen Einfluss auf die CO2-Entwicklung hat.
Aber die Feinsteuerung erfolgt durch den El Niño/La Niña-Zyklus.
-
Wellenreiter Invest
2016-10-11 de Dicke Luft
⇧
12 Korrelation: Weizenpreise und Sonnentätigkeit
en
200 years ago: Wheat prices and sunspots
fr
William Herschel: Prix des céréales et taches solaires
Mit folgenden Links wird von anderen Webseiten auf diese Seite verwiesen:
▶Klima-Beobachtungen: Korrelation: Weizenpreise und Sonnentätigkeit
-
Wikipedia de
Wilhelm Herschel
en William Herschel
fr William Herschel
de
Sonnenaktivität und Weizenpreis
Schon William Herschel entdeckte den Zusammenhang
Vor über zwei Jahrhunderten bemerkte der britische königliche Astronom William Herschel einen Zusammenhang zwischen den Sonnenflecken und dem Weizenpreis in England.
Wenn wenige Flecken beobachtet wurden, stiegen die Preise.
en
Solar Activity and Wheat Prices
William Herschel noted a correlation
More than two centuries ago, the British Astronomer Royal William Herschel noted a correlation between sunspots and the price of wheat in England.
He suggested that when there were few sunspots, prices rose.
-
When the latter were few in number, he noted, the climate turned colder and drier, crop yields fell and wheat prices rose.
-
In the last few years, sunspot activity has dropped to its lowest point for a century.
One of our biggest worries is that our politicians are so fixated on the idea that CO2 is causing global warming that most of them haven't noticed that the problem may be that the world is not warming but cooling, with all the implications that has for whether we get enough to eat.
-
Spektrum der Wissenschaft / Thilo Körkel
2003-01-01 de Beeinflusst die kosmische Strahlung das Klima?Astronomiebegeisterte Weizenspekulanten hätten mit den Erkenntnissen von William Herschel (1738-1822) viel Geld verdienen können.
Hypothese vom Jahr 1801
Im Jahre 1801 stellte der aus Hannover stammende Astronom eine gewagte Hypothese auf
Vermehrte Sonnenflecken gehen mit intensiverer Sonnenstrahlung und damit einer milderen Witterung einher.
Allerdings fehlten Herschel die Temperaturdaten, um seine Idee zu überprüfen.
Daher nahm er kurzerhand den Weizenpreis als Indikator
Kälte, so seine Überlegung, führt zu schlechteren Ernten, und das treibt den Preis in die Höhe.
Tatsächlich zeigte die langjährige statistische Analyse, dass sich das Getreide bei sinkender Anzahl der Sonnenflecken verteuerte.
Das Gelächter
Das Gelächter, mit dem Herschels Gedanken seinerzeit bedacht wurden, ist längst verstummt.
Die Verbindung zwischen Sonnenflecken, solarer Aktivität und globalem Klima hat sich als real und folgenschwer erwiesen.
So ließ eine aktivere Sonne zwischen dem 9. und dem 14. Jahrhundert die Temperatur in Europa um bis zu ein Grad ansteigen.
Auch die "Kleine Eiszeit" in Nordeuropa zwischen 1550 und 1850 beruht zu einem großen Teil auf Schwankungen der solaren Aktivität, verstärkt durch Vulkanismus.
Damals verschwanden fast alle Sonnenflecken; die Temperatur sank um ein Grad.
Missernten führten zu Hungersnöten, und extrem kalte Winter ließen die Flüsse zufrieren.
Die Rolle des Sonnenwinds
Auch zur heute beobachteten globalen Erwärmung leistet die steigende Sonnenaktivität einen Beitrag.
Das Intergovernmental Panel for Climate Change (IPCC), eine Art Klimabeirat der Vereinten Nationen, schätzt ihn auf rund zwanzig Prozent.
Den Löwenanteil schreibt es den Treibhausgasen zu, die der Mensch der Atmosphäre zuführt.
Als Maß für die Klimawirksamkeit dient dabei der so genannte Strahlungsantrieb.
Er gibt an, wie stark ein bestimmter Klimafaktor das Gleichgewicht zwischen der auf die Erde einfallenden und der von ihr ins All zurückgeworfenen Strahlung verschiebt.
Je größer der Strahlungsantrieb dieses Faktors, desto mehr trägt er zur Erwärmung bei.
Eine neuere Theorie schreibt der Sonne allerdings einen größeren Einfluss zu als die vom IPCC geschätzten 0,3 Watt pro Quadratmeter.
Dabei berücksichtigt sie einen indirekten Effekt über den Sonnenwind, der sich bei zunehmender solarer Aktivität gleichfalls intensiviert.
Die Argumentation ist recht vertrackt und geht um mehrere Ecken.
Der Sonnenwind selbst wirkt sich nämlich nicht auf das Klima aus, da ihn das Erdmagnetfeld in weitem Bogen um unseren Planeten herumlenkt.
Allerdings beeinflusst er seinerseits einen anderen Teilchenstrom: die so genannte kosmische Strahlung aus dem Weltall.
Sie besteht aus Teilchen mit Energien bis zu 1020 Elektronenvolt - 100 Millionen Mal so viel, wie Physiker mit den besten Teilchenbeschleunigern erreichen können.
Hauptsächlich handelt es sich um Protonen, hinzu kommen Kerne von Helium sowie - zu einem geringen Prozentsatz - von schwereren Elementen.
Der Ursprung der kosmischen Strahlungsteilchen ist noch unklar, möglicherweise stammen sie von fernen Sternexplosionen (Supernovae).
Durch ihre sehr hohe Energie dringen sie bis in die untere Atmosphäre ein.
In jüngster Zeit aber wurden immer mehr von ihnen schon im All ausgebremst:
Der Sonnenwind verdoppelte in den vergangenen hundert Jahren seine Stärke und reduzierte so die Intensität der auf die Erde auftreffenden kosmischen Strahlung um rund fünfzehn Prozent.
Im Jahr 1997 fanden Eigil Friis-Christensen und Henrik Svensmark vom Dänischen Institut für Weltraumforschung in Kopenhagen Hinweise auf einen möglichen Zusammenhang zwischen diesem Effekt und der globalen Erwärmung.
Sie stellten fest, dass bei hoher Intensität kosmischer Strahlung die Wolkenbedeckung über den Meeren zunimmt und umgekehrt.
Drei Jahre später konnten sie dieselbe Korrelation auf Basis umfassenderer Daten auch für die Landflächen nachweisen.
Demnach würde die Abschwächung der kosmischen Strahlung durch einen heftigeren Sonnenwind über geringere Wolkenbildung für mehr Sonnenschein und damit höhere Temperaturen sorgen.
Aber wie können die Teilchen aus dem All die Wolkenbildung fördern?
Eine mögliche Antwort liefern nun Untersuchungen von Fangqun Yu von der State University of New York in Albany.
Er fand anhand von Modellrechnungen heraus, dass eine intensivere kosmische Strahlung in der unteren Troposphäre mehr Kondensationskeime für Wassertröpfchen erzeugt, von denen die Wolkenbildung ausgeht.
Die Troposphäre ist die erdnahe Atmosphärenschicht, in der das Wetter stattfindet; darüber liegt ab etwa acht Kilometer Höhe die Stratosphäre.
Wenn also die kosmische Strahlung abnimmt, ist die Wolkendecke dünner und hält weniger Sonnenlicht ab.
Dadurch steigt die Temperatur an der Erdoberfläche.
Gleichzeitig kühlt sich die untere Troposphäre ab, da es dort weniger Wolken gibt, die sich durch Lichtabsorption erwärmen könnten.
Das würde vielleicht auch ein besonders widerspenstiges Problem der Klimaforscher lösen:
Während sich die Oberfläche der Erde im Verlauf der vergangenen zwei Jahrzehnte um rund 0,15 Grad Celsius pro Jahrzehnt erwärmt hat, ergeben Satelliten- und Ballonmessungen bis in acht Kilometer Höhe überraschenderweise nur einen Temperaturanstieg um ein Drittel dieses Werts; sogar sinkende Temperaturen liegen im Bereich der Messunsicherheiten.
Im Widerspruch dazu prognostizieren die aktuellen Klimamodelle, dass sich die Troposphäre aufgrund des Treibhauseffektes sogar schneller als die Erdoberfläche aufwärmen sollte.
Angesichts dieser Diskrepanz haben manche Wissenschaftler sogar bezweifelt, dass tatsächlich eine globale Erwärmung stattfindet.
Mit Yus Modellrechnungen ließe sie sich hingegen zwanglos erklären.
Insgesamt könnte die verringerte kosmische Strahlung, wie der amerikanische Forscher spekuliert, in den letzten beiden Jahrzehnten rund ein Drittel des tatsächlich gemessenen Temperaturanstiegs der Erdoberfläche verursacht haben.
Auch Wissenschaftler des Europäischen Teilchenforschungszentrums Cern sehen dies so.
Im Cloud-Projekt, das voraussichtlich in diesem Sommer starten wird, wollen sie mit Hilfe einer künstlichen Quelle für kosmische Strahlung deren Einfluss auf die Mikrophysik der Atmosphäre überprüfen.
Dünnere Wolkendecke
Projektleiter Jasper Kirkby vermutet, dass die globale Wolkenbedeckung in niedrigen Höhen im letzten Jahrhundert um 1,3 Prozent abgenommen hat.
Dies entspräche einem Strahlungsantrieb von 0,8 Watt pro Quadratmeter.
Den Strahlungsantrieb durch den Menschen, hervorgerufen durch die Emission von Treibhausgasen und Aerosolen sowie zu kleinen Teilen durch eine veränderte Landnutzung, schätzt das IPCC im selben Zeitraum auf 1,3 Watt pro Quadratmeter.
Der kosmische Effekt rückt somit in eine ähnliche Größenordnung wie der menschliche Einfluss auf das Klima.
Doch wie gesichert ist eine solche Erkenntnis?
Bisherige Klimamodelle bilden die variablen Eigenschaften der Sonne ebenso wie die komplexen Vorgänge in der Atmosphäre nur unzureichend ab.
Auch die neuen Ansätze weisen gravierende Schwachpunkte auf und sind von einer vollständigen Beschreibung aller beteiligten Prozesse weit entfernt.
Angesichts der großen Unsicherheiten gehen die Positionen der Wissenschaftler daher teilweise weit auseinander.
Unterdessen weitet sich die Suche nach Klimaeinflüssen auf die gesamte Milchstraße aus.
Einer neuen Studie zufolge trifft seit einigen Jahrmillionen nur wenig kosmische Strahlung auf die Erde, weil sich unser Sonnensystem in einer relativ dünn mit Sternen bestückten Region der Milchstraße befindet.
Wandert es dagegen in das viel dichtere Zentrum eines Spiralarms, dürfte sich angesichts der dort viel häufiger anzutreffenden Supernovae das Teilchen-Bombardement aus dem All verdoppeln.
In der Erdatmosphäre sollten der Theorie zufolge dann viel mehr Wolken entstehen, sodass die Temperaturen am Boden stark sinken.
Dass dies in unserer Vergangenheit bereits mehrfach der Fall gewesen sein könnte, zeigt die Untersuchung von 42 Eisenmeteoriten durch Nir Shaviv von der Universität Toronto und der Hebräischen Universität in Jerusalem.
Mikroskopische Spuren von Einschlägen hochenergetischer Teilchen auf der Oberfläche dieser Vaganten aus unserem Sonnensystem deuten auf einen Intensitätszyklus der kosmischen Strahlung von rund 143 Millionen Jahren hin.
Diese Periode wiederum passt gut mit den geologischen Erkenntnissen über die Periodizität der Eiszeiten auf der Erde zusammen.
⇧
13 Kohlenstoffdioxid (CO2)

en Carbon dioxide (CO2)
fr Dioxyde de carbone (CO2)
- a CO2 Plant Food & Giver of Life
- b de Emissionen von Wäldern beeinflussen die Wolkenbildung en Emissions from forests influence very first stage of cloud formation
↑ a CO2 Plant Food & Giver of Life
2010-04-09 en
![]() Seeing is Believing
Seeing is Believing
Isolated for 42 days in chambers of ambient and elevated CO2 concentrations, we periodically document the growth of cowpea plants (Vigna unguiculata) via time-lapse photography.
2013-03-13 en
![]() Matt Ridley on How Fossil Fuels are Greening the Planet
Matt Ridley on How Fossil Fuels are Greening the Planet
Over the past three decades, our planet has gotten greener!
Even stranger, the greening of the planet in recent decades appears to be happening because of, not despite, our reliance on fossil fuels.
While environmentalists often talk about how bad stuff like CO2 causes bad things to happen like global warming, it turns out that the plants aren't complaining.
-
Barrett Bellamy Climate
en The giver of lifeThis is a short description of the process of photosynthesis and how the carbon dioxide molecule gives us life as well as heat
The giver of life
This is a short description of the process of photosynthesis and how the carbon dioxide molecule gives us life as well as heat
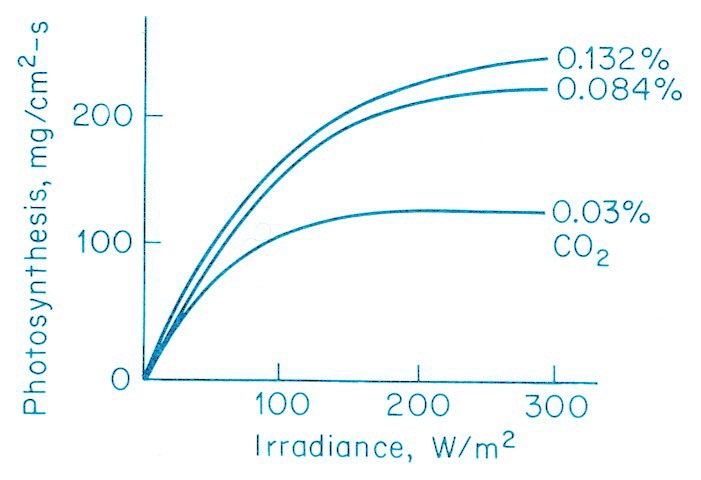
The graphs show how the rate of photosynthesis varies with irradiance, the three experiments differing only in the concentration of CO2.
The lowest graph is that for a CO2 concentration of 0.03%, much as it is at this time [actually ~385 ppmv or 0.0385%].
In the early part of the graph the rate of the reaction is related almost directly to the amount of irradiance, but the rate falls off at higher irradiances and eventually levels off.
This tells us that at higher irradiances it is the concentration of CO2 that limits the reaction rate, there is sufficient light falling on the leaves, but the requirement for more CO2 is the limiting factor.
We strongly object to CO2 being regarded as a pollutant; it is the giver of life and we all depend upon its chemical and radiative properties.
-
EIKE Europäisches Institut für Klima und Energie
H. Sterling Burnett 2015-09-22 de Interview: Kohlendioxid ernährt die WeltSherwood Idso, Ph.D.
Sherwood Idso, Ph.D., einer der weltführenden Kapazitäten auf dem Gebiet der Wirkung von Kohlendioxid auf Pflanzen, wurde im Jahre 2001 zum Präsidenten des 'Center for the Study of Carbon Dioxide and Global Change' berufen.
Idso wurde auch auf der 9. Internationalen Konferenz zum Klimawandel (ICCC-9) im Juli 2014 für sein Lebenswerk als Beitrag zur Wissenschaft ausgezeichnet.
Hier äußert er sich in einem Interview mit H. Sterling Burnett vom Heartland Institute.
Falls der Verbrauch fossiler Treibstoffe nicht närrischerweise limitiert wird im Zuge eines abwegigen Versuches, den Klimawandel zu verhindern - zuvor globale Erwärmung genannt - wird die erwartete Zunahme der CO2-Emissionen in der Atmosphäre die Ernteerträge sowie die Wasser-Effizienz aller in der Welt erzeugten Nahrungsmittel deutlich verbessern.
Dies erlaubt es uns die wachsende Weltbevölkerung weiter zu ernähren auch noch weit über das Jahr 2050 hinaus.
Dann werden Berechnungen zufolge etwa 9 Milliarden Menschen auf der Erde leben, verglichen mit den heutigen 7,2 Milliarden.
-
Heartland Institute / H. Sterling Burnett
2015-09-16 en Interview: CARBON DIOXIDE FEEDS THE WORLDSherwood Idso, Ph.D.
Sherwood Idso, Ph.D., one of the world's leading authorities on the effects of carbon dioxide on plants, became president of the Center for the Study of Carbon Dioxide and Global Change in 2001. Idso was honored at the Ninth International Conference on Climate Change (ICCC-9) in July 2014 for his lifetime contribution to science.
Idso wurde auch auf der 9. Internationalen Konferenz zum Klimawandel (ICCC-9) im Juli 2014 für sein Lebenswerk als Beitrag zur Wissenschaft ausgezeichnet.
Please tell our readers a little about your research background and how you ultimately came to study the carbon dioxide fertilization effect on plants.
I have found if fossil fuel usage is not foolishly restricted in a misguided attempt to prevent climate change - previously referred to as global warming - the expected increase in anthropogenic CO2 emissions will significantly enhance the yields and water-use efficiencies of essentially all of the world's food crops,
allowing us to continue to feed the world's growing population up to and far beyond the year 2050,
when it is expected to peak out at approximately nine billion people, compared to today's 7.2 billion.
-
NIPCC Nongovernmental International Panel on Climate Change
2014 en Climate Change Reconsidered II: Biological ImpactsSummary for Policymakers
The human impact on global climate is small, and any warming that may occur as a result of human carbon dioxide (CO2) and other greenhouse gas emissions is likely to have little effect on global temperatures, the cryosphere (ice-covered areas), hydrosphere (oceans, lakes, and rivers), or weather.
the subject of this Summary for Policymakers, examines the scientific research on the impacts of rising temperatures and atmospheric CO2 levels on the biological world (Idso et al., 2014).
It finds no net harm to the global environment or to human health and often finds the opposite: net benefits to plants, including important food crops, and to animals and human health
-
Le Monde
2016-04-28 fr La Terre verdit grâce aux émissions de CO2Le dioxyde de carbone rejeté par les activités humaines a accru la quantité de feuilles des arbres entre 1982 et 2009, selon un rapport couplant observations et modèles informatiques.
Une Terre plus verte, c'est-à-dire arborant une végétation plus dense.
C'est ce que démontre une étude publiée dans Nature Climate Change, lundi 25 avril, menée par une équipe de 32 scientifiques issus de 24 centres de recherche dans 8 pays du monde.
Pour parvenir à cette conclusion, les chercheurs ont étudié les données de trois satellites, qui ont mesuré la quantité de rayonnement solaire réfléchi par la végétation, jour après jour entre 1982 et 2009.
Ils en ont déduit un indice foliaire pour chaque parcelle de la planète, compris comme la quantité de feuilles par mètre carré de sol.
Evolution du couvert foliaire entre 1982 et 2009 (en %)

| de | en | fr |
|---|---|---|
|
Auswirkungen des Klimawandels Biosphäre der Erde Auswirkungen auf die Lebewelt |
Impacts of Climate Change Biosphere Impacts on the World of Life |
Conséquences du changement climatique Biosphère Impacts sur la vie terrestre |
↑
b Emissionen von Wäldern beeinflussen die Wolkenbildung
en Emissions from forests influence very
first stage of cloud formation
fr Émissions de forêts influencent la formation
de nuages
![]()
![]()

-
Watts Up With That? (Antony Watts)
2014-05-16 en Tweaking the climate models: Researchers show emissions from forests influence very first stage of cloud formation
These clouds are almost certainly a result of evapotranspiration.
The clouds are distributed evenly across the forest, but no clouds formed over the Amazon River and its floodplain, where there is no tall canopy of trees.
While water may evaporate from the Amazon River itself, the air near the ground is too warm for clouds to form.
Trees, on the other hand, release water vapor at higher levels of the atmosphere, so the water vapor more quickly reaches an altitude where the air is cool enough for clouds to form.
When water vapor condenses, it releases heat into the atmosphere.
| de | en | fr |
|---|---|---|
|
Klimawandel: Wissenschaft Wasserdampf / Wolken |
Climate change: Science Water vapor / Clouds |
Changement climatique: Science Vapeur d'eau / nuages |
|
Wolkenforschung, Korrelation zwischen der kosmischen Strahlung und der Wolkenbildung, Korrelation zwischen Wolken und Temperatur, Der Wasserdampfverstärker für das CO2, Das Geheimnis der Wolken. |
||
⇧
14 Methan (CH4)
en Methane (CH4)
fr Méthane (CH4)
|
|
|
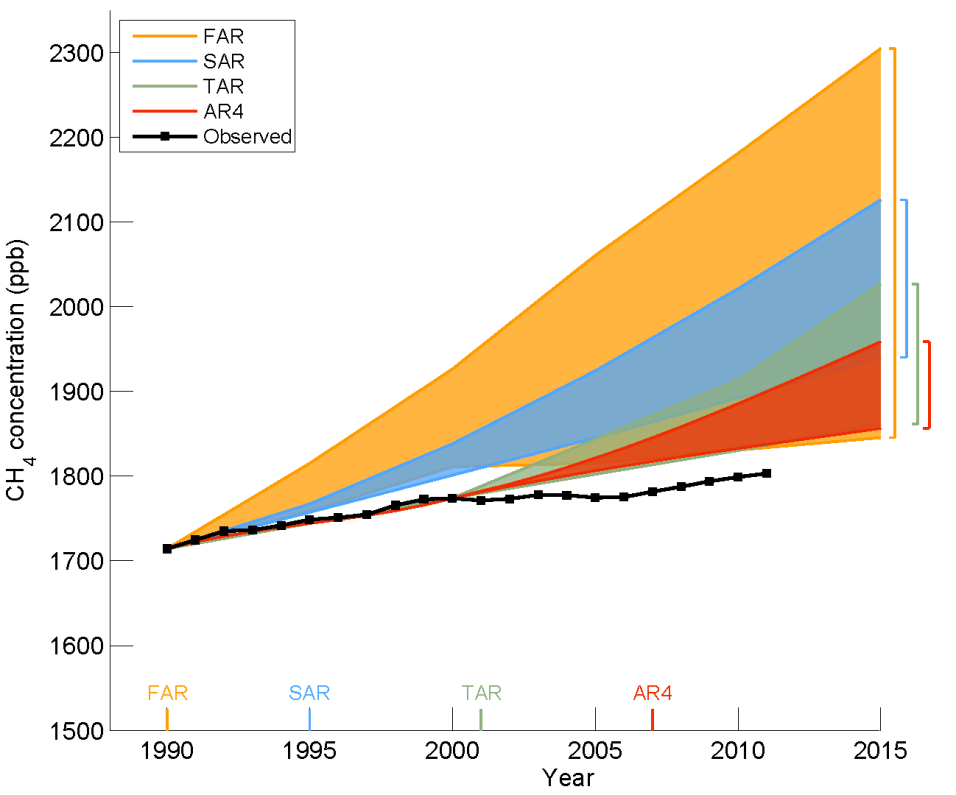
⇧
15 Wolken
en Clouds
fr Nuages
↑ a Warum zieht der Vollmond die Wolken an?
![]()
![]()

![]()
![]()

-
Erstes Hamburger Klima- und Energiegespräch
2013-06-14 de
Warum zieht der Vollmond die Wolken an? Vortrag von Prof. Walter Fett in Hamburg
↑ b Phase of the moon affects amount of rainfall
|
|
Satellite data over the tropics, between 10 degrees S and 10 degrees N, shows a slight dip in rainfall when the moon is directly overhead or underfoot. The top panel shows the air pressure, the middle shows the rate of change in air pressure, and the bottom shows the rainfall difference from the average. The change is 0.78 micrometers, or less than one ten thousandth of an inch, per hour. |
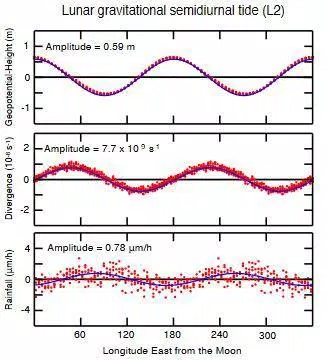
-
Die kalte Sonne (Fritz Vahrenholt & Sebastian Lüning)
2016-02-19 de Klimafakten.de und die Deutsche Welle: Eine unheimliche Liaison
-
Watts Up With That? (Antony Watts)
2016-02-01 en Study claims: Phase of the moon affects amount of rainfallWhen the moon is high in the sky, it creates bulges in the planet's atmosphere that creates imperceptible changes in the amount of rain that falls below.
New University of Washington research to be published in Geophysical Research Lettersshows that the lunar forces affect the amount of rain - though very slightly.
Quelle / Source:
-
University of Washington
2016-01-29 en Moon's tidal forces affect amount of rainfall on Earth
⇧
16 Vulkane
en Volcanos
fr Volcans
↑ a Vulkane und der Temperatur-Stillstand
|
|
|
|
|
|
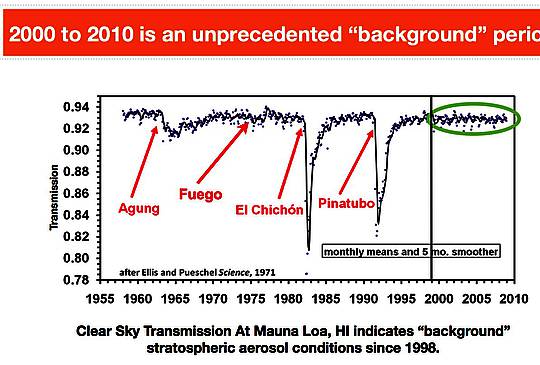
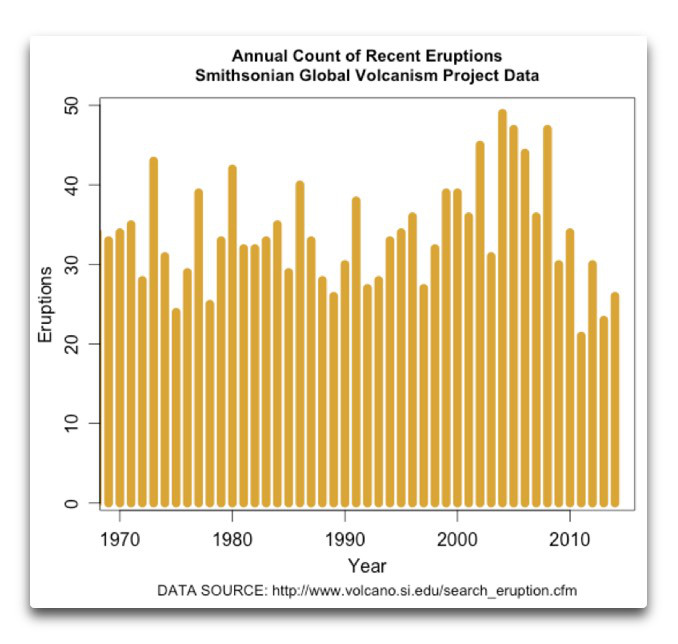
⇧
17 Energie
en Water vapor & Energy
fr Énergie
↑ a NIE = Neue Instabile Energien
|
|
EIKE 2013-12-27 "Flaute und Wolken stoppen Ökostrom-Produktion" Jeder weiß es: In den Wintermonaten sind die Tage kürzer, die Sonne steht nur tief am Horizont, wenn die Wolken ihre Strahlen überhaupt durchlassen und Nebel und Starkwind, ebenso wie tagelange Flauten, sind eindeutige meteorologische Kennzeichen der "dunklen Jahreszeit". Diese bekannten Eigenschaften des mitteleuropäischen Winters lösen bei den Befürwortern der NIE (Neue Instabile Energien) immer aufs Neue Überraschung aus.
Dies wird auch bei einer Verdoppelung der Solar- und Windanlagen
so bleiben. |

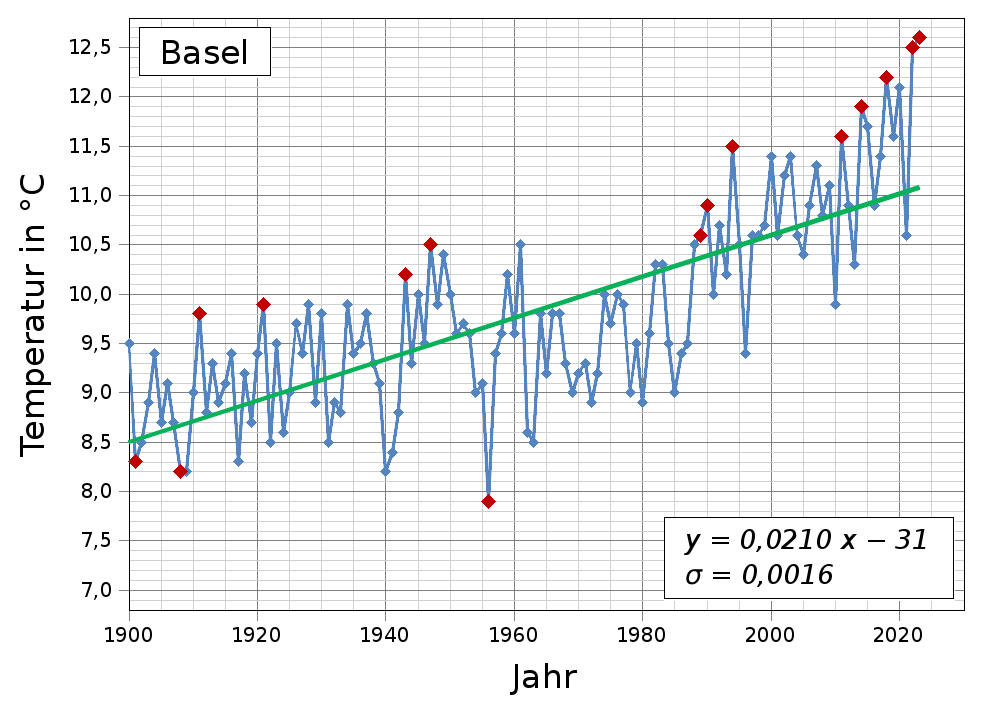
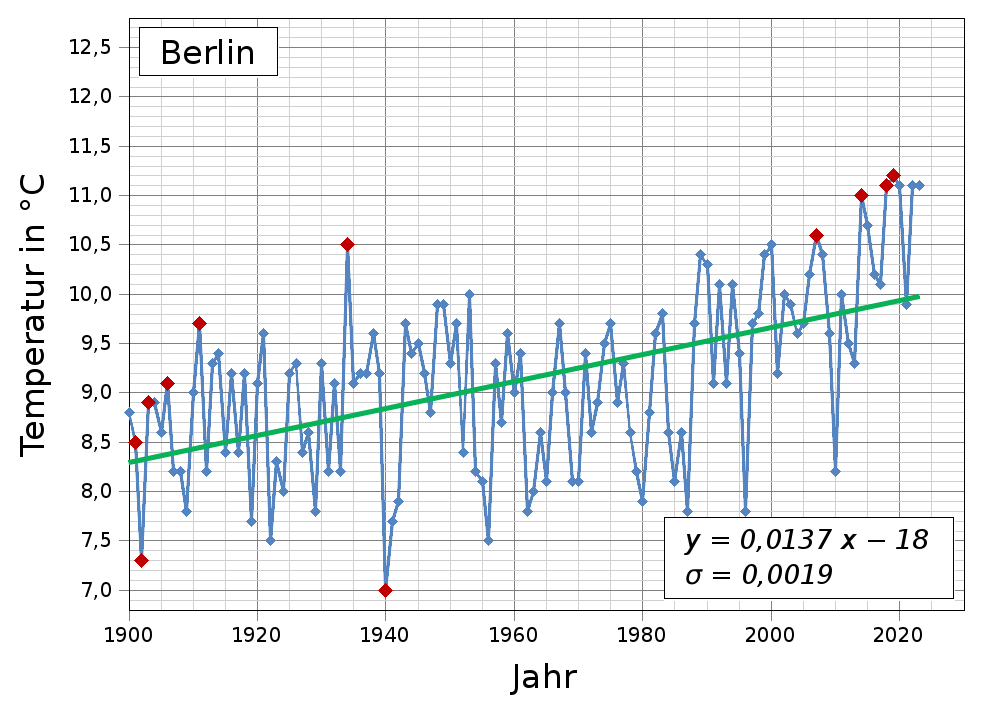
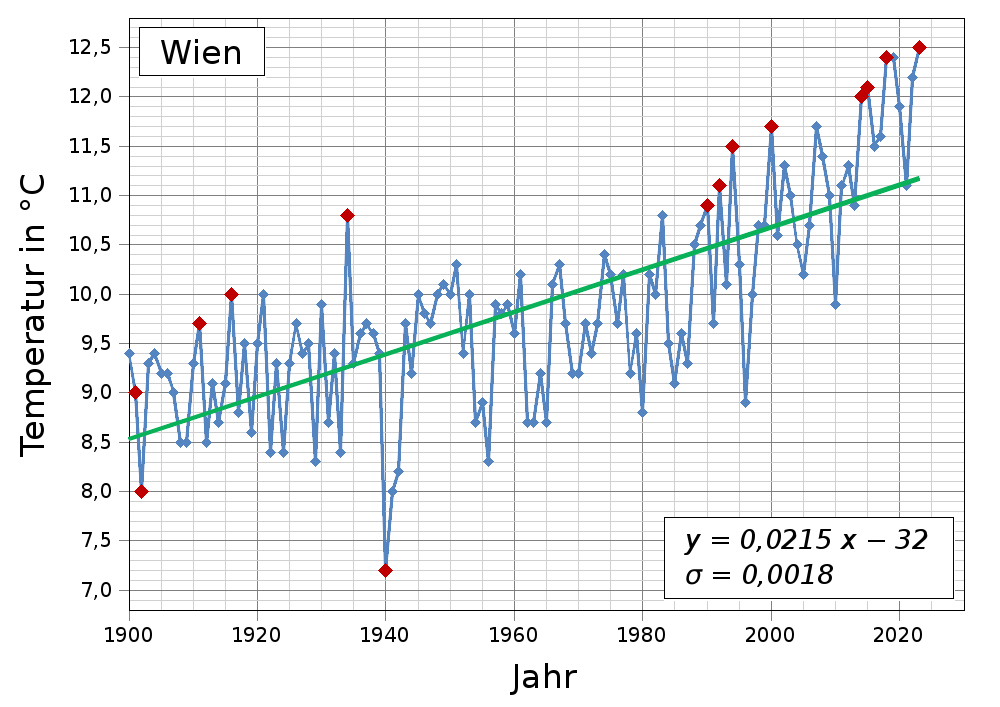
| de | en | fr |
|---|---|---|
|
Energie: Politik Grüne Energiepolitik |
Energy: Politics Green Energy Policy |
Énergie: Politique Politique de l'énergie verte |
⇧
18 Scheinkorrelationen
en
Spurious Correlations
en
Corrélations illusoire
- de Korrelationen mit Störchen
- de
Es ist nicht ganz das, als was es erscheint
en Spurious Correlations fr Corrélations illusoire
↑ Korrelationen mit Störchen
![]()
![]()

-
EIKE Europäisches Institut für Klima und Energie
Michael Limburg
2018-01-09 de Von Korrelationen, Trends bei Anomalien!Vielfach werden besonders gern in der Klimawissenschaft Korrelationen als Belege für Abhängigkeiten zweier Zeitreihen voneinander gezeigt.
Doch eine Korrelation ist nur eine notwendige aber nicht ausreichende Bedingung, um eine vermutete Ursache-Wirkungsbeziehumg zwischen diesen Variablen zu belegen.
Dieser ist aber für die Klimawirksamkeit von z.B. CO2 nicht erbracht.
Der folgende Beitrag beleuchtet die Zusammenhänge.
Er wurde zwar schon mal vor knapp 7 Jahren veröffentlicht, scheint aber weiterhin hoch aktuell zu sein.
| de | en | fr |
|---|---|---|
|
Fakten / Faktentabelle
→ 3.4.2 Klima-Wissenschaft → 3.10.2 Klima-Informationen → 4.5.6 Klima-Skandal: Realität |
Facts / Table of Facts
→ 3.4.2 Climate Science → 3.10.2 Climate Information → 4.5.6 Climate Scandal: Reality |
Faits / Tableau des faits
→ 3.4.2 Science du climat → 3.10.2 Informations sur le clima → 4.5.6 Scandale climatique: Réalité |
↑
Es ist nicht ganz das, als was es erscheint
en Spurious Correlations
-
Die kalte Sonne (Fritz Vahrenholt & Sebastian Lüning)
2015-05-20 de Spurious Correlations: Es ist nicht ganz das, als was es erscheint
Korrelation zwischen CO2 und Temperatur
CO2 ist ein starkes Treibhausgas, sagt der IPCC.
Dazu bräuchte man nur den Verlauf des CO2 und der Temperatur in den letzten 100 Jahren anschauen:
Beides stieg an. Fertig ist der Beweis.
![]()
![]()

Korrelation mit Personen, die in ein Schwimmbad fallen
Aus folgender Wesite: Spurious Correlations
Auf seiner Webseite hat er die interessantesten Korrelationen zusammengestellt.
Unter den dort aufgeführten 30.000 Beispielen findet sich auch die folgende Kurve.
Hätten Sie gedacht, dass die Anzahl der in Schwimmbecken ertrunkenen Unfallopfer bestens mit der Anzahl von Filmen korreliert, in denen der Schauspieler Nicolas Cage mitwirkt?
![]()
![]()

Korrelation mit dem Alter von Miss Amerika
Interessant auch das nächste Chart.
Dort erkennt man eine ziemlich gute Korrelation zwischen dem Alter von Miss America und der Anzahl von Mordfällen bei denen heißer Dampf und andere heiße Objekte eine Rolle gespielt haben:
![]()
![]()

Korrelation mit nicht-kommerziellen Raketenstarts
Sehr überzeugend auch die folgenden beiden Kurven.
Es scheint einen deutlichen Zusammenhang zwischen der Anzahl weltweiter nichtkommerzieller Weltraum-Raketenstarts mit den Soziologie-Promotionsabschlüssen in den USA zu geben:
![]()
![]()

Spielverderber
Spielverderber könnten nun einwerfen, dass Korrelation nicht gleich Kausalität bedeutet.
Ein interessanter Gedanke.
Gäbe es statt dem CO2 vielleicht noch einen anderen denkbaren Hauptantrieb für den globalen Temperaturanstieg im 20. Jahrhundert?
In der Tat.
Der Verlauf der Temperatur hat einen auffällig ähnlichen Verlauf wie die Sonnenaktivität, ausgedrückt in der Stärke des Sonnenmagnetfeldes
![]()
![]() Entwicklung der Sonnenaktivität während der letzten 150 Jahre
Entwicklung der Sonnenaktivität während der letzten 150 Jahre
am Beispiel der Sonnenflecken und des Sonnenmagnetfeldes

| de | en | fr |
|---|---|---|
|
Klima: Wandel Ursachen des Klimawandels |
Climate: Change Causes of Climate Change |
Climat: Changement Les causes du changement climatique |
|
Einflüsse auf das Klima Temperatur der Erde Klima-Beobachtungen Neuste Meldungen zum Klimawandel |
Impacts on Climate Change Earth Temperature Climate Observations News on Climate Change |
Impacts sur le climat Température de la terre Observations sur le climat Dernières nouvelles sur le changement climatique |
- suite ... fr Chapitres 6 - 10