Theodor Landscheidt | Dr, Schroeter Institute for Research in Cycles of Solar Activity, Nova Scotia, Canada |
|---|
↑ Who is who
↑ de Allgemein en General fr Générale
Dr. Theodor Landscheidt (1927-2004)
Natural Astrology / Bruce Scofield
2018-03-29 de
Theodor Landscheidt
On May 19th of 2004 Theodor Landscheidt, one of the most scientific contributors to the field of astrology in the 20th century, died.
He was known, though not necessarily understood, for his occasional journal articles and presentations at conferences, mostly in the 1960's and 70's.
During the past two decades he was known as a radical climatologist who operated outside the academic institutions and actually made bold predictions, many of which were quite accurate.
He was born on March 10, 1927 at 5:08 PM GMT in Bremen, Germany.
Landscheidt studied philosophy and natural science, earned a doctorate at the University of Gottingen, had a career as West German High Court Judge, and was the director of the Schroeter Institute for Research in Cycles of Solar Activity.
| Continue reading |
Bourabai Research
en
Home
en
Theodor Landscheidt 10.3.1927 - 19.5.2004
en
Selected Publication of Theodor Landscheidt
Pensée unique fr Préparons nous au refroidissement !
Avant son décčs survenu en 2004, Theodor Landscheidt avait laissé une sorte de testament pour les années ŕ venir. Il prévoyait que la température allait progressivement décliner jusqu'en 2030.
Beispiele für die Verwendung dieser Seiten
Zur Akzeptanz von solchen Forschungen
Die kalte Sonne (Fritz Vahrenholt & Sebastian Lüning)
2019-07-13 de
Der vergessene Protest:
Als sich vor 20 Jahren eine Gruppe AWI-Forscher gegen den
Klimaalarm verwehrte
Anfang Juli 2019 brachten wir an dieser Stelle die deutsche Überstezung einer Petition von 90 italienischen Klimawissenschaftlern gegen den Klimaalarm.
Michael Krüger erinnerte eine Woche später im ScienceSkepticalBlog an einen ähnlichen Appell vor 20 Jahren von führenden Klimaforschern am Alfred Wegener Institut in Bremerhaven:
Science Skeptical / Michael Krueger
2019-07-11 de
90 Wissenschaftler aus Italien erklären die alarmistischen Thesen zur
Klimaentwicklung von Rahmstorf, PIK und CO. für substanzlos!
...
Einen ähnlichen Apell gab es schon vor 20 Jahren von führenden Klimaforschern am Alfred Wegener Institut in Bremerhaven.
Mit drei Sätzen lässt Prof. Ernst Augstein die Weltklimakonferenz, die am 1. Dezember 1997 im japanischen Kyoto eröffnet wird, als globale Farce erscheinen.
"Es stimmt", sagt er, "dass weltweit die Temperaturen steigen.
Es stimmt auch, dass die Konzentration des Treibhausgases CO2 in der Atmosphäre zunimmt und dass der Mensch dazu beigetragen hat und weiter beiträgt.
Es ist aber überhaupt nicht erwiesen, dass der gegenwärtige Temperaturanstieg etwas mit der aktuellen CO2-Zunahme zu tun hat."
Seine Befürchtung: "Vielleicht drehen wir, was das Weltklima angeht, in Kyoto an den völlig falschen Knöpfen."
Ernst Augstein ist nicht irgendjemand.
Der Ozeanograph am Alfred-Wegener-Institut (AWI) für Polar- und Meeresforschung in Bremerhaven war zeitweise Vorsitzender des Klimabeirates der Bundesregierung.
Augstein bestreitet, dass man aus den Klimasimulationen der Großcomputer auf reale Abläufe in der Natur schließen darf.
Es gebe selbst in der jüngeren Erdgeschichte Beispiele für schnelle und große Temperaturänderungen, bei denen das CO2 - der wichtigste Faktor in den Berechnungen - keine Rolle gespielt habe.
Er verweist auf die "Kleine Eiszeit":
Zwischen dem 14. und 18. Jahrhundert habe sich die Weltmitteltemperatur zunächst um knapp ein Grad verringert, um dann binnen 150 Jahren um den gleichen Wert rapide wieder anzusteigen.
Erklären kann das bis heute keiner.
Augstein wird unterstützt von dem Geophysiker Heinz Miller (Ex Stellvertretender Direktor des AWI und Polarforscher mit über 30 Jahren Polarerfahrung), dem Klimamodellierer Dirk Olbers und dem Meeresphysiker Claus Böning.
Alles Urgesteine der Klimaforschung.
Als Motiv dafür, warum so viele Fachleute anders handeln, kann Augstein sich vieles vorstellen:
"Es geht um Millionen an Forschungsgeldern, es geht um Einfluß und um Eitelkeiten."
Gegenüber dem Vorsitzenden der Weltklimaorganisation WMO in Genf, Prof. Hartmut Graßl, setzt er noch eines drauf:
"Persönlich verstehen wir uns gut, sind praktisch Sandkastenfreunde.
Aber Graßl ist ein Mann, der gern die Katastrophenorgel dreht, der notfalls auch versucht, Ziele, die er für richtig hält, mit zweifelhaften Argumenten durchzusetzen."
Und so ist es noch heute.
Einen längeren Bericht zum heute fast vergessenen AWI-Protest gegen den Klimaalarm kann man in Bild der Wissenschaft in einem Artikel von 1998 nachlesen.
wissenschaft.de / Jürgen Nakott
1998-01-01 de
Der Expertenkrieg ums Klima
Ernst Augstein ist nicht irgendjemand. Der Ozeanograph am Alfred-Wegener-Institut (AWI) für Polar- und Meeresforschung in Bremerhaven war zeitweise Vorsitzender des Klimabeirates der Bundesregierung.
Er verließ dieses - inzwischen aufgelöste - Gremium im Streit, weil man, wie er sagt, seinen Argumenten nicht das nötige Gewicht beimaß.
Ihn aber deshalb als Kronzeugen berufen zu wollen für die - vor allem in den USA - heftig propagierte Ansicht, die von Menschen gemachte Klimaerwärmung existiere gar nicht, wäre falsch.
Augstein sagt nur, daß die Zusammenhänge zwischen Treibhausgas und Treibhauseffekt für die momentanen Änderungen des Weltklimas wissenschaftlich nicht bewiesen seien.
Den AWI-Forschern gebührt höchste Anerkennung.
Damals haben Graßl, Hasselmann & Co. die Revolte offenbar schnell in den Griff bekommen.
Kurzer Prozess wurde kurz darauf auch mit den Kollegen der BGR gemacht.
Die Abteilung mit Klimadissidenten wurde kurzerhand geschlossen, den staatlichen Wissenschaftlern ein Maulkorb verpasst.
Die kalte Sonne (Fritz Vahrenholt & Sebastian Lüning)
2012-03-01 de
Pioniere des Klimarealismus:
Die Bundesanstalt für Geowissenschaften und Rohstoffe (BGR)
Im Jahr 2000 veröffentlichte die Bundesanstalt für Geowissenschaften und Rohstoffe (BGR) das bemerkenswerte Buch "Klimafakten", in dem die Forscher überzeugend darlegten, dass natürliche Klimaschwankungen integraler Bestandteil der historischen und daher auch aktuellen Klimaentwicklung sind.
In dem von Ulrich Berner und Hansjörg Streif herausgegebenen Buch fassten mehr als 40 Wissenschaftler der Hannoveraner Bundesbehörde die wichtigsten Fakten zum Thema Klima in einer leicht verständlichen und ansprechend illustrierten Form zusammen.
Bereits in der Einleitung gingen die Autoren auf das entscheidende Grundproblem ein und zeigen auch gleich einen vernünftigen Lösungsweg auf:
"Es ist schwierig oder gar unmöglich, zwischen natürlicher Klimaentwicklung und einer durch den Menschen beeinflussten Klimaschwankung zu unterscheiden.
Will man das natürliche Klimasystem verstehen, so hilft nur der Blick zurück und zwar in Zeitabschnitte der Vergangenheit, in denen der Mensch nicht oder nur sehr gering aktiv war."
Aus ihrer fundierten, geowissenschaftlichen Perspektive setzen die Autoren die Klimaerwärmung von der Kleinen Eiszeit hin zur Modernen Wärmephase in einen Kontext mit dem hierzu parallelen Anstieg der Sonnenaktivität.
In "Klimafakten" lesen wir über den Gleichlauf von kosmischer Strahlung und Wolkenbedeckung (also den Svensmark-Solarverstärker,
siehe auch Kapitel 6 in "Die kalte Sonne" sowie Svensmark-Gastbeitrag) sowie das antarktische Gletscherkalben, das als normaler Bestandteil des antarktischen Eiszyklus entzaubert wird.
...
Die BGR erkannte schon damals die entscheidende Rolle von Schwankungen der Sonnenaktivität für das Erdklima:
"Seit langem ist bekannt, dass das Auf- und Ab der Temperaturen in der Vergangenheit erstaunlich gut mit Variationen der Sonnenaktivität, d.h. mit Veränderungen der von der Sonne eintreffenden Energie, übereinstimmt [..]
Wir erkennen zwar den Zusammenhang zwischen Sonnenaktivität und Klima, leider wissen wir aber noch nicht genau, wie diese Steuerung durch die Sonne funktioniert und sind auf Spekulationen angewiesen. [...]
Solange wir die physikalischen und chemischen Prozesse, die das Klimasystem antreiben, noch nicht vollständig verstehen, können wir das Klima auch nicht wirklichkeitsnah modellieren!
Aufwändige Modelle mit vielen Einflussfaktoren und einer hohen räumlichen und zeitlichen Auflösung versuchen zwar, in die nähere Klimazukunft zu schauen, jedoch ist ein solches Szenario noch lange keine zuverlässige Prognose" (Klimafakten, 4. Aufl., S. 210).
Mit ihrem mutigen Buch stellte die BGR die Alleinherrschaft des Klimagases CO2 in Frage und identifizierte die alarmistischen Prognosen des Weltklimarats als unnötige Übertreibung.
Dies teilte die Behörde auch damals dem Bundeswirtschaftsministerium in einer offiziellen Stellungnahme zum 3. IPCC-Bericht von 2001 mit.
Das Wirtschaftsministerium beauftragte damals die Anstalt noch regelmäßig mit Stellungnahmen zur Klimapolitik.
...
Die Kritik am geliebten Weltklimarat konnte das Klima-Establishment selbstverständlich nicht dulden.
Die Gegenattacken ließen nicht lange auf sich warten.
In einem 'vertraulichen' Dossier, das sogleich seinen Weg über die taz in die Öffentlichkeit fand, kommentierte etwa das Umweltbundesamt (UBA) die Einschätzungen der konkurrierenden Schwesterbehörde als "irrelevant", "eindeutig falsch", "anmaßend" oder "fernab jeder Realität" und forderte, dass sich die Bundesregierung beim IPCC für die Fehleinschätzung entschuldigen müsse.
Ein Sprecher des Umweltministeriums stellte die Hannoveraner als gekaufte Vasallen hin, denen es offenbar darum ginge "die Interessen der Energieindustrie zu vertreten".
Der Kieler Klimaforscher Mojib Latif bezeichnete in einer Monitor-Sendung vom 1. März 2007 die Einschätzungen der BGR-Kollegen zum Klimawandel als "Schande" die die gesamte Klimaforschung "in den Dreck zieht".
Hans Joachim Schellnhuber, Leiter des Potsdam-Instituts für Klimafolgenforschung (PIK), und damals offizieller Klimaberater der Bundesregierung, legte nach: "Die Meinung der BGR ist randständig, und die Behörde spielt keine Rolle in der internationalen Klimadiskussion".
Er nahm den Vorfall zum Anlass, einmal ein ernstes Wörtchen mit dem damaligen Wirtschaftsminister Glos darüber zu reden, "von wem sich sein Ministerium beraten lässt, und ihm den neuesten Stand der Klimaforschung erläutern".
Auch sein PIK-Kollege Stefan Rahmstorf stänkerte eifrig gegen die Klimafakten.
Und Sigmar Gabriel empörte sich: Da werde "aus der Tiefe des Gemüts Propaganda gegen den Klimaschutz gemacht - auf Kosten des Steuerzahlers" (Hannoversche Allgemeine Zeitung, HAZ 12.12.2009).
Die Herausgeber des BGR-Buches Klimafakten landeten auch sogleich auf einer von der IPCC-Seite geführten internen Schwarzen Liste, auf der die Namen deutscher Klimaskeptiker gesammelt wurden.
...
Was die BGR-Forscher damals im Jahr 2000 noch nicht wussten:
In den nachfolgenden 12 Jahren würde die Temperatur um keinen Deut mehr ansteigen.
Das Buch Klimafakten war seiner Zeit weit voraus.
Wenn sich in den kommenden Jahren nun hoffentlich bald endlich die Erkenntnis durchsetzen wird, dass natürliche Klimafaktoren eine sehr viel größere Rolle im Klimageschehen spielen als noch von den ersten 4 IPCC-Berichten angenommen, dann wird dies letztendlich auch eine späte aber wohlverdiente Genugtuung für das mutige BGR-Autorenteam sein.
Der Heidelberger Klimaforscher Augusto Mangini wurde öffentlich von Rahmstorf und Kollegen wegen Aussagen zur natürlichen Klimavariabilität geschmäht.
Die kalte Sonne (Fritz Vahrenholt & Sebastian Lüning)
2012-02-21 de
Prof. Augusto Mangini - Ein Pionier des Klimarealismus
Augusto Mangini ist Vollblut-Geologe.
Er kann in den Schichten der Erde lesen wie in einem Buch.
Mangini schaut mit seinem kräftigen, geochemischen Fernrohr in die Vergangenheit und macht in den scheinbar monotonen Gesteinsablagerungen faszinierende Muster sichtbar.
Anders als seine geologisch datenarmen Physiker-Kollegen vom Weltklimarat lange fälschlicherweise angenommen hatten, waren die letzten 10.000 Jahre der Erdgeschichte durch eine bewegte Temperaturachterbahn geprägt.
Warme Phasen wechselten im hundert und tausend Jahre Maßstab mit kalten Phasen ab.
Die globalen Durchschnitts-Temperaturen schwankten um etwa ein Grad, in einzelnen Regionen sogar gleich um mehrere Grad.
Die fossile Temperaturentwicklung spricht eine klare Sprache:
Während der letzten Wärmeperiode, der sogenannten Mittelalterlichen Wärmephase, waren die Temperaturen sogar höher als heute.
Und das obwohl die CO2-Konzentration damals deutlich niedriger lagen als heute.
Mangini hat mit seinen Messungen der Anwachsschichten von Tropfsteinen in vielen Teilen der Erde einen wahren Datenschatz erzeugt.
Fachlich hat er alles richtig gemacht.
Niemand konnte seine Ergebnisse bis heute widerlegen.
Denn sie stimmen wohl, davon ist auszugehen.
Trotzdem beging Mangini aber einen schlimmen Fehler.
Er glaubte nämlich allen Ernstes, dass er seine Resultate in eine politisierte Debatte einbringen könnte.
Dabei hatte er übersehen, dass die herrschende Organisation gar nicht mehr an weiteren Fakten interessiert war.
Natürlich, in autoritären Staaten wie dem Iran, Kuba oder Nordkorea haben es Forscher traditionell halt ganz schön schwer.
Die Wahrheit steht dort bekanntlich nicht allzu hoch im Kurs.
Da würde der arme Mangini vermutlich ganz schön leiden - könnte man denken.
Da wundert es schon ein kleines bisschen, wenn man hört, dass Mangini Professor im aufgeklärten Deutschland ist, in Heidelberg eine radiometrisch-klimatische Arbeitsgruppe an der Akademie der Wissenschaften leitet.
Aber in Deutschland herrscht doch eigentlich absolute Forschungsfreiheit, das höchste Gut einer freien Wissenschaft?
Durch das ständige Hinterfragen unterzieht sich die Forschung hier einer ständigen Qualitäts-Selbstkontrolle.
Fruchtbare wissenschaftliche Diskussionen führen damit automatisch zu einer stetigen Verbesserung der Theorien.
Selbstverständlich gilt dies auch für alle Wissenschaftszweige in Deutschland - mit einer Ausnahme, nämlich den Klimawissenschaften.
Leider wusste Mangini von dieser Ausnahme nichts und zweifelte aufgrund seiner Forschungsresultate in einem FAZ-Artikel von 2007 aus Versehen einen nicht ganz unwichtigen Teilaspekt des Weltklimarat-Berichts an:
"Auch früher also hat es abrupten Klimawandel gegeben.
Die Paläoklima-Rekonstruktionen des IPCC verharmlosen diese natürliche Klimavariabilität während der letzten zehntausend Jahre."
Das war natürlich vollkommen unmöglich.
Denn Irrtum und Kritik waren im Drehbuch des IPCC gar nicht vorgesehen.
Selbstbewusst, und dabei ganz unwissenschaftlich, hatte der Inner Circle des Weltklimarats schon lange für sich beschlossen gehabt:
The Science is settled !
...
Zu den Klimarealisten gehören und gehörten viele führende Geowissenschaftler, zum Beispiel der bekannte Meeresgeologe Kenneth Hsü.
Die kalte Sonne (Fritz Vahrenholt & Sebastian Lüning)
2012-08-13 de
Ein Pionier des Klimarealismus: Kenneth Hsü hatte die Wahl und entschied sich richtig
Kenneth Hsü ist ein ganz außergewöhnlicher Geologe.
Als die Geowissenschaften das Land verließen und damit begannen, die Geheimnisse der Ozeanböden zu erkunden, war er in führender Funktion mit dabei.
Hsü nahm im Laufe seiner Karriere an fünf wissenschaftlichen Ozeanbohrkampagnen teil die ihn in den Südatlantik, das Schwarze Meer und das Mittelmeer führten.
Während seiner Laufbahn veröffentlichte Hsü mehr als 400 Arbeiten, darunter auch das bekannte populärwissenschaftliche Werk Das Mittelmeer war eine Wüste, in dem er seine Arbeiten über die Austrocknung des Mittelmeers vor 6 Millionen Jahren einer breiten Öffentlichkeit vorstellte.
Hsü wurde 1967 zum Professor für Geologie an die ETH Zürich berufen und baute dort bis zu seiner Emeritierung gleich fünf international anerkannte Labore auf.
Eines dieser Labore beschäftigte sich mit der Paläoklimatologie, also der historischen Entwicklung des Klimas.
Im Laufe seiner Karriere diente Hsü den Geowissenschaften u.a. als Präsident der Internationalen Sedimentologen-Vereinigung (IAS), leitete mehrere internationale geologische Korrelationsprojekte der UNESCO, fungierte als Vorsitzender der Internationalen Kommission für marine Geologie, saß dem Komitee für Sedimentologie der Internationalen Union für geologische Wissenschaften vor und war Mitglied der schweizerischen Kommission der UNESCO.
Für seine wissenschaftlichen Verdienste wurde Hsü mit zahlreichen wissenschaftlichen Preisen ausgezeichnet, darunter die Twenhofel-Medaille, die Wollaston-Medaille und die Penrose-Medaille.
Über viele Jahrzehnte gehörte Kenneth Hsü zu den führenden Persönlichkeiten seiner Disziplin sowie den Naturwissenschaften. Man schätzte seine Forschung und sein wissenschaftliches Urteil, legte großen Wert auf seine geologischen Einschätzungen.
Im Jahre 1994 wurde er an der ETH emeritiert und nahm im Anschluss eine Reihe von Gastprofessuren an verschiedenen Universitäten verstreut über den Globus an.
Während dieser Zeit, im Jahr 2000, schrieb er ein weiteres wichtiges Buch, in dem er Zivilcourage zeigt und etwas ausspricht, was sich viele andere nicht getraut haben und sich heute noch nicht trauen.
Kenneth Hsü hatte damals den Mut über den Klimawandel zu schreiben und die gängige Klimakatastrophentheorie anzuzweifeln.
Er war sich darüber bewusst, dass er sich damit Ärger einhandeln würde.
Aber er hatte die Fehlentwicklung deutlich erkannt und fühlte sich vor allem seinem Gewissen verpflichtet.
Als Paläoklimatologe kannte er die Klimaentwicklung der letzten 10.000 Jahre wie kein anderer.
Er wusste von den zyklischen Mustern der Temperaturgeschichte, die sich synchron zur Entwicklung der Sonnenaktivität bewegten.
Hsü hatte den geologischen Kontext der vorindustriellen Zeit klar vor Augen und hatte erkannt, dass die Klimaerwärmung des 20. Jahrhunderts nichts weiter war als eine logische Fortsetzung des natürlichen Klimazyklus.
Wer sollte es den Leuten erklären, wenn nicht er, der ausgewiesene und anerkannte Experte für das Klima der Vergangenheit?
...
Die Berliner Mauer hatte knapp 30 Jahre Bestand, bevor sie wieder eingerissen wurde.
Wie lange wird es wohl noch dauern, bis der Klimaalarm in sich zusammenbricht?
↑ de Verzeichnis en Contents fr Sommaire
Analysis of the sun's varying activity in the last two millennia indicates that contrary to the IPCC's speculation about man-made global warming as high as 5.8° C within the next hundred years, a long period of cool climate with its coldest phase around 2030 is to be expected.
⇧ de Abbildungen en Figures fr Figures
↑ de Text en Text fr Texte
⇧ 2003
2003-12-22 en
New ENSO Forecasts Based on Solar Model
Dr Theodor Landscheidt
Schroeter Institute for Research in Cycles of Solar Activity
Klammerfelsweg 5, 93449 Waldmuenchen, Germany
1. Introduction
Anomalous warming (El Nińo) or cooling (La Nińa) of surface water in the eastern equatorial Pacific occurs at irregular intervals (2 to 7 years) in conjunction with the Southern Oscillation (SO), a massive seesawing of atmospheric pressure between the south-eastern and the western tropical Pacific.
The coordinated El Nińo/Southern Oscillation phenomenon (ENSO), also including La Nińa, is the strongest source of natural variability in the global climate system.
Anomalies in the global temperature (positive or negative deviations from a defined mean temperature) are primarily driven by ENSO events (Peixoto and Oort, 1992).
...
2003-05-19 en
New ENSO Forecasts Based on Solar Model
Dr Theodor Landscheidt
Schroeter Institute for Research in Cycles of Solar Activity
Klammerfelsweg 5, 93449 Waldmuenchen, Germany
1. Increase in El Nińo intensity in recent decades?
Since 1976, El Nińo episodes have been more frequent and stronger than in previous decades and La Nińas have become rare exceptions (Trenberth and Hurrell, 1994).
Sea surface temperatures in the central and equatorial Pacific have remained anomalously high and precipitation has been low in areas where dry conditions usually accompany El Nińo events as in Indonesia and north-east Australia.
Especially the consistently negative Southern Oscillation Index (SOI) since 1989 seems to be unusual when compared with observations in previous decades.
Trenberth and Hoar (1996) state that there has been no period in the last 120 years with such high El Nińo intensity.
They conclude from a statistical model fitted to the 1882 to 1981 data that the 1990 to 1995 spell of El Nińo activity had a probability of natural occurrence of about one in 2000 years.
As could be expected, they intimate that man-made global warming is to blame.
An analysis of historical data going back to the 16th century shows that this judgement is not tenable.
Quinn, Neal, and Atunez de Máyolo (1987) have published a historical chronology of El Nino events covering the period 1525-1987.
It is essentially based on records of anomalous rainfall in northern Peru.
The data are in good agreement with documented historical records elaborated by Ortlieb (2000).
Five years after the first publication, Quinn (1992) published a slightly corrected chronology which is available on-line (JISAO, 2003).
This investigation is based on it.
The Quinn Index 1525 to 1987 assigns to each year of the list a value taken from seven categories ranging from 0 (neutral or cold) to 6 (very strong).
I transformed the observed data after 1987 to extend the index to the year 2000.
I made use of the data only from 1530 onwards to get 47 complete decades.
For each of these decades I computed the mean of the 10 Quinn values to measure the frequency and severity of the El Nińo episodes within the respective decade.
Figure 1 shows the result.
The data were subjected to 3-point Gaussian kernel smoothing.
The data points fall at the middle of the respective decade. It can be seen that the peak in recent years is not higher than the previous outstanding peaks around 1570 and 1880.
A least squares straight line fit yields a slightly ascending trend that is nearly horizontal.
This kind of fit, however, is not robust with regard to errors.
The trend line plotted in Figure 1 is robust as it is based on least trimmed squares.
It shows a slightly descending trend.
In both cases, the respective trend is far from being statistically significant.
The El Nińo variations of recent decades do not go beyond the natural level observed in the last five hundred years.
Accordingly, even the IPCC author Schönwiese (1994) did not find a rising trend in the El Nińo data.
4. Outlook
Contrary to the vague "storylines" the IPCC publicizes to speculate about man-made global warming as high as 5.8° C by 2100, the forecast presented here is based on data covering half a millenium.
There is a theoretical background, but the forecast does not rely on it.
The reliability of the involved solar motion cycles has been checked by 13 well-documented long-range forecasts of diverse climate phenomena that turned out correct without exception (Landscheidt, 1983-2003).
Pertinently, this includes the last three El Nińos.
I have been told by IPCC adherents that there is nothing special about correctly forecasting El Nińo events.
They cited the report of Kerr (1998) in Science entitled "Models win big in forecasting El Nińo."
Landsea and Knaff (2000), who employed a statistical tool to evaluate the skill of twelve state-of-the-art climate models in real-time predictions of the development of the 1997-1998 El Nińo, found however that the models exhibited essentially no skill in forecasting the event at lead times ranging from 0 to 8 months.
It should be noted that my last rather precise El Nińo forecast, exclusively based on solar activity, was made more than three years before the event (Landscheidt, 2002).
When dealing with an utterly complex system like climate, there is no other way to check hypotheses than by non-trivial forecast experiments.
So this further long-range climate forecast solely based on solar activity may serve as a touchstone of the IPCC's claim that since 1950 or at least in recent decades the Sun's variable activity has practically had no effect on climate change.
...
Bourabai.narod.ru
2003 en
New Little Ice Age Instead of Global Warming?
Dr. Theodor Landscheidt
Schroeter Institute for Research in Cycles of Solar Activity,
Klammerfelsweg 5, 93449 Waldmuenchen, Germany
Abstract
Analysis of the sun's varying activity in the last two millennia indicates that contrary to the IPCC's speculation about man-made global warming as high as 5.8° C within the next hundred years, a long period of cool climate with its coldest phase around 2030 is to be expected.
It is shown that minima in the 80 to 90-year Gleissberg cycle of solar activity, coinciding with periods of cool climate on Earth, are consistently linked to an 83-year cycle in the change of the rotary force driving the sun's oscillatory motion about the centre of mass of the solar system.
As the future course of this cycle and its amplitudes can be computed, it can be seen that the Gleissberg minimum around 2030 and another one around 2200 will be of the Maunder minimum type accompanied by severe cooling on Earth.
This forecast should prove skillful as other long-range forecasts of climate phenomena, based on cycles in the sun's orbital motion, have turned out correct as for instance the prediction of the last three El Nińos years before the respective event.
...
Fig. 4
Contrary to the curve in Fig. 3, representing the steadily increasing amount of carbon dioxide in the atmosphere, the thin solar curve covaries with the undulations of observed temperature.
...
Fig. 8
...
2003 en
Long-range forecast of U.S. drought based on solar activity
Dr Theodor Landscheidt
Schroeter Institute for Research in Cycles of Solar Activity
Klammerfelsweg 5, 93449 Waldmuenchen, Germany
1. Introduction
Drought occurs if there is lack or insufficiency of rain for an extended period which causes a considerable hydrologic imbalance and, consequently, water shortages, crop damage, streamflow reduction, and depletion of groundwater and soil moisture.
Drought is the most serious physical hazard to agriculture.
In the U.S., the "dust bowl" droughts of the 1930s and 1950s are the most severe examples of the devastating effect of extended periods of dryness.
In the 1930s, drought virtually covered the entire Plains for almost a decade.
Many crops were damaged by deficient rainfall, high temperatures, high winds, insect infestations, and dust storms.
The resulting agricultural depression contributed to the Great Depression's bank closures, business losses, and increased unemployment.
These hardships sent economic and social ripples throughout the country.
Millions of people migrated from the drought areas in search of work, which resulted in conflicts between the newcomers and the longer-established residents and overburdened relief and health agencies.
Understandably, such conditions were a strong motive for monitoring, mitigating, and predicting drought.
Diverse drought indices have been developed and the National Drought Mitigation Center (NDMC) offers advice in planning for drought.
NOAA's Climate Prediction Center and the U.S. Drought Monitor as well as many other institutions publish assessments of the current conditions and seasonal outlooks.
The immediate cause of drought is the predominant sinking motion of air that results in compressional warming or high pressure, which inhibits cloud formation and results in less precipitation.
Prolonged droughts occur when large-scale anomalies in atmospheric circulation patterns persist for months, seasons, or even longer.
The extreme drought that affected the Unites States and Canada during 1988 was caused by the persistence of a large-scale circulation anomaly.
There are many variables that may cause such anomalies: air-sea interactions, soil moisture, land surface processes, topography, internal dynamics, and the accumulated influence of dynamically unstable synoptic weather systems at the global scale.
According to the National Drought Mitigation Center (2003), even scientists making use of General Circulation Models are no match for this complexity.
They do not know how to predict drought a month or more in advance for most locations.
Especially in the extra-tropical regions, current long-range forecasts are of very limited reliability.
In the tropics, empirical relationships have been found between precipitation and ENSO events, but few such teleconnections have been confirmed above latitude 30° N.
...
So, there is hope of a more detailed cause and effect explanation as soon as the still rudimentary theories of solar activity and climate change reach a more mature stage of development.
Anyway, the correct forecast of the U.S. drought beginning in 1999 and a dozen of further successful climate forecasts, exclusively based on solar activity, show already now that the IPCC's claim that there has only been a negligible solar effect on climate change in recent decades is not tenable.
Ironically, just drought, the greatest threat attributed to alleged man-made global warming, has turned out to be regulated by variations in the sun's eruptional activity.
Postscript by John L. Daly:
Dr Theodor Landscheidt claimed several times in the above paper that he had successfully predicted key climatic events (such as the current El Nińo) years before the actual events, making reference to papers currently archived on this website and to other papers he has published elsewhere.
I can certify that the papers he refers to were indeed published on this site on the dates indicated and that his forward predictions made on this website to events that have now already happened were indeed made well ahead of their time, just as he says they were.
In particular, he predicted the current El Nińo 3˝ years in advance, in a paper published on this website in January 1999.
I can therefore fully confirm the authenticity of that prediction, as can the many expert reviewers who participated in the subsequent open review in 1999.
John L. Daly, proprietor of `Still Waiting for Greenhouse'
2003 en
Decadal-Scale NAO Forecast Based on Solar Motion Cycles
Dr Theodor Landscheidt
Schroeter Institute for Research in Cycles of Solar Activity
Klammerfelsweg 5, 93449 Waldmuenchen, Germany
1. Introduction
The North Atlantic Oscillation (NAO) refers to swings in the atmospheric sea level pressure differences between the Arctic and the subtropical Atlantic.
It exerts a strong control on winter climate in Europe, North America, and Northern Asia.
The NAO index is defined as the normalized pressure difference between measurements of stations on the Azores and Iceland.
A positive NAO index indicates a stronger than usual subtropical high pressure center and a deeper than normal Icelandic low.
The increased pressure difference results in more and stronger winter storms crossing the Atlantic Ocean on a more northerly track.
This results in warm and wet winters in Europe and cold and dry winters in Greenland and Northern Canada, while the eastern Unites States experience mild and wet winter conditions.
A negative NAO index points to a weak subtropical high and a weak Icelandic low. The reduced pressure gradient results in fewer and weaker winter storms crossing mostly on west-east paths bringing moist air into the Mediterranean and cold air to Northern Europe.
The east coast of the United States gets more cold air and snow while Greenland enjoys mild winters (Hurrell, 1995).
...
⇧ 2002
2002-03-18 en
El Nińo Forecast Revisited
Dr Theodor Landscheidt
Schroeter Institute for Research in Cycles of Solar Activity
Belle Côte, Nova Scotia, Canada
1. Background of ENSO Forecast
On 11 January 1999, my paper "Solar Activity Controls El Nińo and La Nińa" was published on this web site.
It included a forecast of the next El Nińo around 2002.9 (End of November 2002).
As this date is approaching, it seems to be in order to give a short delineation of the background of this forecast for those readers who are interested in an explanation of the general concept, but shun technical details.
This all the more so as there are first indications that an El Nińo is in the making.
My forecast is exclusively based on cycles of solar activity.
This does not conform to the dominating trend in official science.
The Third Assessment Report, published by the Intergovernmental Panel on Climate Change (IPCC), continues to underestimate the Sun's role in climate change:
"Solar forcing is considerably smaller than the anthropogenic radiative forcings", and its "level of scientific understanding" is "very low", whereas forcing by well-mixed greenhouse gases "continues to enjoy the highest confidence level" as to its scientific understanding.
The Third Report considers it "unlikely that natural forcing can explain the warming in the latter half of the 20th century."
There are also frequent assertions in the literature that there was only a negligible effect of solar activity on temperature in recent decades.
...
2. Effect of solar eruptions on climate stronger than variations in irradiance
The IPCC's judgement is based on the observation that the Sun's irradiance changes only by about 0.1 percent during the course of the 11-year sunspot cycle.
It turns out to be untenable when the Sun's eruptional activity (energetic flares, coronal mass ejections, eruptive prominences) as well as solar wind contributions by coronal holes are taken into consideration.
The total magnetic flux leaving the Sun, dragged out by the solar wind, has risen by a factor of 2.3 since 1901 (Lockwood et al., 1999), while concomitantly global temperature increased by about 0.6°C.
The energy in the solar flux is transferred to the near-Earth environment by magnetic reconnection and directly into the atmosphere by charged particles.
...
⇧ 2001
2001 en
Trends in Pacific Decadal Oscillation Subjected To Solar Forcing
Dr Theodor Landscheidt
Schroeter Institute for Research in Cycles of Solar Activity
Belle Côte, Nova Scotia, Canada
Introduction
The Pacific Decadal Oscillation (PDO) is a long-lived ENSO-like pattern of Pacific climate variability (Tanimoto et al., 1993; Zhang et al., 1997).
ENSO (El Nińo/La Nińa + Southern Oscillation) and PDO have similar spatial and temperature patterns, but show a different behaviour in time.
While ENSO events are inter-annual phenomena, the PDO covers decades.
A full oscillation, comprising a warm and a cool phase, may extend over more than 50 years.
...
Outlook
In this early stage of development of a completely new interdisciplinary approach it cannot be expected that there is a detailed physical explanation of the results, especially as the fields of solar activity and climate change have not yet reached the stage of full-fledged theories and the causes of the PDO are still unknown.
As to first tentative explanations of the connection between solar eruptions on the one hand and the related oscillations ENSO and NAO on the other I refer to earlier publications (Landscheidt, 1999 a, 2000 a).
Forecast experiments are the best way to check whether science is sound.
Such forecasts are available for the next crucial phases in the course of the PDO around 2007 (Coolest period in a cool regime) and 2016 (Regime shift from cold to warm).
Wait and see will be the procedure in the second part of the experiment.
...
2001 en
Solar Eruptions Linked to North Atlantic Oscillation
Dr Theodor Landscheidt
Schroeter Institute for Research in Cycles of Solar Activity
Belle Côte, Nova Scotia, Canada
Introduction
Introduction
The North Atlantic Oscillation (NAO) is one of the major modes of variability of the Northern Hemisphere atmosphere.
It is a large scale see-saw in atmospheric mass between the subtropical high and the polar low exerting a strong control on winter climate in Europe, North America, and Northern Asia.
The NAO index is defined as the normalized pressure difference between stations on the Azores and Iceland.
A positive NAO index indicates
indicates a stronger than usual subtropical high pressure center
and a deeper than normal Icelandic low.
The increased pressure difference results in more and stronger winter storms crossing the Atlantic Ocean on a more northerly track.
This results in warm and wet winters in Europe
and cold and dry winters in Greenland and Northern Canada,
while the eastern United States experiences mild and wet winter conditions.
A negative NAO index
points to a weak subtropical high and a weak Icelandic low.
The reduced pressure gradient results in fewer and weaker winter storms crossing mostly on west-east paths bringing moist air into the Mediterranean
and cold air to Northern Europe.
The east cost of the United States gets more cold air and snow while Greenland enjoys mild winters (Hurrell, 1995 ).
After ENSO, the NAO is one of the most dominant modes of global climate variability.
Like El Nińo, La Nińa, and the Southern Oscillation, it is considered a free internal oscillation of the climate system not subjected to external forcing.
It is shown, however, that it is closely linked to energetic solar eruptions.
Surprisingly, it turns out that features of solar activity that have been shown to be related to El Nińos and La Nińas (Landscheidt, 1999 a, 2000 a), also have an impact on the NAO.
...
Outlook
Taken together, the presented lines of evidence leave little doubt that there is a solid link between solar eruptions, eruptive phases in the 11-year sunspot cycle, zero phases and extrema in the solar motion cycle formed by | dL/dt |, and extrema in the NAO data.
This opens up new vistas of research, as it has been a tenet of climatology that the Northern Atlantic Oscillation is an internal process in the atmosphere-ocean system not subjected to external forcing.
Moreover, the results show clearly that contrary to statements of the IPCC and assertions in the literature (Tett et al., 1999) solar forcing on climate phenomena did not fade away in recent decades.
Predictability is one of the corner stones of science.
The predictive potential of the upshot is obvious, though the patterns are not as stable as the patterns that make it possible to predict ENSO events.
An explanation could be that El Nińo and La Nińa develop in an environment with a much higher energy potential.
Admittedly, the mechanisms that create such strong solar forcing remain poorly understood in detail.
Yet this situation is not new in the history of science.
Epistemologically, the stages of gathering data, establishing morphological relationships, and setting up working hypotheses necessarily precede the stage of elaborated theories.
We are able already to discern simple underlying patterns in a seemingly impenetrable thicket of data without correlations.
If the fields of solar activity and climatic change shape well and develop into full-fledged theories, it is conceivable that the semi-quantitative model presented here will be better understood in the new theoretical environment.
The present results are only first tentative steps in a new direction. There are many problems that can only be solved by a joint interdisciplinary effort of open-minded scientists.
⇧ 2000
2000 en
New Confirmation of Strong Solar Forcing of Climate
Dr Theodor Landscheidt
Schroeter Institute for Research in Cycles of Solar Activity
Belle Côte, Nova Scotia, Canada
The IPCC stated in Climate Change 1995 that "forcing due to changes in the Sun's output over the past century has been considerably smaller than anthropogenic forcing."
Estimates shown in a figure allotted about 10% to solar forcing and 90% to forcing due to human greenhouse gas contributions.
IPCC's draft of the Third Assessment Report (TAR 2000) continues attributing to the Sun a minor role in climate change.
According to the expert review "the temporal evolution indicates that the net natural forcing (solar and volcanic aerosol) has been negative over the past two and possibly even the past four decades."
The estimate of solar forcing remains the same as in Climate Change 1995:
It is "considerably smaller than the anthropogenic radiative forcings", and its "level of scientific understanding" is "very low", whereas forcing by well-mixed greenhouse gases "continues to enjoy the highest confidence level" as to its scientific understanding.
Everything taken together, TAR 2000 considers it "unlikely that natural forcing can explain the warming in the latter half of this century."
...
2000 en
Solar Wind Near Earth: Indicator of Variations in Global Temperature
Dr Theodor Landscheidt
Schroeter Institute for Research in Cycles of Solar Activity
Abstract
Near-Earth variations in the solar wind, measured by the geomagnetic aa index since 1868, are closely correlated with global temperature (r = 0.96; P < 10-7). Geomagnetic activity leads temperature by 4 to 8 years.
Allowing for this temperature lag, an outstanding aa peak around 1990 could explain the high global temperature in 1998.
After 1990 the geomagnetic aa data show a steep decline comparable to the decrease between 1955 and 1967, followed by falling temperatures from 1961 through 1973 in spite of growing anthropogenic CO2 emissions.
This points to decreasing global temperature during the next 10 years.
Introduction
The total magnetic flux leaving the Sun, dragged out by the solar wind, has risen by a factor of 2.3 since 1901 (Lock-wood et al, 1999).
Concomitantly, global temperature has increased by 0.5° C.
The energy in the solar flux is transferred to the near-Earth environment by magnetic reconnec-tion and directly into the atmosphere by charged particles.
There are indications that this energy has meteorological effects within days after solar eruptions which generate highspeed streams in the solar wind (Roberts and Olson, 1973; King, 1974; Stolov and Shapiro, 1974; Schuurmans, 1979; Prohaska and Willett, 1983; Neubauer, 1983; Bucha, 1983; Herman and Goldberg, 1985; Tinsley, 1996).
As there is a linear relationship between magnetic flux and solar irradi-ance, the 130% rise in the Sun's magnetic flux since 1901 indicates a rise in the average total solar irradiance of 1.65 W m-2 (Lockwood and Stamper, 1999).
The respective radiative forcing in the atmosphere is 0.29 W m-2, corresponding to 0.23° C at a moderate climate sensitivity of 0.8° C/W m-2.
This increase of 0.23° C potentially accounts for nearly half of the change in the Earth's global temperature over the same period.
Charged particles and indirect solar wind effects make a strong additional contribution.
Svensmark and Friis-Christensen (1997) have shown that global cloud cover, observed by satellites, is linked to the strength of galactic cosmic rays modulated by the solar wind (r = 0.95).
This effect, attributed to cloud seeding by ionized secondary particles (Pruppacher and Klett, 1997), induced a change in cloud cover by more than 3% within 3 Vi years.
The corresponding change in radiative forcing is in the range 0.8 tol.7 W m-2.
This is significant, as the total radiative forcing by CO, accumulated in the atmosphere since pre-industrial times is about 1.5 W m-2.
Measurements of cosmic ray flux registering myons instead of neutrons go back to 1937.
When Svensmark (1998) compared these data with temperature in the Northern Hemisphere, his results were corroborated.
Short-term observations confirm the connection.
Forbush decreases - sudden deep drops in cosmic ray flux within 2 days after energetic solar eruptions - coincide with local shrinking of cloud cover by 3% (Pudovkin and Veretenenko (1995).
In the long run, climate would not be affected if the amplitude of the indirect solar wind effect on clouds did not change.
The strength of the solar wind, however, has increased by a factor of 2.3 since 1901.
Direct and indirect effects, taken together, point to a dominant role of solar activity in climate change.
Accordingly, many of the recent publications in the field of solar-terrestrial relationships range the Sun's contribution between 50 and 100 % (Friis-Christensen and Lassen, 1991; Lean et al., 1995; Lau and Weng, 1995; Landscheidt, 1995; Soon et al., 1996; Svensmark and Friis-Christensen, 1997; Reid, 1997; White et al., 1997; Svensmark, 1998; Cliver et al. 1998 a, b; Labitzke, 1999).
...
2000 en
Sun's Role in the Satellite-Balloon-Surface Issue
Dr Theodor Landscheidt
Schroeter Institute for Research in Cycles of Solar Activity
Belle Côte, Nova Scotia, Canada
There has been an unending discussion about why temperatures measured by satellites and balloon sondes, progressing almost in lockstep on a trend line close to the horizontal, diverge from surface temperatures that show, at least in the last decade, a steep warming trend.
The figure below shows the course of the anomalies in the three data sets which are referenced to a common zero point in 1979 - the beginning of the satellite measurements - to show the subsequent comparative trends.
This presentation follows the design of the "World Climate Report" chart.
New is the relationship with the Sun's eruptional activity which forms a pattern fully conforming with the balloon and satellite data, but only to a certain degree with the surface temperatures.
...
⇧ 1999
1999-09-13 en
Extrema in Sunspot Cycle linked to Sun's Motion
Theodor Landscheidt
(Received 21 May 1999; accepted 13 September 1999)
Abstract
Partitions of 178.8-year intervals between instances of retrograde motion in the Sun's oscillation about the center of mass of the solar system seem to provide synchronization points for the timing of minima and maxima in the 11 -year sunspot cycle.
In the investigated period 1632-1990, the statistical significance of the relationship goes beyond the level P = 0.001.
The extrapolation of the observed pattern points to sunspot maxima around 2000.6 and 2011.8.
If a further connection with long-range variations in sunspot intensity proves reliable, four to five weak sunspot cycles (R < 80) are to be expected after cycle 23 with medium strength (R ~ 100).
1. Introduction
Since the discovery of the 11 -year sunspot cycle by Schwabe in 1843 astronomers and astrophysicists have tried to explain how this fundamental cycle and its complex magnetic features come into existence.
The switch of polarity in sunspot dipoles around the sunspot minimum shows that the 11-year cycle is actually half of a 22-year magnetic cycle (Hale cycle), during which the polarity of sunspot groups reverses twice, hence returning to its original magnetic state.
Babcock's dynamo model relates the dynamics of the 22-year magnetic cycle to the Sun's rotation on its axis.
The interaction of differential rotation, the polar magnetic field, and convection in the solar plasma is thought to cause dynamo action that generates the sunspot cycle by magnetic field amplification.
So it should be expected that variations in the Sun's rotation rate are reflected in the level of sunspot activity.
Accordingly, Clark et al. (1979) showed that in 1957, when the sunspot activity was nearly three times more intense than in 1884, the rotation in the sunspot zone took half a day longer than in 1884.
...
⇧ 1998
1998 de
Sonnenaktivität als dominanter Faktor der Klimadynamik
Dr Theodor Landscheidt
Schroeter-Institut zur Erforschung der Zyklen der Sonnenaktivität,
Nova Scotia, Kanada
↑
Kapitel 1
de
Variationen der "Solarkonstanten" im 11-jährigen Sonnenfleckenzyklus
und klimatische Auswirkungen
de
Variationen der "Solarkonstanten" im 11-jährigen Sonnenfleckenzyklus
und klimatische Auswirkungen
Dr Theodor Landscheidt
Schroeter-Institut zur Erforschung der Zyklen der Sonnenaktivität,
Nova Scotia, Kanada
Die atmosphärische Zirkulation, die Ursache des Wetters, wird von der eingestrahlten Sonnenenergie angetrieben.
Klima ist das Integral des Wetters über einen längeren Zeitraum.
Es hängt ebenfalls vom Fluss der Sonnenenergie ab.
Dies gilt auch für Änderungen des Energieflusses, die mit der variablen Sonnenaktivität zusammenhängen.
Nach Satellitenmessungen steht fest, dass die Solarkonstante S nicht konstant ist.
Die von der Sonne ausgestrahlte Energie verringerte sich vom Sonnenfleckenmaximum 1979 bis zum Minimum 1986, stieg auf dem Wege zum nächsten Maximum des 11-jährigen Sonnenfleckenzyklus wieder an und verringerte sich erneut in der absteigenden Phase des Zyklus.
Dies war eine Überraschung, da plausibel ist, dass die dunklen Sonnenflecken mit ihren starken Magnetfeldern den freien Fluss der Energie vom Sonneninneren nach aussen behindern.
P.V. Foukal und J. Lean [22 ] haben jedoch gezeigt, dass sich die hellen Fackeln in der Umgebung der Sonnenflecken bei ansteigender Aktivität noch stärker vermehren als die Sonnenflecken, so dass es zu einem Überschuss der abgestrahlten Energie kommt.
Wissenschaftler des IPCC gehen davon aus, dass die entsprechende Veränderung der Solarkonstanten (delta S) kleiner als 0,1% ist und deshalb keine klimatischen Auswirkungen haben kann, die gegenüber dem Treibhauseffekt ins Gewicht fallen [94].
Dabei verkennen sie jedoch, dass die Fachliteratur, soweit sie einen Wert von 0,1% zitiert, darunter die absolute Amplitude der sinusförmigen Veränderung der Solarkonstanten versteht [25, 32, 39] und nicht die gesamte Veränderung vom Minimum zum Maximum oder vom Maximum zum Minimum.
...
↑
Kapitel 2
de
Gleissberg-Zyklus der Sonnenaktivität und Klimaschwankungen
Dr Theodor Landscheidt
Schroeter-Institut zur Erforschung der Zyklen der Sonnenaktivität,
Nova Scotia, Kanada
1998 de
Gleissberg-Zyklus der Sonnenaktivität und Klimaschwankungen
Dr Theodor Landscheidt
Schroeter-Institut zur Erforschung der Zyklen der Sonnenaktivität,
Nova Scotia, Kanada
Sieben Jahre sind, wenn es um das Klima geht, eine relativ kurze Zeit.
Ein Klimaeffekt durch die variierende Strahlung der Sonne ist um so wirksamer, je länger er auf die Erdatmosphäre einwirkt.
Nach der Milankovich-Theorie in ihrer modernen Form reicht schon eine lang ausgedehnte Strahlungsschwankung von 0,1% aus, um regelrechte Eiszeiten auszulösen [49].
Es ist hiernach zu erwarten,
dass der 90-jährige Gleissberg-Zyklus der Sonnenfleckentätigkeit, der die Intensität der 11-jährigen Zyklen moduliert,
über ein beträchtliches Akkumulationspotential verfügt,
das im Laufe von Jahrzehnten zur Entwicklung eines klimawirksamen Strahlungsüberschusses oder einer ständigen Absenkung des Strahlungsniveaus führt,
zumal die Länge des Zyklus 120 Jahre erreichen kann [58].
...
Abb. 3
...
Die Wissenschaftler, die in den achtziger Jahren die Laienbürger mit haltlosen Katastrophenvorhersagen beunruhigten, können nicht sagen, dass es zu dieser Zeit noch keine Hinweise auf einen ernstzunehmenden Einfluss der Sonnenaktivität auf das Klima gegeben habe.
...
Schon 1982 habe ich auf dieser Grundlage angekündigt, dass nach 1990 nicht mit einer globalen Erwärmung, sondern mit absinkenden Temperaturen zu rechnen sei, und in den Jahrzehnten um 2030 sogar mit einer neuen "Kleinen Eiszeit".
In weiteren Arbeiten habe ich diese Vorhersage präzisiert [58, 59, 63].
Nach der Entdeckung der Variabilität der Sonnenkonstanten S sind phänomenologische Regressionsmodelle entwickelt worden, welche die Schwankungen der Strahlungsintensität der Sonne in zurückliegenden Jahrzehnten und Jahrhunderten abschätzen.
Abb. 5:
...
↑
Kapitel 3
de
Variation der ultravioletten Strahlung der Sonne und Klimamodelle
Die Variationen der ultravioletten Strahlung der Sonne sind sehr viel stärker als die im sichtbaren Bereich.
Der ultraviolette Bereich des Spektrums liegt zwischen 100 Ĺ und 3800 Ĺ.
Wellenlängen unter 1500 Ĺ werden als extremes Ultraviolett (EUV) bezeichnet.
Die Veränderung der Strahlung zwischen den Extrema des 11-jährigen Zyklus beträgt beim EUV 35% [119], bei 1500 Ĺ 20 % [21] und im Bereich von 2050 Ĺ 7% [34, 97].
Bei Wellenlängen über 2500 Ĺ erreicht die Veränderung immerhin noch 2% [21].
Bei energetischen Sonneneruptionen erhöht sich die UV-Strahlung vorübergehend um 16% Die EUV steigert zur Zeit des 11-jährigen Maximums die Temperatur in der Ionosphäre um 300% gegenüber dem Minimum [21].
Am wichtigsten ist aber, dass die ultraviolette Strahlung unter 2900 Ĺ vollständig durch das Ozon in der Stratosphäre absorbiert wird.
Die hierdurch bewirkte Temperaturerhöhung wird durch positive Rückkopplung verstärkt, da die UV-Strahlung zugleich neues Ozon erzeugt.
Satelliten haben ein Anwachsen des Ozongehalts um 2% vom Fleckenminimum zum Maximum gemessen [113].
D. Rind und J. Overpeck arbeiten mit Hilfe von Klimamodellen an einer Erklärung, wie die Erwärmung der Stratosphäre die Zirkulation in der Troposphäre beeinflusst.
J.D. Haigh [29] hat bereits quantitativ die Auswirkungen auf die Strahlungsbilanz der Troposphäre ermittelt und gezeigt, dass sie vor allem die Temperatur in den Subtropen und den Verlauf von Sturmbahnen im Nordatlantik beeinflussen.
Veränderungen der Strahlung
Veränderungen der Strahlung sind nicht der einzige Weg, auf dem die Sonne das Klima beeinflussen kann.
Zwischen energetischen Sonneneruptionen, dem Sonnenwind und der von ihm modulierten kosmischen Strahlung einerseits und elektrischen Parametern der Atmosphäre andererseits gibt es Kopplungen, deren Stärke im Verlauf von Tagen, Jahren und Dekaden Variationen von 10% unterworfen ist [113].
Am stärksten ist der Zusammenhang mit der Dichte des luftelektrischen Vertikalstroms zwischen Ionosphäre und Erdoberfläche.
R. Markson und M. Muir [71] haben gezeigt, wie sich dies auf die Gewittertätigkeit auswirkt, während B. A. Tinsley [113] davon ausgeht, dass elektrisch bewirkte Änderungen in der Mikrophysik der Wolken (electrofreezing) zur Erhöhung der Enstehungsrate von Gefrierkernen und vermehrter Wolkenbildung führen.
Diese Ansätze haben den Vorzug, dass sie keine dynamische Kopplung zwischen den verschiedenen Atmosphäreschichten erfordern, da Änderungen des elektrischen Feldes die gesamte Atmosphäre erfassen.
Soweit von IPCC-Wissenschaftlern geltend gemacht wird, dass es bisher keinerlei pysikalische Erklärungen für einen Einfluss der Sonnenaktivität auf Klimaschwankungen gebe, trifft dies schon nach den bisher angeführten Ergebnissen nicht zu.
↑
Kapitel 4
de
Kosmische Strahlung, Sonnenwind und Wolkenausbreitung
Das stärkste Argument für einen durchgreifenden Einfluss der Sonnenaktivität auf Wetter und Klima ist jedoch ein unmittelbarer Zusammenhang zwischen Wolkenausbreitung und kosmischer Strahlung, den H. Svensmark und E. Friis-Christensen [111] 1996 entdeckt haben.
Er ist in Abb. 6 dargestellt.
...
Die Entdeckung von Svensmark und Friis-Christensen zeigt im übrigen, dass der Einwand des IPCC, exogene Faktoren seien energetisch viel zu schwach, um die globale Temperatur zu beeinflussen, in die falsche Richtung weist.
Die Natur gibt eine eindeutige Antwort.
Die kosmische Primärstrahlung, welche die Wolkenausbreitung reguliert, führt der Erde insgesamt nur eine Energie zu, die der Lichtintensität des nächtlichen Sternhimmels entspricht [23].
J. G. Roederer [95] kommt der Wirklichkeit sehr viel näher als das IPCC indem er bemerkt:
"The energy argument, however, is not valid for highly non-linear, complex systems such as the coupled atmosphere-ocean-cryosphere-biosphere. ...
↑
Kapitel 5
de
Misserfolg der Klimavorhersagen von IPCC-Wissenschaftlern
Differenzierte Vorhersagen, die mit der tatsächlichen Entwicklung übereinstimmen, sind eines der wichtigsten Kriterien effizienter Wissenschaft.
Die Protagonisten einer globalen Erwärmung stehen insoweit trotz eines gewaltigen materiellen und personellen Aufwandes mit leeren Händen da.
In den achtziger Jahren prognostizierte der Fachwissenschaftler S. Schneider vom National Center for Atmospheric Research in Boulder, Colorado, in seinem Buch "Global Warming" für die kommenden Jahrzehnte einen gewaltigen Temperatursprung, abschmelzendes Polareis, die Überschwemmung von weiten Landstrichen, den Zusammenbruch der Ökosysteme und Hungerkatastrophen unerhörten Ausmaßes.
Heute nimmt dies kaum noch jemand ernst.
Aber auch Wissenschaftler, die dem IPCC angehören, haben in den achtziger Jahren Klimavorhersagen gemacht, die sie selbst nicht mehr aufrecht erhalten.
So hielt C. D. Schönwiese [99], der sich im allgemeinen durch eine kritische Haltung und vorsichtige Formulierungen auszeichnet, noch 1987 einen Temperaturanstieg von 4,5° C bis zum Jahre 2030 für möglich, wenn auch als oberen Grenzwert.
Für die Deutsche Bucht sagte er als obere Risikoschwelle 1,5 m für den Anstieg des Meerespiegels bis zum Jahre 2040 voraus und für den indischen Subkontinent sogar 2 - 3 m.
Wird seine Temperaturvorhersage auf das Jahr 2100 hochgerechnet, so ergibt sich ein Grenzwert des Anstiegs von 11,8° C.
Die Villacher Klimakonferenz 1985 kam zu ähnlichen Ergebnissen.
Das IPCC selbst sagte noch 1990 und 1992 eine Erhöhung der Globaltemperatur von 1,9° - 5,2° C bis zum Jahre 2100 voraus [100] und hielt eine Erhöhung des Meeresspiegels um 1,10 m für möglich [36].
Alle diese Vorhersagen haben sich inzwischen als unhaltbar erwiesen. Es ist anerkannt, dass die Globaltemperatur in den letzten hundert Jahren nur um rund 0,5° C gestiegen ist.
Dabei hat sich die Temperatur in den letzten fünfzig Jahren kaum noch erhöht, obwohl in dieser Zeit 70% des anthropogenen Anteils der Treibhausgase in die Atmosphäre gelangt sind.
Von 1940 bis 1970 fielen die Temperaturen, und nach den seit 1979 vorliegenden Satellitendaten, die sehr gut mit Ballondaten übereinstimmen [27], liegt der Trend in der unteren Troposphäre bei -0,06° C pro Dekade.
Die Vorhersage des IPPC aus dem Jahre 1992 erwies sich als so unrealistisch, dass sie schon drei Jahre später auf 1° - 3,5° C bis zum Jahre 2100 reduziert werden musste.
Bei der Erhöhung des Meeresspiegels erkennt das IPCC [36] inzwischen in Übereinstimmung mit einem Konsens der Fachwissenschaftler [3] an, dass der Anstieg in den letzten hundert Jahren nur 18 cm betragen hat.
Nach M. Baltuck et al. [3] ist es sehr wahrscheinlich, dass die Erhöhung des Meeresspiegels in den letzten Jahrhunderten ausschliesslich natürliche Ursachen hatte und nicht durch den anthropogenen Treibhauseffekt beschleunigt wird.
Besonders deutlich tritt der Unterschied zwischen den Vorhersagen des
IPCC und den beobachteten Daten zutage, soweit es um die Erwärmung der polaren Regionen geht.
Die 1990 vom IPCC vorgestellten Allgemeinen Zirkulationsmodelle sagen für die Gebiete in der Nähe der Pole bei einer Verdoppelung des CO2 - Gehalts der Atmosphäre eine Erhöhung der Temperatur von mehr als 12° C voraus [13].
Wäre dies richtig, so hätte sich in den letzten 40 Jahren, in denen das CO2 erheblich angestiegen ist, ein Erwärmungstrend von mehreren Grad Celsius zeigen müssen.
Das Gegenteil ist der Fall [20].
Eine gemeinschaftliche Untersuchung amerikanischer, russischer und kanadischer Wissenschaftler hat für den Zeitraum 1950 bis 1990 ergeben, dass sich die Oberflächentemperaturen der Arktis abgekühlt haben, und zwar im Winter um 4,4° C und im Herbst um 5° C [43].
Auch die Satellitendaten, die seit 1979 zur Verfügung stehen, zeigen keine Erwärmung der polaren Gebiete; in der Antarktis ist ein deutlicher Abkühlungstrend von 0,2° zu erkennen [105].
Hiermit stimmt überein, dass nach den Daten des World Glacier Monitoring Network in Zürich 1990 55% der Gletscher in den hohen Breiten vorrückten gegenüber 6% in der Mitte des Jahrhunderts.
Die Unvereinbarkeit der Vorhersagen des IPCC mit dem beobachteten Klima hängt vor allem damit zusammen, dass die allgemeinen Zirkulationsmodelle, auf die sich die Vorhersagen stützen, zu einem Zweck eingesetzt worden sind, für den sie sich nicht eignen.
Sie sind ein ausgezeichnetes Forschungsinstrument, wenn es darum geht, überschaubare Detailzusammenhänge, deren Physik sich bereits in grober Form abzeichnet, qualitativ und quantitativ auf Änderungen zu untersuchen, die sich bei Variationen der Einflussgrössen ergeben.
Es geht dabei um einen Lernprozess, nicht um weit in die Zukunft reichende Vorhersagen.
Die Entwicklung in dem ungeheuer komplexen nichtlinearen Klimasystem der Erde, in dem Atmosphäre, Ozean, Kryosphäre und Biosphäre wechselseitig gekoppelt sind, lässt sich aber nur, wenn überhaupt, für ganz kurze Zeiträume verfolgen.
Die allgemeinen Zirkulationsmodelle stützen sich auf den gleichen Typ von nichtlinearen Differentialgleichungen, die E. N. Lorenz schon 1961 zu der Einsicht zwangen, dass langfristige Wettervorhersagen wegen der sensiblen Abhängigkeit von den Anfangsbedingungen unmöglich sind.
Bei Klimavorhersagen soll es diesen "Schmetterlingseffekt" aber plötzlich nicht mehr geben, obwohl es nicht um einen Zeitraum von Tagen und Wochen, sondern von Jahrzehnten und Jahrhunderten geht.
Einige IPCC-Klimatologen räumen ein, dass hier ein Problem liegt. C. D. Schönwiese [100] führt insoweit aus:
"Konsequenterweise müssten wir nun den Schluss ziehen, dass sich Klimaänderungen nicht vorhersagen lassen.
Richtig ist an dieser Folgerung nur, dass sich mit Zirkulationsmodellen ... nicht Schritt für Schritt das so vielfältige und komplexe Geschehen der Atmosphäre über die theoretische Grenze von einem Monat hinaus vorhersagen lässt, weder heute noch irgendwann.
Es gibt aber noch die Möglichkeit der bedingten Vorhersage.
Die Bedingung besteht dabei darin, dass möglicherweise eine bestimmte Ursache innerhalb des vielfältigen Ursache-Wirkungs-Komplexes so stark in ihrer Effektivität anwächst, dass sie gegenüber allen anderen Wirkungsmechanismen klar dominiert.
Ausserdem muss das Verhalten dieser einen dominierenden Ursache sicher oder mit hoher Wahrscheinlichkeit vorhersagbar sein."
Bei der "bestimmten Ursache", die hier gemeint ist, handelt es sich um den anthropogenen Treibhauseffekt.
Es ist aber keineswegs erwiesen, dass dieser gegenüber allen anderen Wirkungsmechanismen, die das Klima verändern, eindeutig dominiert.
Die in dieser Arbeit angeführten Ergebnisse sprechen vielmehr dafür, dass die Sonnenaktivität einen viel grösseren Einfluss hat.
Der Treibhauseffekt ist auch nicht sicher oder mit hoher Wahrscheinlichkeit vorhersagbar, wie die zitierten Vorhersagen der IPCC-Wissenschaftler zeigen, die mit der Klimarealität unvereinbar sind.
Insbesondere ist völlig unsicher, wann eine Verdoppelung des CO2-Gehalts der Atmosphäre eintreten wird.
Zu Anfang wurde das Jahr 2030 als Verdoppelungsdatum angesehen.
Jetzt gehen J. P. Peixoto und A. H. Oort [86] von einer Verdoppelung im Jahre 2200 aus.
Es wird weiter unterstellt, dass die Weltbevölkerung, die für den anthropogenen Zuwachs des CO2 verantwortlich ist, bis zum Ende des nächsten Jahrhunderts auf 11,5 Milliarden anwachsen wird.
Wie die von der UNO herausgegebene statistische Übersicht "World Population Prospects:
The 1996 Revision" zeigt, ist diese Zuwachszahl utopisch und muss scharf nach unten korrigiert werden.
1950 - 1955 lag die Fruchtbarkeitsziffer 'die durchschnittliche Zahl der von Frauen geborenen Kinder' weltweit bei fünf.
1975 - 1980 war sie auf vier gesunken.
Jetzt liegt die Fruchtbarkeitsziffer im Weltdurchschnitt bei 2,8, und der Trend zeigt ein schnelles weiteres Sinken an.
In Europa ist die Ziffer in den letzten zehn Jahren um 20% gefallen und liegt jetzt bei 1,4, also weit unter der Bevölkerungserhaltungsrate von 2,1.
Das gleiche gilt für Russland und Japan.
Auch die Entwicklungsländer machen keine Ausnahme.
In Banglasesch ist die Ziffer in der letzten Dekade von 6,2 auf 3,4 gefallen.
Der CO2-Ausstoss wird also in der Zukunft bei weitem nicht so stark zunehmen, wie bisher angenommen.
...
↑
Kapitel 6
de
Zyklen der Sonnenschwingung beeinflussen Sonnenfleckentätigkeit
und Klima
Das IPCC hat eindeutig erklärt: "Solar variability over the next 50 years will not induce a prolonged forcing significant in comparison with the effect of increasing CO2 concentrations."
Nimmt man jedoch im Gegensatz zum IPCC die Sonne als klimabestimmenden Faktor ernst, so eröffnet sich ohne jede Unterstützung durch Supercomputer die Möglichkeit, detaillierte Vorhersagen zu machen, die sich als zutreffend erweisen.
Ich werde hierfür eine Reihe von Beispielen bringen.
Der chaotische Charakter von Wetter und Klima steht solchen Vorhersagen nicht entgegen.
Die empfindliche Abhängigkeit von den Anfangsbedingungen erstreckt sich nur auf Vorgänge innerhalb des Klimasystems. E. N. Lorenz hat betont, dass sich nur nichtperiodische Systeme einer längerfristigen Vorhersage entziehen.
Externe periodische oder quasiperiodische Systeme können durchaus dem Klima ihren Rhythmus aufzwingen.
Dies gilt nicht nur für den periodischen Wechsel von Tag und Nacht oder die Milankovich-Zyklen, sondern auch für Variationen des Energieausstosses der Sonne, soweit sie quasiperiodischer Natur sind.
Der 11-jährige Sonnenfleckenyzklus erfüllt diese Voraussetzung, ist aber, soweit es um Vorhersagen geht, nicht der wichtigste Zyklus.
Maßgeblich sind solare Zyklen, die alle mit der Grundschwingung der Sonne um das Massenzentrum des Sonnensystems zusammenhängen, aber insgesamt ein Fraktal bilden, das Zyklen mit ähnlicher Funktion, aber ganz unterschiedlicher Zykluslänge zu einer Einheit zusammenfasst.
Die von Babcock entwickelte Dynamotheorie, die erste, noch rudimentäre Theorie zur Erklärung der Sonnenaktivität, geht davon aus, dass die Dynamik des magnetischen Sonnenfleckenzyklus von der Rotation der Sonne angetrieben wird.
Dabei wird jedoch nur der Eigendrehimpuls berücksichtigt, der an die Rotation der Sonne um ihre Achse anknüpft, nicht aber der Bahndrehimpuls, der mit der sehr unregelmässigen Bahnbewegung der Sonne um das Massenzentrum des Planetensystems zusammenhängt.
Abb. 7
↑
Kapitel 7
de
Zyklus von 36 Jahren in Sonnenaktivität und Klima
Die Zyklen der Grossen Finger haben eine durchschnittliche Länge von 35,8 Jahren.
Sie sind eng mit der Sonnenaktivität verknüpft.
Sie fallen mit den Maxima und Minima des Gleissberg-Zyklus zusammen und ermöglichen deren langfristige Vorhersage [62, 63].
Wie wir noch sehen werden, bestimmen sie darüber hinaus die Länge des magnetischen Zyklus der Sonnenaktivität (Hale-Zyklus).
Über den Gleissbergzyklus beeinflussen die Zyklen der Grossen Finger auch das Klima.
Soweit es um Klimaschwankungen geht, ist eine Zykluslänge von 36 Jahren nicht neu.
Schon Francis Bacon [102] wies auf einen 35- bis 40jährigen Zyklus in Holland hin, in dem feucht-kühle und warm-trockene Abschnitte aufeinander folgten.
E. Brückner [7] entdeckte 1887 diesen Zyklus neu.
Er zeigte, dass zahlreiche klimatische Phänomene, die in den verschiedensten Gebieten der Erde erscheinen, aber synchronisiert sind, einem Zyklus von 33 bis 37 Jahren folgen.
Er vermutete schon damals einen Zusammenhang mit der Sonnenaktivität.
H. W. Clough [11, 12] nahm diese Anregung auf und fand den Brückner-Zyklus nicht nur in zwölf verschiedenen meteorologischen Variablen, sondern auch in der Sonnenaktivität und insbesondere in Variationen der Länge des 11-jährigen Zyklus.
D. V. Hoyt und K. H. Schatten [39] haben darauf hingewiesen, dass für die Realität des Brückner-Zyklus spreche, dass er sich in skandinavischen Baumringen über viele hundert Jahre hinweg deutlich abzeichne.
Im Hinblick auf Brückners Vermutung, dass ein Zusammenhang mit der Sonnenaktivität bestehe, fragen sie jedoch, welcher Index der Sonnenaktivität mit seinen Variationen dem Brückner-Zyklus folge.
Die hier vorgelegten Ergebnisse beantworten diese Frage.
...
↑
Kapitel 8
de
Zyklen "Kleiner Finger" als Grundlage zuverlässiger Vorhersagen von
Sonneneruptionen und Klima
Wählen wir bei der Berechnung der laufenden Varianz des Bahndrehimpulses der Sonne einen noch feineren Maßstab von 3 Jahren, so erhalten wir das in Abb.15 gezeigte Ergebnis, das zeigt, dass das Fraktal der Fingerzyklen in der Dynamik der Sonnenschwingung auch Kleine Finger einschliesst.
...
Die Ursache für die Antikorrelation der Sonnenaktivität und der kosmischer Strahlung,
die nach Svensmark und Friis-Christensen einen starken Einfluss auf die globale Wolkenausbreitung hat,
ist der bereits kurz erwähnte Sonnenwind.
Dieser unausgesetzt von der Korona der Sonne ausgehende Plasmastrom, der die kosmische Strahlung schwächt, breitet sich spiralförmig bis zur Heliopause aus.
Geht der Sonnenwind von magnetisch offenen Koronalöchern aus, so erreicht er Geschwindigkeiten zwischen 500 und 900 km/s.
Zeigt das Ausgangsgebiet geschlossenen Magnetfeldstrukturen, so liegen die Geschwindigkeiten bei 300 bis 400 km/s.
Treffen schnelle und langsame Ströme zusammen, so entwickeln sich Stosswellen.
Energetische Eruptionen auf der Sonne lösen noch stärkere Stosswellen aus, die Geschwindigkeiten bis zu 2500 km/s erreichen. Sonneneruptionen - chromosphärische Eruptionen (Flares) und eruptive Protuberanzen - haben demnach einen erheblichen Einfluss auf die Intensität der kosmischen Strahlung, wie auch die Forbush-Ereignisse zeigen.
Besonders energetische Eruptionen tragen sogar selbst zur kosmischen Strahlung bei, wenn auch nur im weichen Bereich des Energiespektrums.
Deshalb unterscheidet man die solare von der galaktischen kosmischen Strahlung.
Energetische Eruptionen, die zu Stosswellen im Sonnenwind führen, und Koronalöcher, die besonders schnelles Sonnenplasma ausstossen, konzentrieren sich entgegen einer weit verbreiteten Meinung nicht auf das Maximum im 11-jährigen Fleckenzyklus.
Besonders energetische Eruptionen, die Protonenflares, scheuen das Maximum geradezu [18] und kommen noch in der Nähe des Fleckenminimums vor.
Selbst die Zahl der Eruptionen hängt nicht von der Intensität des Sonnenfleckenmaximums ab.
...
↑
Kapitel 9
de
Literaturangaben
Literaturverzeichnis
1998 en
Solar activity: A dominant factor in climate dynamics
Dr Theodor Landscheidt
Schroeter Institute for Research in Cycles of Solar Activity
Nova Scotia, Canada
↑ 1 en "Solar Constant" Variations in the 11-Year Sunspot Cycle and Climatic Effects
Atmospheric circulation, the cause of weather, is driven by the sun's energy.
Climate is the integral of weather over periods of more than a year.
This integral also depends on the flux of solar energy.
The same applies to variations in the energy flux caused by the sun's varying activity.
Satellite data show that the "solar constant" S is variable.
The solar irradiance decreased from the sunspot maximum 1979 to the minimum 1986, increased again on the way to the next maximum in the 11-year sunspot cycle, and decreased anew in the descending phase.
This came as a surprise as it is plausible that the dark sunspots with their strong magnetic fields impede the free flux of energy from the sun's interior to the outside.
Yet P. V. Foukal and J. Lean [22] have shown that bright faculae in the vicinity of sunspots increase even more than sunspots when the activity grows stronger, so that an irradiance surplus is established.
IPCC scientists hold that the corresponding variation in the solar constant (Delta S) is smaller than 0.1% and has no impact on climate that could count in comparison with the greenhouse effect [94].
Yet they fail to appreciate that quotes of 0.1% in the literature refer to the absolute amplitude of the sinusoidal variation in the solar constant, not the whole change from minimum to maximum, or from maximum to minimum [25, 32, 39].
| Continue reading (Chapter 1) |
↑ 2 en Gleissberg Cycle of Solar Activity and Climate Change
As to climate, seven years is a rather short interval.
A climatic effect caused by total irradiance variations becomes more effective when its impact lasts longer.
The Milankovitch theory in its modern form shows that a change of 0.1% effective during a very long interval can release a real ice-age [49].
So it may be expected that the 90-year Gleissberg cycle of sunspot activity, which modulates the intensity of the 11-year cycle, possesses a considerable potential to accumulate an effective surplus of irradiance, or to induce a steadily decreasing level of radiant flux density, particularly since the Gleissberg cycle can reach a length of 120 years [58].
Figure 3
| Continue reading (Chapter 2) |
↑ 3 en Variations in the Sun's Ultraviolet Radiation and Climate Models
Change in the ultraviolet radiation of the sun is much greater than in the range of visible radiation.
The ultraviolet range of the spectrum lies between 100 Ĺ and 3800 Ĺ.
Wavelengths below 1500 Ĺ are called extreme ultraviolet (EUV).
The variation in radiation between extrema of the 11-year sunspot cycle reaches 35% in the EUV- range [119], 20% at 1500 Ĺ [21], and 7% around 2500 Ĺ [34,97].
At wavelengths above 2500 Ĺ, the variation reaches still 2% [21].
At the time of energetic solar eruptions, the UV-radiation increases by 16%.
At a sunspot maximum the EUV-radiation raises the temperature in the Ionosphere by 300% in relation to the minimum [21].
Yet most important is that the UV-radiation below 2900 Ĺ is completely absorbed by ozone in the stratosphere.
The resultant rise in temperature is augmented by positive feed-back, as the UV-radiation also generates new ozone.
Satellite observations show that the ozone content grows by 2% from sunspot minimum to maximum [113].
D. Rind and J. Overpeck are working on a model which explains how the rising temperature in the stratosphere influences the circulation in the troposphere.
J. D. Haigh [29] has already assessed this effect in quantitative terms and shows that temperature in the Subtropics and North Atlantic storm tracks are especially affected.
Variations in radiation
are not the the sun's only way to influence climate.
Between energetic solar eruptions and galactic cosmic radiation modulated by the solar wind on the one hand and electric parameters of the atmosphere on the other, exist couplings, the strength of which varies by 10% in the course of days, years, and even decades [113].
The most important change is to be found in the downward air-earth current density, which flows between the ionosphere and the surface.
R. Markson and M. Muir [71] have shown how this affects the thunderstorm activity, while B. A. Tinsley [113] assumes that electrically induced changes in the microphysics of clouds (electrofreezing) enhance ice nucleation and formation of clouds.
These approaches have the advantage to be independent of dynamic coupling between different layers of the atmosphere, since these variations affect the whole atmosphere.
Therefore, IPCC scientists who allege that there are not any physical explanations of a solar impact on climate change must be unaware of the relevant literature.
↑ 4 en Cosmic Radiation, Solar Wind, and Global Cloud Coverage
The most convincing argument yet, supporting a strong impact of the sun's activity on climate change, is a direct connection between cloud coverage and cosmic rays, discovered by H. Svensmark and E. Friis-Christensen [111] in 1996.
It is shown in Figure 6.
| Continue reading (Chapter 4) |
↑ 5 en Failure of Climate Predictions by IPCC Scientists
Precise forecasts that prove correct are a sharp criterion for efficient science.
The protagonists of global warming remain empty-handed in this respect in spite of great material and personal expense.
In the eighties S. Schneider from the National Center for Atmospheric Research in Boulder, Colorado, predicted in his book "Global Warming" a huge jump in temperature, polar ice melting away, seas surging across the land, famine on an epidemic scale, and ecosystem collapse.
Today this is no longer taken seriously.
Yet other climatologists, too, made forecasts in the eighties they no longer maintain.
| Continue reading (Chapter 5) |
↑ 6 en Cycles in the Sun's Oscillation Affect Sunspots and Climate
However, if, contrary to the IPCC's attitude, the sun is taken seriously as a dominant factor in climate change, this opens up a possibility to predict climate features correctly without any support by supercomputers.
A string of examples will be presented. The chaotic character of weather and climate does not stand in the way of such predictions.
Sensitive dependance on initial conditions is only valid with regard to processes within the climate system.
E. N. Lorenz has stressed that only non-periodic systems are plagued by limited predictability.
External periodic or quasiperiodic systems can positively force their rhythm on the climate system.
This is not only the case with the periodic change of day and night and the Milankovitch cycle, but also with variations in solar energy output as far as they are periodic or quasiperiodic.
The 11-year sunspot cycle meets these conditions, but plays no predominant role in the practice of predictions.
Most important are solar cycles which are without exception related to the sun's fundamental oscillation about the center of mass of the solar system and form a fractal into which cycles of different length, but similar function are integrated.
The solar dynamo theory developed by H. Babcock, the first still rudimental theory of sunspot activity, starts from the premise that the dynamics of the magnetic sunspot cycle is driven by the sun's rotation.
Yet this theory only takes into account the sun's spin momentum, related to its rotation on its axis, but not its orbital angular momentum linked to its very irregular oscillation about the center of mass of the solar system (CM).
Figure 7 shows this fundamental motion
| Continue reading (Chapter 6) |
↑ 7 en Cycles of 36 Years in Solar Activity and Climate
Cycles of big fingers have a mean length of 35.8 years (178.8 years [big hand] / 5 = 35.76 years [big fingers]).
They are closely connected with solar activity.
They coincide with maxima and minima in the Gleissberg cycle and open up the possibility of predicting these crucial phases many years ahead [62, 63].
As will be shown below, they also define the length of the 22.1-year magnetic cycle of sunspot activity (Hale cycle).
As far as climatic change is concerned, cycles of a length of 36 years are not new.
Francis Bacon [102] has already pointed to a cycle in the Netherlands with a length of 35 to 40 years with cool and wet phases followed by warm and dry periods.
E. Brückner [7] discovered this cycle again in 1887.
He demonstrated that varied climatic phenomena in different regions of the world show synchronized phases in a cycle of 33 to 37 years.
He had already surmised in those days a connection with the sun's activity.
H. W. Clough [11, 12] followed this suggestion and found the Brückner cycle not only in 12 meteorological variables, but also in sunspots and especially in variations in the length of the 11-year sunspot cycle. D. V. Hoyt and K. H. Schatten [39] think that the reality of the cycle is confirmed by Scandinavian tree ring data which show its rhythm over hundreds of years.
With regard to Brückner's supposition of a connection with the sun's activity, they ask which index of solar activity would conform with a 36-year cycle.
The results presented here answer this question.
↑ 8 en Cycles of "Small Fingers": a Solid Basis for Predictions of Solar Eruptions and Climate
A ubiquitous notion in present day science is the term fractal coined by B. B. Mandelbrot.
A fractal is a geometrical shape whose complex structure is such that magnification or reduction by a given factor reproduces the original object.
Self-similarity on different scales is a pre-eminent feature of fractals.
The solar cycles derived from the sun's motion about the center of mass form such a fractal.
The big fingers in big hands contain small hands with small fingers (SF).
...
The primary cause of the solar modulation of cosmic rays, which regulates cloud coverage,
is not the number of sunspots,
but the varying strength of the solar wind.
This was mentioned already.
The highest velocities in the solar wind up to 2500 km/sec are
generated by energetic solar eruptions
(solar flares and eruptive prominences)
which even contribute to cosmic rays.
These solar cosmic rays have an impact on the strength of the solar wind, but show fluctuations different from the galactic cosmic rays that enter the solar system from the outside.
Energetic solar eruptions shun sunspot maxima [18] and occur even close to minima.
The number of eruptions does not depend proportionally on the intensity of 11-year sunspot maxima.
Figure 18 from Solar Geophysical Data [106] displays the monthly numbers of observed flares in sunspot cycles No 20 to 22.
Cycle No 20 with the highest monthly sunspot number R = 106 was much weaker than cycle No 21 (R = 165) and cycle No 22 (R = 158), but it produced nearly as many flares as cycle No 21 and considerably more than cycle No 22.
It is surprising, too, that cycle No 22, nearly as strong as cycle No 21 as to sunspots, generated such a low number of flares in relation to its predecessor.
Solar-terrestrial connections like the Svensmark effect are much more dependent on energetic eruptions than on sunspots.
Sunspot maxima are not predominant in this respect, but special phases in the small finger cycle, as shown in Figure 17, are.
| Continue reading (Chapter 8) |
↑ 9 en References
⇧ 1997
1997-01
de
Klimavorhersage mit astronomischen Mitteln?
Theodor Landscheidt
Fusion 18, Nr. 1, 58, 1997
Die meisten natürlichen Klimafaktoren hängen so eng mit astronomischen Gegebenheiten zusammenhängen,
daß ein wirkliches Verständnis der Klimadynamik und eine darauf gegründete richtige Einschätzung der Größenordnung der menschlichen Einwirkung auf das Klima nur dann möglich ist,
wenn der potentielle Einfluß astronomischer Faktoren hinreichend berücksichtigt wird.
Die lange umstrittene Milankovich-Theorie ist ein gutes historisches Beispiel hierfür.
M. Milankovich [34] hat bereits zu Anfang der dreißiger Jahre mit einleuchtenden Argumenten dargelegt, daß die gravitativen Störungen, die von den anderen Körpern des Sonnensystems ausgehen, das Bahnverhalten der Erde relativ zur Sonne langfristig verändern und dadurch die Aufnahme der von der Sonne abgestrahlten Energie so stark beeinflussen, daß sich dies durchgreifend auf das irdische Klima auswirkt.
Die Überlegungen Milankovichs zeigen, daß drei Größen relevant sind, deren Variationszyklen sich über Tausende von Jahren erstrecken:
die Neigung der Rotationsachse der Erde gegen die Erdbahnebene, die Wanderung des Perihels relativ zum Frühlingspunkt
und die Form der Erdbahn, ausgedrückt durch die Exzentrizität der Bahnellipse.
Der Anspruch, daß sich durch die Variationszyklen dieser Größen der Wechsel von Glazialen und Interglazialen erklären lasse, war heftig umstritten,
solange es keine hinreichend weit in die Vergangenheit zurückreichenden Klimadaten gab, die mit den astronomischen Zyklen verglichen werden konnten.
Dies änderte sich aber grundlegend, als von der Mitte der fünfziger Jahre an Bohrkerne aus den Tiefseesedimenten der Ozeane zur Verfügung standen.
Seit der sehr sorgfältigen, auch Skeptiker überzeugenden Untersuchung von J.D. Hays, J. Imbrie und N. Shackleton [19] ist allgemein anerkannt, daß die Milankovich-Theorie die langwellige Klimaentwicklung richtig erfaßt.
A.L. Berger [5] hat bei einer Neuberechnung der Variation der Bahnelemente und einer Analyse der Schwingungsdaten Zyklen von 18000, 23000, 42000, 96000 und 400000 Jahren isoliert, die das Klimageschehen der Vergangenheit zufriedenstellend abbilden und eine Extrapolation in die Zukunft ermöglichen.
Seitdem wird die Milankovich-Theorie als zuverlässiges Arbeitsinstrument der Klimatologie angesehen.
Dabei ist bemerkenswert, daß der astronomische Sachverhalt
nicht nur zur Erklärung des vergangenen Klimageschehens beiträgt,
sondern auch die Vorhersage der zukünftigen Entwicklung möglich macht.
Warum sollte es ausgeschlossen sein, daß die Astronomie einen ähnlichen interdisziplinären Beitrag auf dem Gebiete der mittel-und kurzwelligen Klimaschwankungen leistet?
Es ist auffällig, daß die Aktivität der Sonne ähnlichen mittelfristigen und kurzfristigen Schwankungen unterworfen ist wie Klima und Wetter auf der Erde.
Schon Galilei hatte die schnellen Veränderungen der Sonnenflecken deutlich erkannt.
In einem Brief an ein wissenschaftsbeflissenes Mitglied der berühmten Kaufmannsfamilie Welser aus dem Jahre 1612 schrieb er:
"Die dunklen Flecken... schwanken in der Dauer von einem oder zwei Tagen bis zu 30 oder 40 Tagen.
Zum größten Teil haben sie ganz unregelmäßige Formen, und diese verändern sich fortwährend, manche schnell und stark, andere langsamer und in geringerem Umfang.
Sie unterscheiden sich auch in ihrer Dunkelheit, indem sie sich manchmal zu verdichten und manchmal auszubreiten und dünner zu werden scheinen.
Neben der Formenänderung teilen sich manche von ihnen in drei oder vier Flecken auf, und oft vereinigen sich mehrere zu einem."
In einem weiteren Brief widersprach Galilei dezidiert der Annahme von C. Scheiner, daß die Flecken kein Bestandteil des Sonnenkörpers seien.
Er hob hervor, daß sie sich am besten verstehen ließen, wenn man in ihnen etwas Ähnliches erblickte wie die Wolken in der Erdatmosphäre. [33]
Es blieb nicht, aus, daß ein Zusammenhang zwischen solchen "Wettererscheinungen" auf der Sonne und dem irdischen Wetter vermutet wurde.
So hob schon der Astronom G.B. Riccioli in seinem 1651 erschienenen Werk "Almagestum novum" hervor, daß die Sonne während einer Periode ungewöhnlicher Hitze und Trockenheit von Mitte Juli bis Mitte September 1632 ohne Flecken war, während sie im Juni 1642, als es in Italien außergewöhnlich kalt war, zahlreiche Flecken zeigte. [33]
Solche Beobachtungen und die aus ihnen gezogenen Schlüsse waren von Anfang an widersprüchlich.
Im Gegensatz zu Riccioli ging W. Herschel [20], der Entdecker des Uranus, nach seinen Beobachtungen davon aus, daß Fleckenmaxima höhere Temperaturen und bessere Wachstumsbedingungen begünstigten.
R. Wolf [42], dem wir die Definition der Relativzahlen als Maß für die Sonnenfleckentätigkeit verdanken, kam zu dem gleichen Ergebnis wie Herschel, als er eine meteorologische Zeitreihe der Jahre 1000 bis 1800 untersuchte.
Der Meteorologe und Klimatologe W. Köppen [24] nahm dagegen nach der Analyse von Temperaturbeobachtungen aus 25 großen Gebieten der Erde in Übereinstimmung mit Riccioli an, daß starke Sonnenfleckentätigkeit mit niedrigen Durchschnittstemperaturen einhergehe und vice versa.
Das Ansehen des Forschungszweiges der solar-terrestrischen Beziehungen litt darunter,
daß sich solche Widersprüche auch in den Untersuchungen der letzten Jahrzehnte fortsetzten, obwohl die Forscher hochentwickelte Verfahren der mathematischen Statistik einsetzten.
In den letzten Jahren hat sich dies jedoch grundlegend gewandelt.
Ähnlich wie in der Entwicklungsgeschichte der Milankovich-Theorie waren es neue Daten, die einen Entwicklungssprung auslösten.
Aufgrund von Satellitenbeobachtungen außerhalb der Atmosphäre wissen wir heute, daß Herschel und Wolf recht hatten, als sie Sonnenfleckenmaxima mit höheren Durchschnittstemperaturen und Sonnenfleckenminima mit niedrigeren Temperaturen in Beziehung setzten.
Die sogenannte Solarkonstante ist in Wirklichkeit nicht konstant.
Sie wird im 11jährigen Zyklus bei ansteigender Sonnenfleckentätigkeit größer und bei abfallender Aktivität kleiner.
Nach den Satellitenbeobachtungen verringerte sich die Helligkeit der Sonne zwischen dem Sonnenfleckenmaximum am Ende des Jahres 1979 bis zum folgenden Minimum im Herbst 1986 um 0,1 Prozent. [41]
Dies war eine Überraschung, da die meisten Wissenschaftler geglaubt hatten, daß die dunklen Sonnenflecken mit ihren starken Magnetfeldern den freien Fluß der Energie vom Sonneninneren nach außen behinderten.
P. Foukal und J. Lean [12] haben jedoch eine Erklärung für die wachsende Helligkeit gefunden:
Die hellen Fackeln in der Umgebung der Sonnenflecken vermehren sich bei stärkerer Aktivität noch stärker als die Sonnenflecken, so daß es zu einem Überschuß der abgestrahlten Energie kommt.
Dem Anwachsen der von der Sonne ausgestrahlten Energie um 0,1 Prozent entspricht ein Temperaturanstieg auf der Erde von 0,2 Prozent. [18]
Entgegen dem ersten Eindruck ist diese Variation nicht so geringfügig, daß sie nichts bewirken könnte.
Nach Berechnungen, die von Standard-Klimamodellen ausgehen, würde ein Absinken der Sonnenstrahlung um 0,2 bis 0,5 Prozent während mehrerer Jahrzehnte ausreichen, um eine "Kleine Eiszeit" zu verursachen. [13] [38]
Während dieser Kälteperiode mit einem Tiefpunkt in der 2. Hälfte des 17. Jahrhunderts lagen die Wintertemperaturen in Europa bis zu 5° niedriger als um 1950. [10]
Der säkulare Gleissberg-Zyklus, der den 11jährigen Fleckenzyklus moduliert, erstreckt sich im Durchschnitt über acht bis neun Jahrzehnte und geht mit großen Unterschieden in der Stärke der 11jährigen Maxima einher.
Es ist hiernach durchaus vorstellbar, daß dieser langwellige Aktivitätszyklus bei den Variationen der Energieabstrahlung der Sonne zu einem kumulativen Effekt führt.
S. Baliunas und R. Jastrow [3] haben nachgewiesen,
daß Sterne, die mit unserer Sonne vergleichbar sind, tatsächlich entsprechende Helligkeitsschwankungen zeigen, die dem Rhythmus des Gleissberg-Zyklus entsprechen.
In diesen Rahmen fügt sich der 1991 von E. Friis-Christensen und K. Lassen [15] geführte Nachweis ein,
daß die Temperatur der nördlichen Hemisphäre und die Länge des 11jährigen Fleckenzyklus in einer engen Beziehung zueinander stehen.
Abbildung 1 stellt diesen Zusammenhang dar.
Die dicke Kurve bildet den jährlichen Durchschnitt der am Erdboden gemessenen Lufttemperatur der nördlichen Hemisphäre ab, während die dünne Kurve die geglätteten Längen des 11jährigen Zyklus wiedergibt, die in das Zeitintervall 1865 bis 1985 fallen.
Es bedarf keiner Korrelationsrechnung, um zu sehen, daß der Gleichlauf beider Kurven gut ist.
Friis-Christensen und Lassen ordnen von ihrer praktischen Erfahrung her die jeweilige Länge des 11jährigen Zyklus ganz allgemein als Parameter ein, der besonders geeignet ist, langfristige Variationen der Sonnenaktivität anzuzeigen.
Betrachten wir jedoch den Sachverhalt genauer, so wird deutlich, daß die dicke Kurve in Abbildung 1 nichts anderes als den Gleissberg-Zyklus selbst darstellt.
Wer die Länge der 11jährigen Zyklen mit der Intensität ihrer Maxima vergleicht, sieht sofort, daß kurze Zyklen starke Fleckenaktivität entwickeln, während lange Zyklen durch schwache Aktivität gekennzeichnet sind.
W. Gleissberg [17] machte von diesem Zusammenhang Gebrauch, als er den säkularen Zyklus bis zum Jahre 290 n.Chr. zurückverfolgte.
Er leitete aus der Häufigkeit der Beobachtung von Polarlichtern und mit bloßem Auge wahrgenommenen großen Sonnenflecken die Länge der jeweiligen 11jährigen Zyklen ab und erhielt bei einer Glättung der Folge der Längenwerte unmittelbar eine Kurve, die mit ihren Maxima und Minima die Epochen der Extrema des säkularen Fleckenzyklus anzeigte.
Friis-Christensen und Lassen verlängern mit der dicken Kurve in Abbildung 1 die von Gleissberg erarbeitete Kurve des säkularen Zyklus, da sie genau wie er die fortlaufenden Werte der Längen des 11jährigen Zyklus mit einem Tiefpaßfilter geglättet haben.
⇧ 1992
1992-05/06
en
THE GOLDEN SECTION: A Building Block of Cyclic Structure
Theodor Landscheidt
Foundation for the Study of Cycles, May/June 1992
Abstract: Hidden Cycles in Nature, Man, and the Economy
In this paper it is shown how to reveal the hidden cycles in the Nature, society and economy.
The mechanism of forming of such cycles and their structure and are shown.
↑ en 1992 Cycles Prize Winner: Theodor Landscheidt
On April 25, Theodor Landscheidt was awarded the 1992 Cycles Prize in honor of his outstanding contributions to the world of cycle research.
He presented the following paper at the Foundation's annual conference.
Born in Bremen, Landscheidt studied philosophy, law, and natural sciences at the University of Goettingen, where he earned his doctorate.
He was a West German High Court judge until his retirement, when he became Director of the Schroeter Institute for Research in Cycles of Solar Activity in Nova Scotia.
He has been elected a member of various academies and of the American Geophysical Union.
Since 1974, Landscheidt has made long-range forecasts of energetic solar eruptions and geomagnetic storms, with a success rate of better than 90%.
He successfully forecast the end of the Sahelian drought and has correctly identified the turning points in various economic cycles.
Landscheidt has published widely in both German and English on solar-terrestrial cycles.
His latest book, SUN-EARTH-MAN: A MESH OF COSMIC OSCILLATIONS, explains how planets regulate solar eruptions, geomagnetic storms, conditions of life, and economic cycles.
↑ en The Golden Section: A Building Block of Cyclic Structure
Edward R. Dewey (1970) knew he was engaged in an intricate and
disconcerting endeavor:
"The study of cycles reveals to us our ignorance, and is therefore very
disturbing to people whose ideas are crystallized."
At times, all of us are subject to such experience.
In the technical analysis of data, we always look for peaks and troughs.
When a sequence of maxima emerges at reasonably regular intervals, we automatically assume they are crest phases of a cycle, the ascending nodes of which precede the crests by 90°.
This inference, however, may be misleading.
Cycles often possess inner structure that conspicuously deviates from the standard pattern of a sinusoidal wave.
...
↑ Fig. 1 Correlation between the moon's phases and U.S. rainfall maxima
Correlation between the moon's phases and U.S. rainfall maxima,
------1900 to 1924 (solid line)
........and 1925 to 1949 (dashed line).
°-°Within cycles from full moon to full moon (open circles)
•-• and from new moon to new moon (filled circles),
rainfall maxima coincide with the major (0.618) of the golden section,
whereas rainfall minima coincide with the minor (0.382).
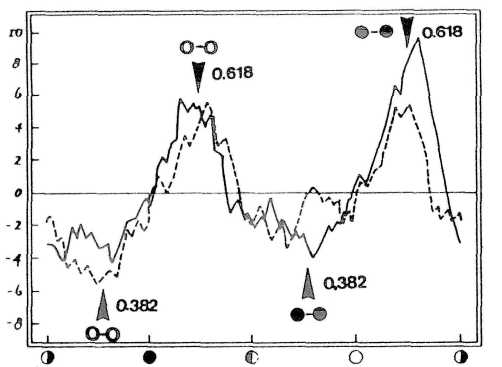
↑ Fig. 2 Proportions of a Greek temple that illustrate the golden section
Proportions of a Greek temple that illustrate the golden section.
Point G represents the golden number 0.618.
This point divides the height of the temple into major (0.618)
and minor (0.3819) intervals.
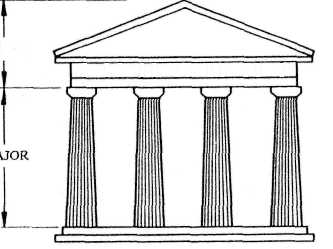
↑ Fig. 3 Rate of change of the U.S. Gross National Product (GNP), 1874-1990
Rate of change of the U.S. Gross National Product (GNP), 1874-1990.
Starting phases of "big finger" and "small finger" cycles are marked by rectangles and arrowheads,
and golden-section majors within small-finger cycles by circles.
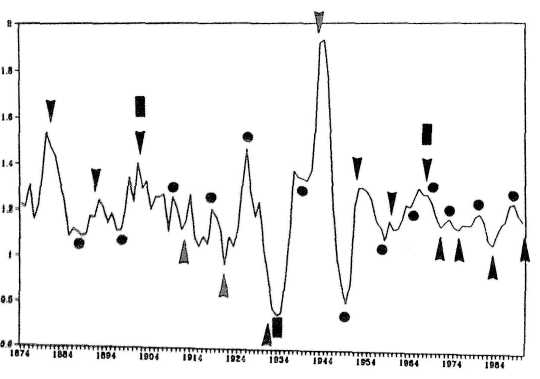
↑ Fig. 4 The 11-year sunspot cycle and the Gleissberg cycle
The 11-year sunspot cycle and the Gleissberg cycle
Broken line: The 11-year sunspot cycle
Solid line: The Gleissberg cycle of about 90 years.
Gleissberg minima in sunspot activity occurred about 1670,1740, 1810,
and 1900.
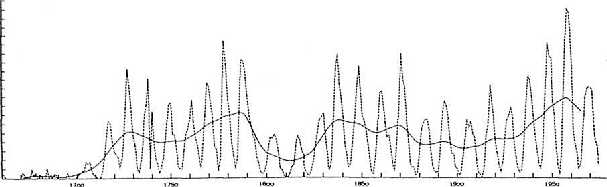
↑ Fig. 5 The sun's oscillations about the solar system's center of mass, 1945-1995
↑ Fig. 6 T36-year running variance in the sun's orbital angular momentum, 700 to1600
↑ Fig. 7 "Fingers" and "Hands"
↑ Fig. 8 3-year running variance of the sun's orbital angular momentum
↑ Fig. 9 Number of south polar faculae on the sun, 1906 to 1975
↑ Fig. 10 U.S. building cycle, 1952 to 1987, as a plot of 9-year smoothed growth rates
↑ Fig. 11 Standard & Poor's 500 index, 1963 to 1988,
↑ Fig. 12 Wheeler's index of international battles.
↑ Fig. 13 When all corners of a pentagon are connected by diagonals, a five-pointed star emerges
↑ Fig. 14 A whirling fractal of golden rectangles creates a logarithmic spiral, revealing a close relationship between the golden section and the golden spiral
↑ Fig. 15 Mandelbrot and Julia sets
↑ Fig. 16 Golden-section divisions within cycles formed by the rotating earth
↑ Fig. 17 Global, linear representation of Gauquelin's results
↑ Fig. 18 Distribution of Mars in the diurnal circle based on the birth times of famous sports champions and actors and scientists with character traits similar to those of sports champions
↑ Fig. 19 Distribution of Mars based on the birth times of painters, musicians and writers
↑
Fig. 20 Golden-section divisions within cycles formed by the
rotating earth:
Correlation with positions of the sun and special planets at the
birth times of prominent professionals
↑ Fig. 21 Distribution of the sun and special planets in the diurnal circle at the birth times of eminent professionals
⇧ 1990
1990-04-24/27
en
Relationship Between Rainfall in the Northern Hemisphere and
Impulses of the Torque in the Sun's Motion
Theodor Landscheidt
Director of the Schroeter Institute for Research in Cycles of
Solar Activity, Belle Cote, Nova Scotia, Canada
In: K. H. Schatten and A. Arking, eds.:
Climate impact of solar variability. Greenbelt, NASA, 259-266, 1990.
This paper was presented at the Conference on the Climate Impact
of Solar Activity, held at NASA's Goddard Space Flight Center in
Greenbelt, Maryland, April 24-27, 1990.
Abstract
The analysis of major change in the angular momentum of the sun's irregular motion about the barycenter of the solar system, represented by extrema in the running variance of impulses of the torque (IOT), discloses a connection with both extrema in the Gleissberg cycle of secular sunspot activity and maxima in the thickness of varves from Lake Saki, Crimea.
This significant relationship can be traced back to the 7th century, further inquiries link the running variance in IOT to rainfall over central Europe, England, Wales, eastern United States, and India, as well as to temperature in Europe.
This significant correlation covers more than 130 years.
There has been permanent controversy over whether or not the sun's varying activity influences weather on earth.
Simple relationships discovered in the 1870s and the following decades vanished when examined more critically, or faded in the light of longer records.
Furthermore, such ephemeral relationships were limited to special regions and did not cover larger areas subjected to the same or a similar climate.
Yet the quest persists.
In 1987, Labitzke (1987) reported that midwinter warmings in the U.S. and Western Europe are well correlated with the 11-year sunspot cycle over the past 40 years, provided the switch in direction of stratospheric winds (QBO) is taken into account.
It has been objected that this connection, covering only some decades, could be explained by internal decadal variations in the atmosphere that happen to be in phase with sunspots for some cycles, but which show no actual physical relation (Geller 1989).
This kind of criticism does not apply to the results presented here, which cover more than 130 years of rainfall and temperature data in different parts of the Northern Hemisphere and 12 centuries of Lake Saki varve data.
The solidly significant correlation of these data with impulses of the torque in the sun's motion about the center of mass (CM) of the solar system cannot be explained by a complete chain of cause and effect.
An acknowledged theory of solar activity does not yet exist, and the atmosphere's response to solar activity remains poorly understood.
It is shown, however, that special phases and cycles in the sun's motion, accessible to computation, show a strong relationship both with the sun's varying activity and with synchronous climatic phenomena (Landscheidt 1981,1983,1987).
Earlier results based on this relationship were tested by successful long-range forecasts of energetic solar eruptions and strong geomagnetic storms (Landscheidt 1984), and by the correct prediction of the end of the Sahelian drought three years in advance (Landscheidt 1983, p. 304; Faure and Gac 1981).
...
⇧ 1989
1989-09/10
en
Predictable Cycles in Geomagnetic Activity and Ozone Levels
Theodor Landscheidt
Director of the Schroeter Institute for Research in Cycles of Solar
Activity
Foundation for the Study of Cycles, Sept/Oct 1989
Abstract
Geomagnetic storms, which are released by energetic solar eruptions, are important geophysical events.
Newer results indicate that there is a connection with weather.
There is shown the zonal type of atmospheric circulation as a result of geomagnetic disturbances caused by the sun's erup-tional activity, and meridional circulation related to a lull in geomagnetic activity.
This is a permanent feature that regulates the prevalence of warm westerly flow or cool arctic air over Europe and North America.
1989-05/06
en
Creative Functions of Cycles - Predictable Phase-Shift in
Solar-Terrestrial Cycles
Theodor Landscheidt
Foundation for the Study of Cycles, May/June 1989
Abstract
Recent research has shown that cycles are at the core of creativity.
They form antagonistic centers of polar tension, the competing realms of which generate fractal boundaries, sites of instability where new forms emerge.
This knowledge, when applied to cycles and boundaries in the solar system, makes it possible to predict phases of instability, phase-shift, and emergence of new patterns in solar-terrestrial cycles.
...
⇧ 1987
1987-11-30
en
Solar Rotation, Impulses of the Torque in the Sun's Motion,
and Climatic Variation
Theodor Landscheidt
Schroter Institute for Research in Cycles of Solar Activity
Climatic Change 12 (1988) 265-295 © by Kluwer Academic Publishers
Received 26 February, 1987; in revised form 30 November, 1987
Abstract
Running variance analysis and maximum entropy spectral analysis applied to Mount Wilson rotation data yield arguments in favor of a connection between variations in the Sun's rotation rate, energetic X-ray flares, and impulses of the torque (IOT) in the Sun's irregular motion about the barycenter of the planetary system.
Such IOT, that have been shown to be related to the secular cycle of solar activity and excursions of the Maunder minimum type, also seem to be linked to outstanding peaks in geomagnetic activity, maxima in ozone concentration, incidence of blocking type circulation, as well as rainfall over Central Europe, England/Wales, eastern United States, and India.
Statistical tests, that confirm these links, additionally point to IOT connection with temperature in Central Europe and the number of icebergs that pass south of latitude 48° N. IOT relationship with X-ray flares and strong geomagnetic storms was tested in successful long range forecasts.
1. Role of Solar X-Rays, X-Class Flares, and the Earth's Magnetosphere in Solar-Terrestrial Interaction
Most past efforts concerning Sun-weather connections have looked for direct relations to visible solar activity, especially sunspots.
Literature is replete with statistical results, but most scientists hold that the case is still unresolved.
According to Eddy (1977, 1979, 1982) it is possible that solar connections have been sought in the wrong places or with the wrong index of solar activity.
Observations of the Sun by means of satellite instrumentation have revealed strong fluctuations in the unseen ultraviolet and X-ray portions of the Sun's electromagnetic spectrum that show no distinct correlation with short range variations in sunspots.
Thus they could have been missed in earlier searches for solar-terrestrial effects based on optical observations.
...
⇧ 1986
1986-08-05 en
Cyclic Distribution of Energetic X-Ray Flares
Theodor Landscheidt
Schroter Institute for Research in Cycles of Solar Activity
Solar Physics 107 (1986) 195-199
Received 21 February; in revised form 5 August, 1986
Abstract
The Blackman-Tukey power spectrum of flare generated X-ray bursts > X1 observed from 1970 to 1982 by satellite instrumentation (SOLRAD/SMS/GOES) shows prominent peaks at 156, 4.8, 2.8, and 1.1 months.
According to a statistical test of the significance of the deviation of these peaks from Markov red noise, the peaks at 2.8 and 1.1 months are significant at the 99% confidence level while the peak at 4.8 months reaches the 95 % level.
A replication by means of the maximum entropy spectral analysis (MEM) yields the same prominent peaks at the same frequencies.
1. Flares and X-Rays
Solar flares are the most powerful and explosive of all forms of solar activity and the most important in terrestrial effect.
Ultraviolet spectra taken of different flare phases revealed the existence of localized temperatures within flares that exceeded 2 x 10⁷ K (Eddy, 1979).
The energy in an outstanding flare reaches 1027 J (Svestka, 1976).
Skylab X-ray observations demonstrated that the energy released in the ultraviolet and X-ray wavelengths was far greater than the emission seen from the ground in visible wavelengths.
Solar flares produce increases of up to three orders of magnitude in 1-8 A X-rays, and four orders in 0.5-3 A.
This variability far exceeds the possible errors in flux measurement. X-rays below 10 A, emitted by energetic solar flares, are an important source of ionization in the D-region of the ionosphere, and produce Sudden Ionospheric Disturbances (SID).
...
⇧ 1984
1984 en
Cycles of Solar Flares and weather
Theodor Landscheidt
Schroeter Inst. Res. Cycles Solar Activity
ABSTRACT
Sunspots only constitute potentials of solar activity which are actually released by solar eruptions.
Single energetic flares and periods of enhanced eruptional activity seem to be related to weather.
This is valid for the quality of weather forecasts (Scherhag, Reiter), atmospheric circulation changes (Schuurmans) , rainfall (Clarkson) , and thunderstorm incidence (Bossolasco et al.).
There are models that explain this effect (e.g. Roberts and Olson, Flarkson, Neubauer, and Bucha). This poses the problem of the prediction of solar flares.
Such eruptions seem to be distributed in a stochastic manner.
But closer examination reveals cycles of solar flares with mean periods of 9 years, 2.25 years, and 3 months.
They are accessible to forecasts, because they run parallel with special phases in the Sun's motion about the center of mass of the solar system, and with a cyclic pattern formed b/ the change in the angular acceleration of the vector of the tidal forces of the planets Venus, Earth, and Jupiter.
⇧ 1981
1981en
Swinging Sun, 79-Year Cycle, and Climatic Change
Dr. Theodor Landscheidt
Federal Republic of Germany
Affiliated with the Space Environment Services Center, Boulder,
Colorado, U.S.A., in preparing long range solar activity forecasts.
J. interdiscipl. Cycle Res., 1981, vol. 12, number 1, pp. 3-19.
Paper presented at the 9th International Interdisciplinary Cycle
Research Symposium, Trier, Fed. Rep. of Germany, 6-11 July 1980.
ABSTRACT
The secular cycle of solar activity is related to the sun's oscillatory motion about the center of mass of the solar system.
Comparatively short periods of revolution with relatively high rates of curvature constitute a potential for crucial values of the time integral of torque AL = J t0 r (t) dt which seem to give rise to a weak but long lasting flow of solar plasma that modulates short-term flow due to the dynamo effect.
Relatively strong impulses of the torque A L occur at mean intervals of 19.86 years.
Four consecutive impulses respectively define a permanent wave with a quasiperiod of 79.46 years which determines the distribution of positive and negative extrema in activity.
Phases of 0° or 90° indicate a potential for peaks and phases of 180° or 270° can lead to troughs.
Such potentials are actually released if A L transgresses a definite threshold value.
The ensuing interval variations in the secular cycle are verified by records of sunspots and aurorae dating back to the 4th century AD.
Rare activity-deficient periods like the Maunder Minimum, which according to Eddy et al. are related to changes in the Earth's climate, solely occur when AL reaches exceptional values meeting a special criterion.
This is confirmed by radiocarbon data going back to the 6th millenimum BC.
The next minimum in the 79-year cycle will occur in 1990.
It will be more pronounced than the minimum in 1811.
...
INTRODUCTION
Eddy (1976, 1977) has focused attention on periods of exceptionally weak solar activity like the Maunder Minimum (1645 to 1715) and the Spoerer Minimum (1460 to 1550).
These grand minima, confirmed by carbon 14- data, seem to be related to long-term changes in world climate.
Their influence on solar-terrestrial phenomena is obvious.
In addition, they furnish new evidence of long-duration variations in solar activity.
According to Gleissberg (1975) the discovery of corresponding long-term recurrence tendencies in sunspot frequency would be of considerable importance, for it would make possible accurate long-range forecasts of low-frequency variations.
The Maunder Minimum and the Spoerer Minimum coincide with troughs in the 80-yr cycle of sunspot activity (80 YC) which according to Gleissberg (1975) and Hartmann (1972) occurred about 1500 and 1670.
Moreover, the two grand minima in question are separated by an interval which is near the 179-yr period of variation in the sun's oscillatory motion about the center of mass of the solar system (Jose, 1965).
These relations are indicative of a common background phenomenon capable to generate cyclic variations.
Considering the long range of these variations, it seems plausible to assume that it is the sun's swing about the center of mass (CM) which causes long-term cycles in solar activity while short-term variations are due to the sun's differential rotation on its axis (Parker, 1955; Leighton, 1969; Stix, 1974).
...
CONCLUSIONS
Schwarzschild (1949) holds that variations in solar activity are caused by oscillations of the sun that range over decades.
Waldmeier (1955) supports this thesis.
Regarding the results presented in this paper, Schwarzschild's opinion could prove true in the sense of the working hypothesis defined in the introduction.
It has been substantiated by the permanent 79 YC and the quantitative criteria Cnl to Cn3 showing a good practical reliability.
These relations should be intriguing enough to induce theorists competent in the field of magnetohydrodynamis to develop thorough quantitative models.
Meanwhile, the lack in elaborate theory does not impair the heuristic importance of the results.
Epistemologically the stage of gathering data, establishing morphological relations, and setting up working hypotheses necessarily precedes the stage of elaborated theories.
...
⇧ 1970
1967-12-15 de
Gibt es einen Zusammenhang zwischen dem Alter kosmischer K?rper
und Systeme und ihrem spezifischen Volumen?
Theodor Landscheidt, Bremen
Manuskript eingereicht am 27. XII. 1967
I. Einleitung
Die Linien der Spektren ferner Galaxien zeigen eine Rotverschiebung, die proportional mit der Entfernung r anwächst.
Da gute Gr?nde dafür sprechen, dass auch im Bereich weit entfernter Galaxien dieselben Naturgesetze gelten wie in der Nähe der Erde, wird allgemein die Rotverschiebung als Doppler-Effekt gedeutet.
...
Zusammenfassung
Das Alter der Erde, der Planeten, der Sonne, der Sternhaufen, der Galaxien und des Universums lässt sich einheitlich als logarithmische Funktion des spezifischen Volumens dieser Objekte darstellen.
Hierbei ergeben sich Indizien für die expansive Entwicklung aller kosmischen Objekte aus kompakten Frühzuständen.
Ausgangspunkt für diese Entwicklung ist das spezifische Volumen des Protons.
Wird mit natürlichen, mikrophysikalischen Bezugsgrössen gerechnet, so kann die Proportionalitätskonstante des funktionalen Zusammenhangs als Kombination der drei fundamentalen reinen Zahlen der theoretischen Physik beschrieben werden.
Summary
The age of the Earth, the planets, the sun, the globular clusters, the galaxies, and the universe can be represented as a logarithmic function of the specific volume of these objects.
This connexion seems to indicate that all cosmic bodies expand out of a compact State of development whose point of departure is the specific volume of the proton.
The proportional constant of the function can be described as a combination of the three fundamental pure numbers of theoretical physics if calculations are based on natural microphysical reference quantities.
⇧ Der Wasserplanet
Ernst-Georg Beck: Der Wasserplanet
Gleissbergzyklus und Prognosen von Dr. Landscheidt
166-Jahreszyklus der Sonnenfleckenaktivität
en 166 Year Cycle
fr Cycles 166 ans
de Dr. Theodor Landscheidt, der sich intensiv mit solaren Zyklen beschäftigt prognostiziert aufgrund des 83 jährigen Gleissbergzyklus, dessen Minima immer mit einer kleinen Eiszeit korrelieren ein solche Eiszeit bis zum Jahr 2030 (12).
Beim Gleissberg Zyklus ändern sich die Rotationskräfte, die die Sonnenbewegung um das Massenzentrum des Sonnensystems steuert in einem 83-jährigen Zyklus. Maxima bedeuten relativ hohe Temperaturen, Minima kleine Eiszeiten.
Dieser Zyklus ist die 2. harmonische Schwingung eines 166-jährigen Zyklus und moduliert den 11-jährigen Sonnenzyklus.
Ein Vergleich mit den tatsächlich stattgefundenen Ereignissen ist augenfällig.
1120 fand ein aussergewöhnliches Maximum statt (Maximum der Mittelalterlichem Warmzeit), ca. 1670 ein Minimum (Kleine Eiszeit).
Auch die 1947, 1976, 1983 aufgetretenen Temperaurmaxima decken sich mit diesen Zyklen bzw. der solaren Aktivität.
⇧ EIKE Europäisches Institut für Klima und Energie
↑ de Abbildungen en Figures fr Figures