3.1.8 Klima-Geschichte
en Climate History
fr Histoire du climat
| ⇨ | Klima: Wandel│ Fragen│ Wissenschaft│ Probleme│ Beurteilung│ Diskurse│ Auswirkungen | |||
| ⇩ | Klima-Skandal: Manipulation│ Realität│ Angst | |||
| ⇩ | Neue Kälteperiode: Kaltzeit│ Auswirkung | |||
Mit folgendem Link wird von anderen Webseiten auf diese Seite verwiesen.
| de | en | fr |
|---|---|---|
|
Klima Wandel Klima Geschichte |
Climate Change Climate History |
Climat Changement Histoire du climat |
- Übersicht │ Welt-Info │ Verzeichnis │ Text
⇧ de Übersicht en Overview fr Vue d'ensemble
|
A
Klimatologie / Paläoklimatologie Eiszeiten & Warmzeiten Klima-Zyklen, Kulturen Geschichte der Menschheit |
B
Vor 4,6 Milliarden Jahren Die älteste nachgewiesene Vereisung der Erde vor 2,3 Milliarden Jahren |
C
Vor 900 Millionen Jahren Der große Klima-Zyklus seit 900 Millionen Jahren |
|
D
Vor 500'000 Jahren Die aktuelle Eiszeit seit 500'000 Jahren |
E
Vor 40'000 Jahren Aussterben der Neandertaler vor ca. 40'000 Jahren |
F
Vor 25'000 Jahren Klima vor 25'000 Jahren - Die letzte Eiszeit |
|
G
Vor 11'000 Jahren Von der letzten Eiszeit bis heute Das Holozän |
H
Klima Heute Beobachtungen |
I
Zukunft Voraussagen |
⇧ Welt-Info
⇧ de Verzeichnis en Contents fr Sommaire
- A1 de Allgemein / en General / fr Générale
- A2 de
Klimatologie / Paläoklimatologie
en Climatology / Paleoclimatology
fr Climatologie / Paléoclimatologie
- B1 de
Klima vor 4 Milliarden Jahren (Praekambium)
en Climate 4 billion years ago (Praecambium)
fr Climat il y a 4 milliards d'années (Praecambium) - B2 de
Die älteste nachgewiesene Vereisung der Erde
vor 2,3 Milliarden Jahren
en The oldest proven icing on earth 2.3 billion years ago
fr Le plus ancien givrage éprouvé sur terre il y a 2,3 milliards d'années
- C1 de
Der große Klima-Zyklus seit 900 Millionen Jahren
en The great climate cycle for 900 million years
fr Le grand cycle climatique depuis 900 millions d'années - C2 de
"Snowball Earth" vor 800 bis 700 Millionen Jahren
en "Snowball Earth" 800 to 700 million years ago
fr "Snowball Earth" il y a 800 à 700 millions d'années - C3 de
CO₂ Konzentration und Temperatur vor 600 Millionen Jahren
en CO₂ concentration and temperature 600 million years ago
fr Concentration et température de CO₂ il y a 600 millions d'années - C4 de
Klima vor 500 Millionen Jahren
en Climate 500 million years ago
fr Le climat il y a 500 millions d'années - C5 de
Klima vor 100 Millionen Jahren (zur Zeit der Dinosaurier)
en Climate 100 million years ago (at the time of the dinosaurs)
fr Climat il y a 100 millions d'années (à l'époque des dinosaures) - C6 de
Begin der neuen großen Eiszeit vor 2,5 Millionen Jahren
en The new great ice age began 2.5 million years ago
fr La nouvelle grande période glaciaire a commencé il y a 2,5 millions d'années
- D1 de
Die aktuelle Eiszeit seit 500'000 Jahren
en The current ice age for 500'000 years
fr L'âge glaciaire actuel depuis 500'000 ans - D2 de
Klima vor 160'000 Jahren
en Climate 160'000 years ago
fr Climat il y a 160'000 ans - D3 de
Entwicklung seit 100'000 Jahren
en Development for 100'000 years
fr Développement depuis 100'000 ans
- E1 de
Aussterben der Neandertaler vor ca. 40'000 Jahren
en Extinction of the Neanderthals approximately 40'000 years ago
fr Extinction des Néandertaliens il y a environ 40'000 ans
- F1 de
Klima vor 25'000 Jahren - Die letzte Eiszeit
en Climate 25'000 years ago - the last ice age
fr Le climat il y a 25'000 ans - la dernière période glaciaire
- G1 de
Von der letzten Eiszeit bis heute
en From the last ice age to today
fr De la dernière période glaciaire à aujourd'hui - G2 de
Klima vor 10'000 Jahren bis heute - Das Holozän
en Climate 10'000 years ago until today - the Holocene
fr Le climat il y a 10'000 ans jusqu'à aujourd'hui - l'Holocène - G3 de
Klima im Laufe der Geschichte der Menschheit
en Climate throughout human history
fr Le climat à travers l'histoire humaine - G4 de
Die Minoische Warmzeit
en The Minoan Warm Period
fr La période chaude minoenne - G5 de
Völkerwanderungszeit (Kelten)
en Migration Period (Celts)
fr Période de migration (Celtes) - G6 de
Das Römische Klimaoptimum /
Die letzten 2000 Jahre
en The Roman climate optimum / The last 2000 years
fr L'optimum climatique romain / Les derièeres 2000 années - G7 de
Pessimum der Völkerwanderungszeit (Goten)
en Pessimum of the Migration Period (Goths)
fr Pessimum de la période de migration (Goths)
- G8 de
Das Mittelalter
en Middle Ages
fr Moyen Âge
- G8 A de
Die Mittelalterliche Warmzeit und die Kleine Eiszeit
en Medieval Warm Period and the Little Ice Age
fr L'optimum climatique médiéval et le petit âge glaciaire
- G8 B de
Die Mittelalterliche Warmzeit (ca. 900 - 1350)
en The Medieval Warm Period
fr L'optimum climatique médiéval
- G9 de
Klimawandel seit der Kleinen Eiszeit
en Climate change since the Little Ice Age
fr Changement climatique depuis le petit âge glaciaire
- H Heute
- H1 de
Klima heute
en The climate today
fr Le climat aujourd'hui
- I Zukunft
- I1 de
Klima in der Zukunft
en Climate in the future
fr Climat dans le futur - I2 de
Klima-Zyklen und ihre Extrapolation in die Zukunft
en Climate cycles and their extrapolation into the future
fr Cycles climatiques et leur extrapolation dans le futur - I3 de
Neue Eiszeit / New Ice Age
en New Ice Age
fr Nouvelle période glaciaire
⇧ de Text en Text fr Texte
⇧
A Klimatologie / Paläoklimatologie
en Climatology /Paleoclimatology
fr Climatologie / paléoclimatologie
- A1 de Allgemein / en General / fr Générale
- A2 de Begriffe und Definitionen en Terms and definitions fr Termes et définitions
- A3 de
Was ist Klima? / Unterschied zwischen Klima und Wetter
en What is climate? / Difference between climate and weather
fr Qu'est-ce que le climat? / Différence entre le climat et la météo - A4 de
Mitteltemperaturen
en Medium temperatures
fr Températures moyennes - A5 de
Proxydaten
en Proxy data
fr Données proxy
- A6 de
Klimawandel
en Climate Change
fr Changement climatique - A7 de
Klimazeiten (Klimaperioden)
en Climate Periods
fr Periodes climatiques - A8 de
Historische Daten zum Klima und zum "Treibhauseffekt"
en Historical data on the climate and the "greenhouse effect"
fr Données historiques sur le climat et «l'effet de serre»
- A9 de
Klimaänderungen der Vergangenheit
en Past climate changes
fr Changements climatiques passés - A10 de
Kulturen
en Civilisations
fr Civilisations
de Text en Text fr Texte
↑
A1 Allgemein
en General
fr Générale
Mit folgenden Links wird von anderen Webseiten auf diese Seite verwiesen:
| de | en | fr |
|---|---|---|
|
Klima Geschichte Allgemein |
Climate History General |
Histoire du climat Générale |
![]()
![]()

| de | en | fr |
|---|---|---|
|
Neue Kälteperiode Eiszeiten & Warmzeiten |
New Cold Period Ice Ages & Warm Periods |
Nouvelle periode froide Glaciations & periodes chaudes |
| de | en | fr |
|---|---|---|
| Klimawandel: Ursachen | Climate change: Causes | Changement climatique: Causes |
| Solarer Einfluss in der Klima-Geschichte | Solar impact in Climate History | Impact solaire dans l'histoire du climat |
| de | en | fr |
|---|---|---|
|
Klima: Wandel Klima-Beobachtungen Korrelationen mit der Sonne |
Climate: Change Climate Observations Correlations with the Sun |
Climat: Changement Observations sur le climat Corrélations avec le soleil |
Mit folgenden Links wird von anderen Webseiten auf diese Seite verwiesen:
| de | en | fr |
|---|---|---|
|
Klima Geschichte Klimatologie / Paläoklimatologie |
Climate History Climatology /Paleoclimatology |
Histoire du climat Climatologie / paléoclimatologie |
de Verzeichnis en Contents fr Sommaire
↑
A2 Begriffe und Definitionen
en Terms and definitions
fr Termes et définitions
|
|
|
|
|
|
↑
A3 Was ist Klima? / Unterschied zwischen Klima und Wetter
en
What is climate? / Difference between climate and weather
fr
Qu'est-ce que le climat? / Différence entre le climat et la météo
|
|
Unterscheidung zwischen Klima und Wetter:
|

de Definitionen:
-
Wetter ist das, was man erlebt, wenn man gerade jetzt draußen steht.
Es ist eine Kombination tausender Variablen, alles von kosmischer Strahlung aus den Tiefen des Weltalls bis zu geothermischer Wärme am Grund der Ozeane.
-
Klima ist das mittlere Wetter in einer Region oder die Änderung des mittleren Wetters mit der Zeit.
-
Nach andern Definitionen:
Klima ist definitionsgemäß eine Zusammenfassung des Wettergeschehens in einer bestimmten Region, gemittelt über 30 Jahre.
en Definitions:
-
Weather is what you experience if go and stand outside right now.
It's the combination of thousands of variables, everything from cosmic radiation in deep space to geothermal heat off the bottom of the oceans.
-
Climate is the average weather in a region or the change in the average weather over time.
-
Klimaskeptiker Info
de Was ist eigentlich Klima?
-
EIKE Europäisches Institut für Klima und Energie
Dr. Timothy Ball
2014-02-06 de Erwartung: Der 'Big Chill' dauert noch bis 2040
-
WND RADIO
Dr. Timothy Ball
2014-01-21 de 'Big chill' expected to stay until 2040 - Major cooling cycle could match 'Little Ice Age'
Was verstehen wir unter gutem oder schlechten Klima:
-
In den mittleren Breitengraden versteht man unter gutem Klima normalerweise ein Klima mit eher hohen Temperaturen.
-
Hohe Temperaturen ist oft ein Synonym für gutes Klima.
-
Wir sollten daher froh sein, wenn hohe Temperaturen angesagt sind.
-
Wir sollten aber zur Kenntnis nehmen, dass in den nächsten Jahren trotz weiter zunehmenden CO2 wegen der abnehnenden Sonnenaktivität eher mit tieferen Temperaturen gerechnet werden muss.
Die Ursache von hohen und tiefen Temperaturen:
-
Wenn zum Beispiel die Gletscher wegen hohen Temperaturen schmelzen, sagt dies noch nichhts über die Ursache der hohen Tempraturen aus.
-
Die gleiche Vorsicht ist auch bei der Beobachtung der Wolken angezeigt, denn tiefliegende Wolken haben eher eine kühlende, und hochliegende Wolken eine erwärmende Wirkung.
↑
A4 Mitteltemperaturen
en Medium temperatures
fr Températures moyennes
Lufttemperatur
-
Wikipedia
de
Lufttemperatur
en Surface air temperature
Tagesmitteltemperatur
- Wikipedia de Tagesmitteltemperatur
Jahresmitteltemperatur
- Wikipedia de Jahresmitteltemperatur
↑
A5 Proxydaten
en Proxy data
fr Données proxy
Mit folgenden Links wird von anderen Webseiten auf diese Seite verwiesen:
|
|
Proxydaten |
| ►Der Wasserplanet (Ernst-Georg Beck) | ▷Spuren aus der Vergangenheit - Proxydaten (Wayback ohne Bilder) |
|
Universität Heidelberg |
|
|
Wikipedia |
fr - |
|
de
Klimaarchiv
Ein Klimaproxy ist ein indirekter Anzeiger des Klimas, welcher in natürlichen Archiven wie Baumringen, Eiskernen, Korallen, See- oder Ozeansedimenten, Pollen oder menschlichen Archiven wie historischen Aufzeichnungen oder Tagebüchern aufgezeichnet wurde. Klimaproxies können also zur Rekonstruktion des Klimas der Vergangenheit herangezogen werden, als noch keine instrumentelle Aufzeichnung existierte. |
|
| Vademecum |
▶Proxydaten
▶Welt-Info |
-
Der Wasserplanet / Ernst-Georg Beck
de ▷Spuren aus der Vergangenheit - Proxydaten (Wayback ohne Bilder)- Direkte Messungen von Klimaparametern
- Historische Daten von Klimaindikatoren
- Eisbohrkerne
- Jahresringe von Bäumen (Dendrochronologie)
- Höhlenablagerungen (Speleotherme; Stalagmiten/Stalagtiten)
- Paläozeanographie (Ozeanische Sedimente, Planktonfossilien usw.)
Der Wasseplanet von Ernst-Georg Beck wurde anscheinend nach dem Ableben von Beck von der Zentrale für Unterrichtsmedien (ZUM) aus offensichtlich ideologischen Gründen mit sämtlichen Spuren zu Beck vom ZUM-Server gelöscht.
- Teile abschreiben und das Original entfernen ??
- die gleichen Links führen nun auf die neuen Seiten der Aktivisten des Verlags.
- Der Wasserplanet war das Lebenswerk von Ernst-Georg Beck, das er auch seinen ehemaligen Schülern hinterlassen wollte.
▶Der Wasserplanet (Ernst-Georg Beck)
|
Ernst-Georg Beck *1948 †2010-09-21 |
Dipl. Biologe, Biesheim, Frankreich
|
-
Universität Heidelberg
Blättern im Buch der Klimageschichte
2007-03 de Stalagmiten zeugen vom Klima der letzten Jahrtausende
Nicole Vollweiler und Augusto ManginiErfolgt die Erderwärmung schneller als vorhergesagt?
Oder wird es nicht wärmer, sondern immer kälter?
Ohne einen Blick zurück lassen sich auch die Klimafragen der Zukunft nicht beantworten.
Zeugen des Klimageschehens der Jahrtausende sind Stalagmiten.
Von ihnen lässt sich beispielsweise erfahren, wie das Klima war, als Hannibal die Alpen überquerte.
Und sie weisen darauf hin, ob wir künftig die Badehose oder doch besser die Schneestiefel einpacken sollten.
Im Buch der Klimageschichte zu blättern, ist ein spannendes Unterfangen.
Denn um das Klima der Gegenwart und seine künftige Entwicklung zu verstehen, muss man das aktuelle Geschehen in die Geschichte des Klimas einordnen.
Das gelingt umso besser, je mehr Informationen und Details über das Klima der Vergangenheit bekannt sind.
Dies zu erforschen, ist Aufgabe der Paläoklimatologie.
Klima-"Archive" ermöglichen Paläoklimatologen den Blick zurück
und erlauben es beispielsweise, die Temperatur oder die Niederschlagsmengen längst vergangener Zeiten zu rekonstruieren.
Das Spektrum der verfügbaren Archive reicht von Eisbohrkernen über Baumringe, See- und Meeressedimente, Korallen und andere Kalkschalen bildende Organismen bis hin zu Pflanzenpollen.
Jeder dieser Klimazeugen der Vergangenheit belegt eine hohe Variabilität des Systems:
Auf allen Zeitachsen wird beispielsweise deutlich, dass die Temperatur im Laufe der Erdgeschichte starken Schwankungen unterworfen war.
Über große Zeiträume hinweg war es um einige Grad wärmer als heute.
Diese warmen Abschnitte (Greenhouse-Ären) wurden von ausgeprägten Kaltzeiten (Icehouse-Ären) unterbrochen.
Ein Beispiel ist die "Permokarbon-Vereisung" vor etwa 350 bis 250 Millionen Jahren.
In der Neuzeit der Erde ist das quartäre Eiszeitalter ein guter Beweis für die Variabilität des Klimas.
Vor etwa einer Million Jahren setzten Zyklen ein, die etwa 100 000 Jahre dauerten und in denen sich Kaltzeiten und wärmere Zeiten mit Temperaturunterschieden von bis zu zehn Grad Celsius abwechselten.
Ursächlich für diese natürlichen Klimaschwankungen sind Variationen in den Erdbahnparametern, die Lage der Kontinente, die Sonnenaktivität und zahlreiche weitere Faktoren.
Klimaveränderungen im "Holozän"
Solche natürlichen Klimaveränderungen sind jedoch nicht nur auf langen geologischen Zeitskalen, sondern auch in den letzten 10 000 Jahren, im "Holozän", nachweisbar.
Auch seit dem Ende der letzten Eiszeit ist das Klima keine konstante Größe:
Klima-Archive und historische Quellen berichten von wärmeren und kälteren Phasen mit mehr oder weniger Niederschlag.
Das "holozäne Klimaoptimum" vor etwa 8000 bis 6500 Jahren:
Zu den wichtigen Klima-Epochen, die in den meisten Archiven belegt werden konnten, zählt das "holozäne Klimaoptimum" vor etwa 8000 bis 6500 Jahren:
Damals wurden die Menschen sesshaft und begannen, Ackerbau zu treiben.
Das "römerzeitlichen Klimaoptimums"
Während des "römerzeitlichen Klimaoptimums" vor etwa 2000 Jahren überquerte Hannibal mit seinen Elefanten die im Winter nur wenig vereisten Alpen.
Das "mittelalterliche Klimaoptimum"
Auf das römerzeitliche folgte das "mittelalterliche Klimaoptimum".
Zwischen diesen drei Warmphasen
gab es immer wieder deutliche Abkühlungen, zum Beispiel vor 6000 bis 5000 Jahren oder während der "kleinen Eiszeit", die vor rund 150 Jahren endete.
Die paläoklimatologische Forschung versucht, diese Schwankungen exakt zu beschreiben,
zeitlich abzugrenzen und zu klären, ob es sich um regionale oder globale Phänomene handelt.
Ein Klima-Archiv, das sich in den letzten Jahren für diese Zwecke als zunehmend geeignet erwiesen hat, sind Tropfsteine aus Höhlen, vor allem Stalagmiten:
Die Sauerstoff- und Kohlenstoffisotope im Kalk dieser Tropfsteine speichern klimarelevante Daten; darüber hinaus lassen sie sich exakt datieren.
In der Forschungsstelle Radiometrie der Heidelberger Akademie der Wissenschaften untersucht unsere Arbeitsgruppe seit vielen Jahren Stalagmiten aus den unterschiedlichsten Regionen der Erde.
Entstehung von Stalagmiten
Stalagmiten entstehen in Höhlen, wenn sich eindringendes Niederschlagswasser auf seinem Weg durch die Bodenhorizonte mit Kohlendioxid anreichert und Kalkgestein löst.
Aus dieser Lösung gast Kohlendioxid im Innern der Höhle wieder aus, und der Kalk scheidet sich in Form von "Sintern" (Ablagerungen) ab.
Viele Stalagmiten wachsen recht gleichmäßig über längere Zeiträume und lassen in größere Abschnitte der Klimageschichte einblicken.
Thorium-Uran-Methode
Mit der Thorium-Uran-Methode lässt sich das Alter der Stalagmiten bestimmen:
Im Tropfwasser befinden sich Spuren von gelöstem radioaktiven Uran, es wird in das Kalkgitter des Stalagmiten eingebaut und zerfällt dort im Laufe der Zeit zu Thorium.
Mit einem Massenspektrometer lassen sich die Isotope messen und das Alter einer Probe sehr genau bestimmen.
Eine Probenentnahme erfolgt jedoch nicht nur zur Altersbestimmung, sondern auch, um die stabilen Isotope 18O/16O und 13C/12C zu analysieren.
Vor allem die Sauerstoffisotope können Auskunft darüber geben, welche Temperatur und welche Niederschlagsverhältnisse während der Bildungszeit des Stalagmiten vorherrschten:
Abhängig von den Klimabedingungen werden sie in unterschiedlichen Verhältnissen in den Kalk eingebaut.
Die "Spannagel-Höhle" bei Hintertux in Tirol

 Rekonstruktion des Klimas:
Die Auswertung der Proben aus drei hochalpinen Stalagmiten
und der Vergleich mit Holz- und Torffunden aus Schweizer Gletschern
erlauben es, eine Klimakurve für die letzten 9000 Jahre zu erstellen.

Unsere Proben entnehmen wir den Stalagmiten vieler Höhlen, eine besondere Stellung aber nimmt die "Spannagel-Höhle" bei Hintertux in Tirol ein.
Sie liegt 2500 Meter über dem Meeresspiegel und ist für die Klimaforschung ideal:
Die Temperatur im Innern der Höhle beträgt rund zwei Grad Celsius, weshalb kaum störende chemische Prozesse ablaufen und die Bildung des Stalagmitenkalkes im Gleichgewicht mit dem Tropfwasser stattfindet.
Dies hat den großen Vorteil, dass aus der Sauerstoff-Isotopie direkt Klimainformationen abgeleitet werden können.
Gemeinsam mit Innsbrucker Geologen ist es uns gelungen, das Klima der letzten 9000 Jahre zu rekonstruieren
(COMNISPA, siehe Abbildung auf Seite 6 links),
indem wir die Proben aus drei Stalagmiten analysierten, die alle aus demselben Gang der Spannagel-Höhle stammen.
Die Kurve zeigt eine deutliche Variabilität des Klimas mit
Warmphasen
vor 7500 bis 6500 Jahren (holozänes Klimaoptimum),
vor 3800 bis 3600 Jahren,
vor 2200 Jahren (römerzeitliches Klima-optimum)
und vor 1200 bis 700 Jahren (mittelalterliches Klimaoptimum).
Den Warmphasen gegenüber stehen kühlere Perioden
vor 7900 bis 7500 Jahren,
vor 5900 bis 5100 Jahren,
vor 3500 bis 3000 Jahren und
vor 600 bis 150 Jahren (kleine Eiszeit).
Der Vergleich mit weiteren alpinen Klimazeugen,
etwa Gletschern und Seespiegelständen, stützt die Interpretation der Klimakurve und bestätigt die Stalagmiten als Archiv für Niederschlag und Temperatur.
Einer der drei untersuchten Stalagmiten wuchs bis etwa 1950 und ermöglicht es, die aus den Sauerstoff-Isotopen gewonnenen Informationen über das Klima an aktuelle, direkt gemessene Daten anzubinden.
Aus mehreren Messdaten und rekonstruierten Werten wurde eine Transferfunktion aufgestellt, die es erlaubt, die Isotopie-Daten in absolute Temperaturwerte umzurechnen.
Daraus ergibt sich für die letzten 2000 Jahre eine Temperaturamplitude von etwa drei Grad Celsius mit Werten, die heute niedriger sind als während des mittelalterlichen Klimaoptimums.
Um festzustellen, ob die Ergebnisse möglicherweise nur auf das alpine Klimageschehen zutreffen,
haben wir überregionale Vergleiche vorgenommen.
Da bekannt ist, dass das Wettergeschehen in Europa maßgeblich von Prozessen über dem Nordatlantik beeinflusst wird, lag es nahe, sich eines Archivs - Sedimentkernen - aus diesem Raum zu bedienen.
In Sedimentkernen, die aus dem Nordatlantik stammen, findet man außer Partikeln mariner Herkunft auch Anteile, die eindeutig kontinentalen Ursprungs sind.
Sie werden mit Eisbergen, die sich von Landmassen wie Grönland lösen über das Meer verdriftet und gelangen, wenn das Eis taut, auf den Boden des Ozeans.
Finden sich solche Partikel in Sedimentkernen, muss man davon ausgehen, dass das Eis zum Ablagerungszeitpunkt mindestens bis in diese Breite vorgedrungen war.
Je südlicher sich Beimengungen kontinentaler Herkunft finden, desto kälter war es in der betreffenden Zeit.
Der Vergleich der alpinen Stalagmitenkurve mit den nordatlantischen Sedimenten ergab eine frappierende Übereinstimmung
(siehe Abbildung auf Seite 6 rechts):
Beide Zeitreihen weisen eine außergewöhnlich hohe Korrelation auf.Es wird deutlich, dass die Stalagmitenkurve als Temperatursignal zu interpretieren ist und dass es sich um einen Rekord von überregionaler Bedeutung handelt.
Der Zusammenhang des Klimas über dem Nordatlantik mit dem in Europa
lässt sich mithilfe der "nordatlantischen Oszillation", kurz NAO, beschreiben.
Sie ist ein Maß für den Druckunterschied zwischen dem Islandtief im Norden und dem Azorenhoch im Süden und steuert die Witterung im europäischen Winter entscheidend.
Ist der Druckunterschied groß, führt dies zu einer Westwindlage mit feuchten, milden Wintern in Nord- und Mitteleuropa (NAO+).
Bei einer abgeschwächten Druckdifferenz hingegen herrschen kalte und trockene Bedingungen vor (NAO-).
Da die Stalagmiten in Spannagel auch die Änderung des Winterniederschlags aufzeichnen, besteht eine Verbindung des Isotopensignals zur nordatlantischen Oszillation.
Die alpine Stalagmitenkurve liefert also eine Zeitreihe der nordatlantischen Oszillation.
Dabei entsprechen Phasen mit niedriger Sauerstoff-Isotopie den NAO+-Situationen.
Auch andere Archive zeigen gute Übereinstimmungen mit der Stalagmiten-Kurve.
So belegt der Vergleich mit einem Stalagmiten-Rekord aus dem schwäbischen Blautopf den Zusammenhang zum Klimageschehen in Mitteleuropa.
Der Überlappungsbereich der beiden Kurven beginnt vor 9000 und endet vor 3500 Jahren.
In der Abbildung auf Seite 8 (links) ist ein kleinerer Zeitabschnitt herausgegriffen, um die hohe Auflösung und die gute Übereinstimmung zu zeigen:
Es wird deutlich, in welch kleinem Zeitraum die Temperatur beachtlich schwankte.
Überträgt man die Temperaturabschätzungen aus der Untersuchung desjenigen Spannagel-Stalagmiten, der bis nahezu in die Gegenwart gewachsen ist, auf diese Werte, ergibt sich für den dargestellten Zeitraum von 800 Jahren eine Temperaturamplitude von etwa ein Grad Celsius.
Bemerkenswert ist, dass demnach beispielsweise in zwei Jahrhunderten (8200 bis 8000 vor heute) eine Erwärmung von etwa einem Grad Celsius stattgefunden hat.
Die hohe Auflösung der Stalagmitenkurven ermöglicht es somit, abrupte natürliche Klimaschwankungen nachzuweisen.
Dass das Klima bereits in historischer Zeit den Menschen stark beeinflusste,
wird deutlich, wenn man Klimakurven und geschichtliche Daten zum Aufblühen und Niedergehen von Kulturen gegenüberstellt.
Die historische Siedlung Troja bietet dafür optimale Voraussetzungen, da die Archäologie hier schon seit über 130 Jahren intensive Forschung betreibt und genaue Erkenntnisse zu den verschiedenen Siedlungsschichten mit entsprechend exakten Datierungen vorliegen.
Vor allem Tübinger Archäologen haben detaillierte Rekonstruktionen für die verschiedenen Epochen entwickelt.
Erste Siedlungsspuren weisen ein Alter von fast 5000 Jahren auf, nahezu 4000 Jahre dauerte die Geschichte Trojas.
Die Siedlungstätigkeit hatte nicht durchgängig dieselbe Intensität, es zeigen sich neben Blütephasen immer wieder Unterbrechungen.
Jenes Troja, das Homer in seiner "Ilias" beschreibt, ist mit ziemlicher Sicherheit der Zeit vor 3750 bis 3300 Jahren zuzuordnen: eine große Ansiedlung mit Burgen, Mauern und einer weitläufigen Unterstadt.
Warum die erfolgreiche Epoche Trojas so abrupt endete, ist nach wie vor nicht geklärt.
Neben Erdbeben und Kriegen kommt hier wohl auch das Klima ins Spiel.
Bekannt ist, dass die Trojaner über ein ausgeklügeltes Wassersystem mit einer künstlich angelegten Quellhöhle verfügten.
Sinter, die sich an den Wänden dieser Höhle abgelagert haben, konnten mit der Thorium-Uran-Methode auf ein Alter von 4500 Jahren datiert werden, was bedeutet, dass die Höhle mindestens seit diesem Zeitpunkt existiert.
Damals haben die Trojaner die Wasserversorgung für ihre Stadt geplant.
Wie für den Mittelmeerraum typisch, fallen auch in der Gegend um Troja die Niederschläge vorwiegend im Winter und füllen die Grundwasserspeicher auf.
Aktuell liegen die Jahresniederschläge um 600 bis 700 Milliliter - eine ausreichende, aber nicht üppige Wasserversorgung, weshalb es schnell zu einem Wassermangel kommt, gehen die Niederschlagsmengen zurück.
Für eine antike Stadt, die von der Versorgung durch die umliegende Landwirtschaft abhängt, bringt ein Wassermangel weit reichende Probleme mit sich.
Es ist also durchaus plausibel, das Aufblühen von Troja auch mit dem Klima in Zusammenhang zu bringen.
Der Vergleich der Haupt-Siedlungsphasen von Troja mit der alpinen Stalagmitenkurve (Abbildung auf Seite 8 rechts ) stützt diese Vermutung.
Die Blütezeiten der Stadt fallen zusammen mit den Abschnitten, für welche die Stalagmitenkurve viel Niederschlag angibt.
Eine Abnahme der Siedlungstätigkeit beziehungsweise Unterbrechungen geht mit niederschlagsarmen Zeiten einher.
Gerade am Ende des berühmten "Troja VI" geht der Niederschlag maßgeblich zurück und könnte somit verantwortlich gewesen sein für den abrupten Niedergang.
Nicht nur in Troja, sondern auch in Mykene und bei den Hethitern gingen zu dieser Zeit Epochen zu Ende.
Auch das spricht für einen überregionalen Auslöser der Veränderungen.
Die Vergleiche der alpinen Stalagmitenkurve mit anderen Archiven könnte fortgesetzt werden.
Mittlerweile existiert ein Netz von Stalagmiten-Archiven, das über die ganze Erde verteilt ist und es ermöglicht, das globale Klimageschehen der Vergangenheit zu beschreiben.
Die Ende des Jahres 2005 von der Deutschen Forschungsgemeinschaft eingerichtete Forschergruppe "Daphne" betreibt Grundlagenforschung zum Verständnis der Prozesse, die bei der Stalagmitenbildung ablaufen.
In Heidelberg, Bochum, Trient und Innsbruck arbeiten Forscher daran, den Einsatz von Stalagmiten als Klimaarchive zu optimieren.
Daneben laufen zahlreiche Einzelstudien in diversen Regionen von Europa, in der Karibik und Patagonien.
Die Klimarekonstruktionen des Weltklimarats (IPCC) beruhen maßgeblich auf den Untersuchungen von Baumringen.
Zahlreiche Veröffentlichungen lassen jedoch vermuten, dass die Variabilität des Klimas im Winter deutlich höher ist als im Sommer.
Da die Bäume im Winter ruhen, zeichnen sie diese Veränderungen nicht auf.
Das führt dazu, dass die Prognosen des IPCC die natürliche Klimavariabilität unterschätzen.
Andererseits darf ein höheres Bewerten der natürlichen Schwankungen nicht dazu führen, sorglos in die Zukunft zu schauen.
Eine Möglichkeit ist, dass die Erwärmung noch schneller abläuft als vorhergesagt, sodass sich der Mensch früher als erhofft auf veränderte Lebensbedingungen einstellen muss.
Aber auch eine in absehbarer Zeit erfolgende Abkühlung des Klimas kann nicht ausgeschlossen werden.
Deren Folgen dürften als ebenso dramatisch empfunden werden wie die der Erderwärmung.
| Augusto Mangini |
Prof. Dr.,
Universität Heidelberg, Institut für Umweltphysik Leiter der Forschungsstelle Akademie Radiometrische Altersbestimmung von Wasser und Sedimenten ▶Augusto Mangini: Who is who (Skeptiker) ▶Augusto Mangini: Video (Präsentationen) ▶Ausschluss und Maulkorb für Kritiker (Das passiert mit Kritikern des IPCC) |
↑
A6 Klimawandel
en Climate Change
fr Changement climatique
- Klimawandel - Allgemein
- Bedeutet Erwärmung eine Katastrophe?
- Was wird eine Abkühlung für Auswirkungen haben?
↑ Klimawandel - Allgemein
|
|
||||||||||||||||||||||||||||||||||||||||||||||||||||||||||||
|
|||||||||||||||||||||||||||||||||||||||||||||||||||||||||||||
↑ Bedeutet Erwärmung eine Katastrophe?
Was verstehen wir unter gutem oder schlechten Klima:
-
In den mittleren Breitengraden versteht man unter gutem Klima normalerweise ein Klima mit hohen Temperaturen.
-
Hohe Temperaturen ist oft ein Synonym für gutes Klima.
-
Wir sollten daher froh sein, wenn hohe Temperaturen angesagt sind.
-
Klimaskeptiker Info
de Bedeutet Erwärmung eine Katastrophe?
↑ Was wird eine Abkühlung für Auswirkungen haben?
| de | en | fr |
|---|---|---|
| Neue Kleine Eiszeit | New Little Ice Age | Nouveau petit âge glaciaire |
| Aufrufe | Appeals | Appels |
| de | en | fr |
|---|---|---|
|
Neue Kälteperiode Kaltzeit |
New Cold Period Cold Period |
Nouvelle periode froide Periode froide |
| Voraussagen | Predictions | Prédictions |
| Kälte: Warnungen | Cooling: Warnings | Refroidissement: Avertissements |
| Erwärmung: Entwarnung | Warming: All-Clear | Réchauffement: Fin de l'alerte |
| Eiszeiten | Ice Ages | Glaciations |
↑
A7 Klimazeiten (Klimaperioden)
en Climate Periods
fr Periodes climatiques
↑
Allgemein
en General
fr Générale
|
|
| de |
▶ Internet-Terror: Manipulation von Wikipedia durch einen Administrator ▶ Das Lexikon der Lügen ▶ Vom Onlinelexikon zur Propagandamaschine: Zensur, Einschüchterung und arglistige Täuschung ▶ Wikipedia: Klima-Fälscher Connolley: Der Mann, der unser Weltbild umschrieb ▶Die dunkle Seite von WIKIPEDIA: EIKE Zensur - kurz und knapp [Who is who (Skeptische Institute): EIKE; Wikipedia: Websites, Opfer: EIKE, Manipulatoren: Andol] |
|||||
|---|---|---|---|---|---|---|
| en |
▶ At Wikipedia, one man engineers the debate on global warmingator |
|||||
| fr |
▶ A Wikipedia, un homme dirige le débat sur le réchauffement climatique et à sa manière |
Historische Tatsache:
- Klimawandel mit Temperaturänderungen hat es schon immer gegeben und wird es immer geben.
Warm:
-
Es ist bereits mehrfach in der Geschichte erheblich wärmer gewesen als jetzt.
-
Die Wikinger, die vor über 1000 Jahren Grönland entdeckten, haben es wegen der damals herrschenden höheren Temperaturen "Grünland", also Grönland genannt.
Kalt:
Toleranz früher und heute:
-
NZZ
2004-01-24 de Die Kleine Eiszeit, eine frühneuzeitliche KlimakatastropheBemerkung:
Lesen Sie den Artikel bis zum Schluss, in dem die Frage gestellt wird, ob heute die Politiker, Umweltschützer, Geschäftsleute, Profiteure und Mitläufer mit der "Klimakatastrophe" die gleiche Hexenjagd auf CO2-Verursacher durchführen, wie dies im späten Mittelalter mit den "Schuldigen an der Eiszeit" geschehen ist.
-
Burghard Schmanck de Realsatire?
(Es soll auch an diejenigen gedacht werden, die selbst nachdenken und ihren Arbeitsplatz verlieren, wenn sie nicht die offizielle Auffassung vertreten)
| de | en | fr |
|---|---|---|
|
Klima-Diskurse: Diskussionen Ausschluss und Maulkorb für Kritiker |
Climate Discurses: Discussions Exclusion of critics |
Clima discurs: Discussions Exclusion des critiques |
↑
Eiszeiten
en Ice age
fr Glaciation
|
|
![]()
![]() Der große Klima-Zyklus mit einer Periode von 150 bis 180
Millionen Jahren
Der große Klima-Zyklus mit einer Periode von 150 bis 180
Millionen Jahren
Die Eiszeiten waren so charakteristisch, dass sie jeweils eigene Namen
erhielten.
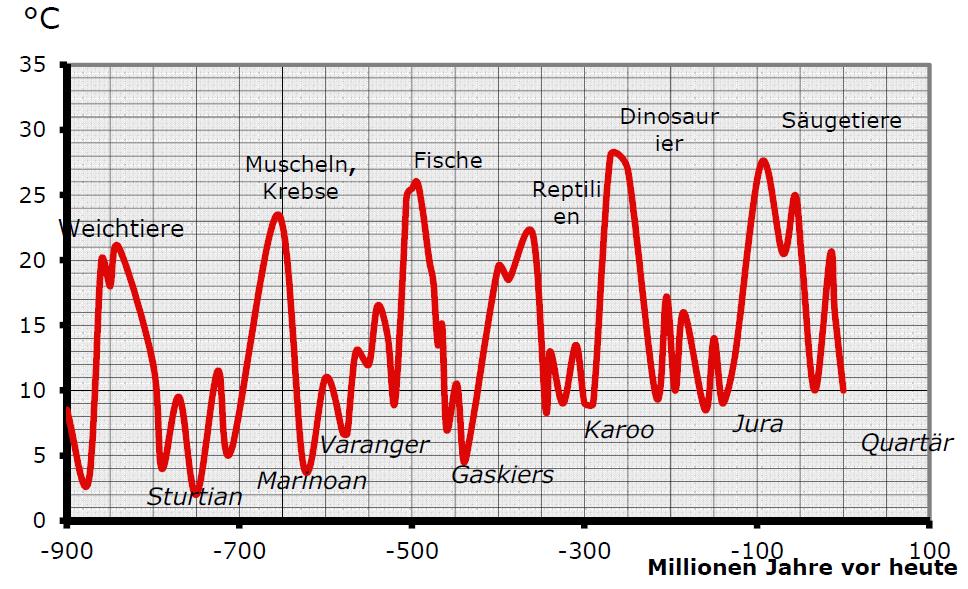
Alle etwa 200 Millionen Jahre
In der Vergangenheit dauerten etwa alle 200 Millionen Jahre
Warmzeiten
die Warmzeiten jeweils 30 bis 50 Millionen Jahre
Jede Warmperiode führte zu einer weiteren Entwicklungs-Stufe des Lebens auf der Erde.
Eiszeiten
Dazwischen lagen schwere und lange Eiszeiten von jeweils 50 bis 100 Millionen Jahren Dauer
mit Temperaturen unter 12°C.
| de | en | fr |
|---|---|---|
|
Neue Kälteperiode Eiszeiten & Warmzeiten |
New Cold Period Ice Ages & Warm Periods |
Nouvelle periode froide Glaciations & periodes chaudes |
↑
Warmzeiten
en Warm periods
fr Périodes chaudes
-
Wikipedia
de
Warmzeit
en Interglacial
fr Période interglaciaire
Wir leben heute in einer Warmzeit eines Eiszeitalters
-
ESA Europäische Weltraumorganisation
de Heute: Wir leben im EiszeitalterWenig bewusst ist uns die Tatsache, dass wir in einem Eiszeitalter leben, dem quartären Eiszeitalter.
Es ist nicht das erste und wird auch nicht das letzte Eiszeitalter sein. Das sind Abschnitte der Erdgeschichte, in denen die mittlere Temperatur so weit absank, dass gewaltige Flächen mit einem dicken Eispanzer überzogen wurden sowie Dauerfrostböden und Meereis auftraten.
Die genannten Eigenschaften treffen auf die heutige Erde zu: Gegenwärtig sind rund 16 Mill. km2 der Landoberfläche unter Inlandeis und Gletschern begraben. Das sind fast 11 Prozent des Festlandes. Wird der - teilweise bis weit über 1500 Meter mächtige - Dauerfrostboden in Eurasien und Nordamerika hinzugerechnet, so sind etwa 37 Mill. km2 der Landflächen vereist. Das ist nahezu ein Viertel der Festlandsfläche.
Aus der Erdgeschichte ist bekannt, dass in den letzten 950 Millionen Jahren mindestens sechs bedeutende Eiszeitalter auftraten. Jede dieser Perioden ist durch einen wellenartigen Wechsel von Kaltzeiten (sehr große Gebiete der Erde sind vereist) und Warmzeiten (ein kleiner Teil der Erde ist vereist) gekennzeichnet.
Die letzte Kaltzeit endete vor 11 000 Jahren und es begann eine neue Warmzeit.
Wir leben also heute in einer Warmzeit des quartären Eiszeitalters. Sie wird von Geologen als Holozän bezeichnet. Erst wenn kein Eis mehr auf der Erdoberfläche auftritt, hat das quartäre Eiszeitalter sein Ende gefunden.
↑
A8 Historische Daten zum Klima und zum "Treibhauseffekt
en
Historical data on the climate and the "greenhouse effect"
fr
Données historiques sur le climat et «l'effet de serre»
Mit folgenden Links wird von anderen Webseiten auf diese Seite verwiesen:
▶Historische Daten zum Klima und zum "Treibhauseffekt
⇧ Welt-Info
|
|
Historische Daten zum Klima und zum "Treibhauseffekt" |
| ►Der Wasserplanet (Ernst-Georg Beck) | ▷Historische Daten zum Klima und zum "Treibhauseffekt" (Wayback ohne Bilder) |
| Wikipedia |
de
Historische Klimatologie en Historical climatology fr Climatologie historique |
| Vademecum |
▶Historische Daten zum Klima und zum "Treibhauseffekt
▶Welt-Info |
| Siehe auch: |
▶Solarer Einfluss in der Klima-Geschichte
▶Klima-Beobachtungen ▶Korrelationen mit der Sonne ▶Eiszeiten & Warmzeiten ▶Proxydaten |
⇧ de Allgemein en General fr Générale
| de | en | fr |
|---|---|---|
| Klimawandel: Ursachen | Climate change: Causes | Changement climatique: Causes |
| Solarer Einfluss in der Klima-Geschichte | Solar impact in Climate History | Impact solaire dans l'histoire du climat |
| de | en | fr |
|---|---|---|
|
Klima: Wandel Klima-Beobachtungen Korrelationen mit der Sonne |
Climate: Change Climate Observations Correlations with the Sun |
Climat: Changement Observations sur le climat Corrélations avec le soleil |
⇧ de Text en Text fr Texte
-
Der Wasserplanet / Ernst-Georg Beck
de ▷Historische Daten zum Klima und zum "Treibhauseffekt" (Wayback ohne Bilder)- Der Treibhauseffekt hat eine fast 200 jährige Geschichte
Der Wasseplanet von Ernst-Georg Beck wurde anscheinend nach dem Ableben von Beck von der Zentrale für Unterrichtsmedien (ZUM) aus offensichtlich ideologischen Gründen mit sämtlichen Spuren zu Beck vom ZUM-Server gelöscht.
- Teile abschreiben und das Original entfernen ??
- die gleichen Links führen nun auf die neuen Seiten der Aktivisten des Verlags.
- Der Wasserplanet war das Lebenswerk von Ernst-Georg Beck, das er auch seinen ehemaligen Schülern hinterlassen wollte.
▶Der Wasserplanet (Ernst-Georg Beck)▶Klimawandel-Einführung ▶Historische Daten zum Klima und zum "Treibhauseffekt
|
Ernst-Georg Beck *1948 †2010-09-21 |
Dipl. Biologe, Biesheim, Frankreich
|
↑
A9 Klimaänderungen der Vergangenheit
en Past climate changes
fr Changements climatiques passés
Mit folgenden Links wird von anderen Webseiten auf diese Seite verwiesen:
▶Klimaänderungen der Vergangenheit
|
|
▶Photovoltaik |
⇧ Welt-Info
|
|
Klimaänderungen der Vergangenheit | ||
| ►Der Wasserplanet (Ernst-Georg Beck) | de | ||
| Wikipedia |
|
||
| Vademecum |
▶Klimaänderungen der Vergangenheit
▶Welt-Info |
||
| Siehe auch: |
▶Solarer Einfluss in der Klima-Geschichte
▶Klima-Beobachtungen ▶Korrelationen mit der Sonne ▶Eiszeiten & Warmzeiten ▶Proxydaten |
⇧ de Allgemein en General fr Générale
-
Der Wasserplanet / Ernst-Georg Beck
de- Die letzten 10'000 Jahre
- Die letzten 450'000 Jahre
- Die letzten 100 Millionen Jahre
- Die letzten 600 Millionen Jahre
Der Wasseplanet von Ernst-Georg Beck wurde anscheinend nach dem Ableben von Beck von der Zentrale für Unterrichtsmedien (ZUM) aus offensichtlich ideologischen Gründen mit sämtlichen Spuren zu Beck vom ZUM-Server gelöscht.
- Teile abschreiben und das Original entfernen ??
- die gleichen Links führen nun auf die neuen Seiten der Aktivisten des Verlags.
- Der Wasserplanet war das Lebenswerk von Ernst-Georg Beck, das er auch seinen ehemaligen Schülern hinterlassen wollte.
▶Der Wasserplanet (Ernst-Georg Beck)
-
Der Wasserplanet / Ernst-Georg Beck
de ▷Klimänderung heute (Wayback ohne Bilder)- Meßdaten (Thermometer Erde, Ballon und Satellit)
Der Wasseplanet von Ernst-Georg Beck wurde anscheinend nach dem Ableben von Beck von der Zentrale für Unterrichtsmedien (ZUM) aus offensichtlich ideologischen Gründen mit sämtlichen Spuren zu Beck vom ZUM-Server gelöscht.
- Teile abschreiben und das Original entfernen ??
- die gleichen Links führen nun auf die neuen Seiten der Aktivisten des Verlags.
- Der Wasserplanet war das Lebenswerk von Ernst-Georg Beck, das er auch seinen ehemaligen Schülern hinterlassen wollte.
▶Der Wasserplanet (Ernst-Georg Beck)
-
Ernst-Georg Beck
▷Temperaturdaten 1000 Jahre (Wayback ohne Bilder)
|
Ernst-Georg Beck *1948 †2010-09-21 |
Dipl. Biologe, Biesheim, Frankreich
|
-
Skyfall / Changement Climatique
2006-09-15 fr Une brève introduction à l'histoire du climat
⇧ de Text en Text fr Texte
-
Die kalte Sonne (Fritz Vahrenholt & Sebastian Lüning)
2015-01-23 de Großes Lob für ZDF Terra X-Doku "Klima macht Geschichte"ZDF Presseportal
2015-01-11/18 de Terra X: Klima macht Geschichte Zweiteilige DokumentationKlima macht Geschichte
2015-01-10 de
Teil 1,
de
Teil 2 (je ca. 43 Minuten)
de
Teil 1,
de
Teil 2 (je ca. 43 Minuten)
Der "Terra X"-Zweiteiler "Klima macht Geschichte" führt auf eine spannende Zeitreise von der Eiszeit bis ins 21. Jahrhundert.
Teil 1 zeigt, wie das Klima das Schicksal der frühen Gesellschaften mitbestimmt - vom Neandertaler bis zum alten Rom.
Teil 2 zeigt, wie das Klima das Schicksal der Gesellschaften ab der Antike mitbestimmt - vom Römischen Reich über die Französische Revolution bis zum Klimawandel heute.
Um 60 000 vor Christus
Um 60 000 vor Christus herrscht auf der Erde Klimachaos, verursacht durch schnelle Wechsel von Kalt- und Warmphasen.
Die Urzeitmenschen stecken mitten im Überlebenskampf.
Dem Neandertaler geht die Beute aus,
der Homo sapiens dringt auf der Suche nach neuem Lebensraum in dessen Revier ein und macht ihm die ohnehin schon knappen Ressourcen streitig.
Das Duell geht zugunsten von Homo sapiens aus.
In einer viele Jahrtausende dauernden Völkerwanderung erobert er jeden Winkel der Welt.
Am Ende der Eiszeit finden sie das Paradies
Seine Artgenossen finden das Paradies vor, als die zunehmende Kraft der Sonne das Ende der Eiszeit besiegelt.
Landflächen, Meere und Flüsse tauen auf, die Natur explodiert.
In Zentraleuropa, Asien und im Alten Orient entstehen beste Lebensbedingungen, die zu einer einmaligen Revolution in der Menschheitsgeschichte führen:
Aus Nomaden werden Sesshafte, aus Jägern und Sammlern Ackerbauer und Viehzüchter.
Beinahe zeitgleich entstehen Weizen-, Reis- und Maisanbau.
Die Gemeinschaften können plötzlich Überschüsse produzieren, sie entdecken die Arbeitsteilung und erfinden neue Handwerkstechniken.
Im anatolischen Göbekli Tepe wird der erste Tempel der Menschheit gebaut und in Jericho die älteste Stadt der Welt, während die Bewohner von Stonehenge etwa zeitgleich ihre Steinkreisanlage planen.
Um 6200 vor Christus
Doch die Warmzeit zeigt auch ihre Schattenseite.
Um 6200 vor Christus bahnt sich auf dem amerikanischen Kontinent Unheil an.
Für das Schmelzwasser des Agassizsees, der doppelt so groß wie Deutschland ist, gibt es kein Halten mehr. Es stürzt in den Atlantischen Ozean und stoppt die Warmwasserzufuhr des Golfstroms nach Europa. Zudem sorgt die Gletscherschmelze für ein gigantisches Ansteigen der Meere um weltweit 120 Meter. Die massive Bedrohung seines Lebensraums hat der Mensch nie vergessen. Das Gilgamesch-Epos beschreibt die "Sintflut" ebenso bildhaft wie die Bibel oder der Koran.Gewinner der globalen Gletscherschmelze
Gewinner der globalen Gletscherschmelze sind die Subtropen.
Dort sorgen Monsunregen für artenreiche Savannen mit großen Tierherden, Flüssen und Seen. Ihre Bewohner leben sorglos.Neue Phase - Neue Heimat
Die Gunstphase ist aber leider nicht von Dauer. Die Erdachse schiebt sich von der Sonne weg, und dem Monsun geht der Treibstoff aus. Im Rekordtempo entstehen die großen Wüsten der Erde. Tausende von Menschen sind auf der Flucht.
Blütezeit von Hochkulturen
An den Ufern des Nils mit seinen alljährlichen Überschwemmungen und dem gemäßigten Klima finden sie eine neue Heimat. Die Siedler legen den Grundstein für das ägyptische Empire, das über drei Jahrtausende die Geschichte beherrscht.
Die Ägypter sind aber nicht die einzigen Klimaprofiteure. Zwischen dem 20. und 40. Breitengrad erleben eine Reihe von Hochkulturen ihre Blütezeit, darunter die Mykener, die Minoer, die Thraker oder auch die Etrusker in Norditalien.
Sie alle huldigen der Sonne - der universellen, lebenspendenden Kraft.
Um 1200 vor Christus
Um 1200 vor Christus stürzt lang anhaltende Trockenheit die Welt in dunkle Zeiten. Sie sind so finster, dass sie als "Dark Ages der Antike" in die Geschichte eingehen.
Die Großreiche implodieren, denn Hunger und Durst führen vermehrt zu Konflikten und Kriegen um fruchtbare Gebiete.
700 vor Christus - Rom wird die neue Weltmacht
Erst um 700 vor Christus stellt das Klima erneut die Weichen mit günstigen Auswirkungen für das Leben auf der Erde.
In Europa wittert Rom seine Chance und steigt in kürzester Zeit zur Weltmacht auf, die alles bisher Dagewesene in den Schatten stellt.
Mit Brot und Spielen, einer straffen Verwaltung und umfassenden Bürgerrechten legen die Römer den Grundstein für die moderne Zivilisation.
Römische Wärmeperiode um das Jahr Null
Baumringuntersuchungen belegen, dass die Erde ab dem 2. Jahrhundert vor Christus eine einmalige Gunstphase erlebt, die sich unmittelbar auf die Entwicklung des Römischen Reiches auswirkt.
Gleichbleibend milde Temperaturen mit regelmäßigen Niederschlägen sichern die Versorgung der Menschen und liefern die Grundlage für den kulturellen und militärischen Siegeszug der Supermacht.
In jener Zeit erreicht das Römerreich seine größte Ausdehnung und herrscht über ein Viertel der damals bekannten Welt.
Sogar die Ägypter werden von Rom unterjocht, über 300 Jahre dient ihr Land als Kornkammer für rund 50 Millionen Menschen des Riesenreiches.
Kälterperiode der Völkerwanderungszeit um 500 n. Chr.
Doch dann schwingt das Klima um.
Zunehmend strenge Winter verschärfen die Bedrohung derAußengrenzen des Imperiums. Rhein und Donau frieren zu und werden zu natürlichen Einfallstoren.
In einer großen Völkerwanderung drängen 406 nach Christus 80 000 Germanen in das Römische Reich ein.
Sie alle sind Klimaflüchtlinge, getrieben vom Hunger.Beweise für ihren Nahrungsmangel finden Forscher in den Knochen und im Mageninhalt von Moorleichen aus dem heutigen Dänemark.
Es ist ein dunkles Zeitalter, aber nichts im Vergleich zu dem Klimaschock, den die Erde im Frühjahr 536 nach Christus erlebt.
Überall auf der Welt notieren Chronisten, dass sich der Himmel plötzlich verdunkelt habe, die Temperaturen ständig sanken und die Sonne für mehr als 18 Monate hinter einem Wolkenschleier verschwunden sei.
Auf den Feldern gehen die Ernten ein.
Im mittelamerikanischen El Salvador finden Klimaforscher zum ersten Mal den Verursacher der beschriebenen Krise:
Es ist der Vulkan Ilopango. Bei seinem Ausbruch schleudert der feuerspeiende Riese so viel Asche in die Stratosphäre, dass eine Kettenreaktion ausgelöst wird.
Sie beginnt mit einem dichten Ascheschleier, der die Erde vollständig umhüllt.
Darauf folgt ein vulkanischer Winter, der eine weltweite Klimaveränderung herbeiführt, die nicht nur Hungersnöte verursacht, sondern auch Seuchen Vorschub leistet.
Besonders die Pest greift rasend schnell um sich.
Innerhalb kürzester Zeit rafft der Schwarze Tod Millionen Europäer dahin.
Mittelalterliche Wärmperiode um 1000 n. Chr.
Um das Jahr 1000 weist die Sonne ihre höchste Aktivität seit 300 Jahren auf und beginnt, die Erde wieder aufzuheizen.
Die Eisschicht auf der Nordsee schmilzt und ermöglicht es den Völkern des Nordens, neue Wege zu ergründen.
Die Wikinger stechen in See, erobern Irland, England und Schottland.
Sie besiedeln Inseln, die bisher vom Eis umschlossen waren, und segeln weit vor Kolumbus bis nach Amerika.Überhaupt wird Europa von der Sonne bis ins Hochmittelalter hinein begleitet. Die Natur explodiert.
Das machen sich die Gesellschaften zu Nutze und treiben den Ackerbau voran.
Sie steigern ihre Erträge, die Bevölkerung wächst kontinuierlich, und aus kleinen Handelszentren entwickeln sich große Städte.
Dreiviertel aller deutschen Städte stammen aus der Phase des hochmittelalterlichen Klimaoptimums.
Kleine Eiszeit um 1500 n. Chr.
Anfang des 15. Jahrhunderts bricht die Kleine Eiszeit an.
Schnell entpuppt sie sich als die härteste Kaltphase, die Europa je erlebt hat.
Missernten, Naturkatastrophen und die Rückkehr der Pest führen zu gesellschaftlichen und politischen Krisen. Hexenverfolgung, Dreißigjähriger Krieg und die Französische Revolution entbrennen vor dem Hintergrund der drei Jahrhunderte andauernden Welt des Mangels.
Moderne Wärmeperiode nach 1850.
Erst etwa 1850 ist die Kleine Eiszeit endgültig vorüber.
In einer neuen, stabilen Klimaphase macht der Mensch einen Quantensprung.
Die Industrielle Revolution läutet das Zeitalter der Maschinen ein.
Technische Erfindungen machen den Menschen immer unabhängiger von den universellen Klimazyklen.
Doch mit dem Fortschritt hat der Mensch auch begonnen, die Weichen für die Zukunft der Erde zu stellen.
Plötzlich ist es die moderne Gesellschaft, die das uralte System von globalen Kalt- und Warmphasen empfindlich stört.
Wie groß der Einfluss auf das Weltklima tatsächlich ist, darüber streiten die Forscher.
Bemerkungen:
Im 1000 Jahrestakt: Sonnenaktivität als eine der treibenden Kräfte
Ein Warm-Kalt-Warm-Wechsel im 1000-Jahrestakt.
Die Sonnenaktivität als eine der treibenden Kräfte hinter dieser Zyklik wird explizit genannt.
Die Warmzeiten werden korrekt als blühende "Klimaoptima" dargestellt,
die Kaltzeiten hingegen brachten Tod und Verderben.
Deutlicher gehts nicht.
Ein Lob auch an die Terra X-Redaktion und das ZDF, das diese Doku
ermöglicht hat.
Schwache Sonne und Vulkanausbrüche
Bei so viel Licht, gibt es natürlich auch etwas Schatten.
Vulkanausbrüche sind wohl kaum der Hauptauslöser der beiden dargestellten Kältephasen um 500 und 1500 n. Chr. während der Völkerwanderungszeit und der Kleinen Eiszeit.
Wenn die Warmphasen durch eine starke Sonne ausgelöst wurden, dann wurden die Kältephasen - richtig geraten - durch eine schwache Sonne verschuldet.
Sicher sind auch ein paar Vulkane explodiert, aber aus wissenschaftlicher Sicht ist die Kältewirkung viel zu kurz als dass sie eine jahrzehnte - bis jahrhundertelange Kälteperiode auslösen könnten.
Moderne Wärmeperiode
Der Bezug zur heutigen "Modernen Wärmeperiode" kommt auch zu kurz.
Die Temperaturen liegen heute auf dem Niveau der Mittelalterlichen Wärmperiode.
Offenbar wollte man die logische Konsequenz nicht thematisieren, um die Doku überhaupt erst politisch sendefähig zu bekommen.
Schade aber irgendwie verständlich.
Auch kleine Schritte in die richtige Richtung führen nach vorne.
Der Abschlußsatz in der Inhaltsangabe zu Teil 2 ("Wie groß der Einfluss auf das Weltklima tatsächlich ist, darüber streiten die Forscher") zeigt, dass sich die Filmemacher ernsthaft mit der Klimadiskussion beschäftigt haben und weit davon entfernt sind, die IPCC-Katastrophenszenarien als einzige Interpretationsmöglichkeit anzuerkennen.
| de | en | fr |
|---|---|---|
| Klimawandel: Ursachen | Climate change: Causes | Changement climatique: Causes |
| Solarer Einfluss in der Klima-Geschichte | Solar impact in Climate History | Impact solaire dans l'histoire du climat |
↑
A10 Kulturen
en Civilisations
fr Civilisations
Kulturen / Civilisations / Civilisations
| 2200 BC |
de
Klimakatastrophe im alten Ägypten - Wie eine Hochkultur verschwand
|
||||
|
2600 BC |
|
||||
| 1000 - 1300 |
de
Die Wikinger in Grönland en The Vikings in Greenland fr Les Vikings en Grœnland
|
||||
| 1400 - 1532 |
de
Die Mittelalterliche Warmzeit bei den Inkas in Peru en The Medieval Warm Period linked to the success of Machu Picchu, Inca Empire fr L'optimum climatique médiéval au Pérou |
||||


⇧ B Vor 4,6 Milliarden Jahren
- B1 de
Klima vor 4 Milliarden Jahren (Praekambium)
en Climate 4 billion years ago (Praecambium)
fr Climat il y a 4 milliards d'années (Praecambium) - B2 de
Die älteste nachgewiesene Vereisung der Erde
vor 2,3 Milliarden Jahren
en The oldest proven icing on earth 2.3 billion years ago
fr Le plus ancien givrage éprouvé sur terre il y a 2,3 milliards d'années
⇧
B1 Klima vor 4 Milliarden Jahren (Praekambrium)
en
Climate 4 billion years ago (Praecambium)
fr
Climat il y a 4 milliards d'années (Praecambium)
Mit folgenden Links wird von anderen Webseiten auf diese Seite verwiesen:
| de | en | fr |
|---|---|---|
|
Klima Geschichte Klima vor 4 Milliarden Jahren (Praekambrium) |
Climate History Climate 4 billion years ago (Praecambium) |
Histoire du climat Climat il y a 4 milliards d'années (Praecambium) |
↑ Praekambrium
![]()
![]() Zeit in Jahrmilliarden vor heute
Zeit in Jahrmilliarden vor heute

Rekonstruktion des mittleren Temperatur- und Niederschlagsverlaufs der Erde seit 3,8 Milliarden Jahren
-
Wikipedia
de
Warmklima
en -
fr -
- Wikipedia de Frühe Klimageschichte
| Harald Lesch |
Astrophysiker, Naturphilosoph, Wissenschaftsjournalist, Fernsehmoderator, Professor für Physik an der LMU München Lehrbeauftragter für Naturphilosophie an der Hochschule für Philosophie München. ▶Harald Lesch: Who is who (Aktivist der anthropogenen Globalen Erwärmung) ▶Harald Lesch: Wikipedia (Profiteure) |
⇧
B2 Die älteste nachgewiesene Vereisung der Erde
vor 2,3 Milliarden Jahren
en
The oldest proven icing on earth 2.3 billion years ago
fr
Le plus ancien givrage éprouvé sur terre
il y a 2,3 milliards d'années
Mit folgenden Links wird von anderen Webseiten auf diese Seite verwiesen:
| de | en | fr |
|---|---|---|
|
Klima Geschichte Die älteste nachgewiesene Vereisung der Erde vor 2,3 Milliarden Jahren |
Climate History The oldest proven icing on earth 2.3 billion years ago |
Histoire du climat Le plus ancien givrage éprouvé sur terre il y a 2,3 milliards d'années |
-
Wikipedia de
Paläoproterozoische Vereisung
en Huronian glaciation
fr Glaciation huronienne
-
Die kalte Sonne (Fritz Vahrenholt & Sebastian Lüning)
Dr. Dietrich E. Koelle
2015-01-01 de Der große Klima-Zyklus: Wir leben in einer tiefen Kaltzeitphase - und niemand merkt es
Die älteste nachgewiesene Vereisung der Erde ist das "Huronian Ice Age" von vor 2450 bis 2100 Millionen Jahren.
Es umfasst jedoch mindestens drei verschiedene Vereisungen, wie Untersuchungen an Felsformationen im heuten Nordamerika und Kanada ergeben haben.
Die Gowgonda-Formation in Ontario zeigt eine besonders gute glaziale Strata, die 2300 Millionen Jahre alt ist.
Dies dürfte zur ersten Vereisung an den Polen geführt haben.
Die Umlaufbahn des Sonnensystems um das Zentrum der Milchstrasse hat eine Entfernung von 25.000 bis 28.000 Lichtjahren vom Zentrum; es befindet sich also im mittleren Bereich des Spiralnebels.
Die Sonne mit ihren Planeten kommt damit bei ihrem 600 Millionen Jahre dauernden Umlauf in Bereiche dichterer Spiralarme und freier Bereiche.
Die Milchstrasse hat vier Hauptarme, benannt als Perseus, Norma, Scutum-Crux und Sagittarius-Carina mit erhöhter Staub- und Gasdichte, welche die Sonnenstrahlung auf die Erde zeitweise abschwächen und die großen Eiszeiten verursachen dürften.
Eine Alternative wird vom israelischen Forscher Nir Shaviv beschrieben, der beim Durchgang durch die Spiralarme eine erhöhte kosmische Strahlung annimmt, was zu einer langfristig verstärkten Wolkenbildung auf der Erde führt, die wiederum die solare Einstrahlung auf die Erdoberfläche reduziert.
⇧ C Vor Vor 900 Million Millionen Jahren
- C1 de
Der große Klima-Zyklus seit 900 Millionen Jahren
en The great climate cycle for 900 million years
fr Le grand cycle climatique depuis 900 millions d'années - C2 de
"Snowball Earth" vor 800 bis 700 Millionen Jahren
en "Snowball Earth" 800 to 700 million years ago
fr "Snowball Earth" il y a 800 à 700 millions d'années - C3 de
CO₂ Konzentration und Temperatur vor 600 Millionen Jahren
en CO₂ concentration and temperature 600 million years ago
fr Concentration et température de CO₂ il y a 600 millions d'années - C4 de
Klima vor 500 Millionen Jahren
en Climate 500 million years ago
fr Le climat il y a 500 millions d'années - C5 de
Klima vor 100 Millionen Jahren (zur Zeit der Dinosaurier)
en Climate 100 million years ago (at the time of the dinosaurs)
fr Climat il y a 100 millions d'années (à l'époque des dinosaures) - C6 de
Begin der neuen großen Eiszeit vor 2,5 Millionen Jahren
en The new great ice age began 2.5 million years ago
fr La nouvelle grande période glaciaire a commencé il y a 2,5 millions d'années
⇧
C1 Der große Klima-Zyklus seit 900 Millionen Jahren
en
The great climate cycle for 900 million years
fr
Le grand cycle climatique depuis 900 millions d'années
Mit folgenden Links wird von anderen Webseiten auf diese Seite verwiesen:
| de | en | fr |
|---|---|---|
|
Klima Geschichte Der große Klima-Zyklus seit 900 Millionen Jahren |
Climate History The great climate cycle for 900 million years |
Histoire du climat Le grand cycle climatique depuis 900 millions d'années |
![]()
![]() Der große Klima-Zyklus mit einer Periode von 150 bis 180
Millionen Jahren
Der große Klima-Zyklus mit einer Periode von 150 bis 180
Millionen Jahren
Die Eiszeiten waren so charakteristisch, dass sie jeweils eigene Namen
erhielten.
Alle etwa 200 Millionen Jahre
In der Vergangenheit dauerten etwa alle 200 Millionen Jahre
Warmzeiten
die Warmzeiten jeweils 30 bis 50 Millionen Jahre
Jede Warmperiode führte zu einer weiteren Entwicklungs-Stufe des Lebens auf der Erde.
Eiszeiten
Dazwischen lagen schwere und lange Eiszeiten von jeweils 50 bis 100 Millionen Jahren Dauer
mit Temperaturen unter 12°C.
⇧
C2 "Snowball Earth" vor 800 bis 700 Millionen Jahren
en
"Snowball Earth" 800 to 700 million years ago
fr
"Snowball Earth" il y a 800 à 700 millions d'années
Mit folgenden Links wird von anderen Webseiten auf diese Seite verwiesen:
▶Klima Zyklen: "Snowball Earth" │ ▶Eiszeiten & Warmzeiten: "Snowball Earth"
| de | en | fr |
|---|---|---|
|
Klima Geschichte "Snowball Earth" vor 800 bis 700 Millionen Jahren |
Climate History "Snowball Earth" 800 to 700 million years ago |
Histoire du climat "Snowball Earth" il y a 800 à 700 millions d'années |
Mit folgendem Link wird von anderen Webseiten auf diese Seite verwiesen.
▶Klima Zyklen: "Snowball Earth" │ ▶Eiszeiten & Warmzeiten: "Snowball Earth"
-
Wikipedia de
Schneeball Erde
en Snowball Earth
fr Terre boule de neige
|
|
Da es in den letzten 900 Millionen Jahren etwa alle 150-180 Mio. Jahre zu großen Eiszeiten kam, ist mit einer gewissen Wahrscheinlichkeit anzunehmen, dass dies auch im Zeitraum davor (im "Archaikum") der Fall war. Auf jeden Fall konnte man die letzte völlige Vereisung der Erde vor 800-700 Millionen Jahren nachweisen, das so genannte "Sturtian Ice Age". Diese Periode mit den wahrscheinlich tiefsten Temperaturen der letzten Milliarden Jahre wird auch mit der Bezeichnung "Snowball Earth" belegt, da damals fast die gesamte Erdkugel vereist war. Der Grund dafür war die Tatsache, dass damals die Strahlungsintensität der Sonne um 15 bis 20 % niedriger lag als heute. Sie nimmt mit dem zunehmenden Alter der Sonne langsam zu, was durch den Anstieg der minimalen und maximalen Temperaturen in den letzten 900 Millionen Jahren bestätigt wird. |

⇧
C3 CO₂ Konzentration und Temperatur vor 600 Millionen Jahren
en
CO₂ concentration and temperature 600 million years ago
fr
Concentration et température de CO₂
il y a 600 millions d'années
Mit folgenden Links wird von anderen Webseiten auf diese Seite verwiesen:
| de | en | fr |
|---|---|---|
|
Klima Geschichte CO₂ Konzentration und Temperatur vor 600 Millionen Jahren |
Climate History CO₂ concentration and temperature 600 million years ago |
Histoire du climat Concentration et température de CO₂ il y a 600 millions d'années |
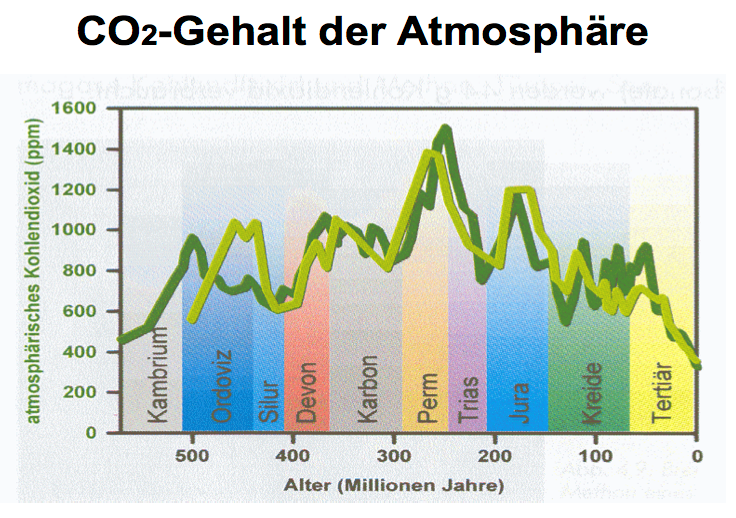
de CO2 Konzentration und Temperatur vor 600 Millionen Jahren
![]()
-
Man erkennt, dass die CO2-Konzentration in der Zeit, in der es grössere Mengen Lebewesen gibt (seit ca. 500 Millionen Jahren) meist weit höher war ( bis zu 0,7%) als heute (0,04%).
-
In dieser Zeit gab es 4 globale Kaltzeiten mit bis 10°C Unterschied.
-
In der Zusammenstellung ist erkennbar, dass die CO2-Konzentration nie ursächlich parallel der Temperatur lief!
en CO2-Concentration in the atmosphere in the last 600 Millions of Years
![]()
![]()
![]()

-
Watts up with that? (Antony Watts)
2009-02-15 en Hansen on "death trains" and coal and CO2
-
JunkScience
2005-06-21 en Planetary Temperature and Atmospheric Carbon Dioxide (CO2)
-
Plant fossils of West Virginia
en Climate and the Carboniferous Period
-
Earth's atmosphere today contains about 400 ppm CO2 (0.04%).
Compared to former geologic times, our present atmosphere, like the Late Carboniferous atmosphere, is CO2-impoverished!
In the last 600 million years of Earth's history only the Carboniferous Period and our present age, the Quaternary Period, have witnessed CO2 levels less than 400 ppm.
-
There has historically been much more CO2 in our atmosphere than exists today.
For example, during the Jurassic Period (200 mya), average CO2 concentrations were about 1800 ppm or about 4.7 times higher than today.
The highest concentrations of CO2 during all of the Paleozoic Era occurred during the Cambrian Period, nearly 7000 ppm -- about 18 times higher than today.
-
The Carboniferous Period and the Ordovician Period were the only geological periods during the Paleozoic Era when global temperatures were as low as they are today.
To the consternation of global warming proponents, the Late Ordovician Period was also an Ice Age while at the same time CO2 concentrations then were nearly 12 times higher than today -- 4400 ppm.
-
According to greenhouse theory, Earth should have been exceedingly hot.
Instead, global temperatures were no warmer than today.
Clearly, other factors besides atmospheric carbon influence earth temperatures and global warming.
![]()
![]() Die sich ändernden CO2-Gehalte der
Atmosphäre waren seit 600 Mill. Jahren zumeist sehr viel höher als heute,
was weder der Biosphäre geschadet noch Eiszeiten verhindert hat
Die sich ändernden CO2-Gehalte der
Atmosphäre waren seit 600 Mill. Jahren zumeist sehr viel höher als heute,
was weder der Biosphäre geschadet noch Eiszeiten verhindert hat
⇧
C4 Klima vor 500 Millionen Jahren
en
Climate 500 million years ago
fr
Le climat il y a 500 millions d'années
Mit folgenden Links wird von anderen Webseiten auf diese Seite verwiesen:
| de | en | fr |
|---|---|---|
|
Klima Geschichte Klima vor 500 Millionen Jahren |
Climate History Climate 500 million years ago |
Histoire du climat Le climat il y a 500 millions d'années |
- a Temperature of Planet Earth
- b Temperatures, CO2 and Sea Level throughout the past 526 to 570 million years
- c Der CO2-Gehalt der Atmosphäre in den letzten 300 Millionen Jahren
↑ a Temperature of Planet Earth
![]() de
de
![]() en
en
![]() Temperature of Planet Earth
Temperature of Planet Earth

↑ b Temperatures, CO2 and Sea Level throughout the past 526 to 570 million years
![]()
![]()

-
Watts Up With That? (Antony Watts)
2009-10-16 en Searching the PaleoClimate Record for Estimated Correlations: Temperature, CO2 and Sea Level
↑ c Der CO2-Gehalt der Atmosphäre in den letzten 300 Millionen Jahren
-
EIKE Europäisches Institut für Klima und Energie
Dr. Dietrich E. Koelle
2015-10-12 de Die anthropogenen CO2-Emissionen: Welche Rolle spielen sie tatsächlich?
Der CO2-Gehalt der Atmosphäre in den letzten 300 Millionen Jahren
![]()
![]()

Die kommende Pariser Klima-Konfererenz - die 21. dieser Art ohne dass mit solchen Massenkonferenzen bisher irgendwelche positiven Ergebnisse erzielt werden konnten - will den "Anstieg der Globaltemperatur" begrenzen, den es gar nicht gibt, und will die CO2-Emissionen reduzieren, die offenbar keinen klimatischen Effekt haben.
Don Quichotte lässt grüßen.
Die Gesamtmenge des Spurengases CO2 in der Erdatmosphäre beträgt 3200 Gt beim heutigen Stand von 400 ppm, entsprechend 0,04 % der Luftmasse.
Dies ist jedoch keine statischer Anteil, sondern ein dynamisches System mit verschiedenen Einflüssen.
Wie Bild 1 veranschaulicht, werden ständig im Äquatorialbereich große Mengen von CO2 durch die solare Erwärmung des Wassers freigesetzt, da sich die spezifische Menge des im Meerwasser gelösten CO2 mit steigender Temperatur reduziert (3 g CO2 pro kg Wasser bei 3°C und nur 1,4 g bei 25°C).
Dementsprechend wird bei Abkühlung des Wassers CO2 aus der Atmosphäre aufgenommen, was in den polaren Ozeanbereichen der Fall ist.
Insgesamt wird dieser CO2-Kreislauf pro Jahr auf 300 bis 400 Gt CO2 geschätzt, der durch die ENSO-Aktivität und andere Einflüsse um mehr als 10 % schwanken kann.
⇧
C5 Klima vor 100 Millionen Jahren (zur Zeit der Dinosaurier)
en
Climate 100 million years ago (at the time of the dinosaurs)
fr
Climat il y a 100 millions d'années (à l'époque des dinosaures)
Mit folgenden Links wird von anderen Webseiten auf diese Seite verwiesen:
| de | en | fr |
|---|---|---|
|
Klima Geschichte Klima vor 100 Millionen Jahren (zur Zeit der Dinosaurier) |
Climate History Climate 100 million years ago (at the time of the dinosaurs) |
Histoire du climat Climat il y a 100 millions d'années (à l'époque des dinosaures) |
- a Die letzten 100 Millionen Jahre
- b) Klima vor 56 Millionen Jahren
- c Vor acht Millionen Jahren
- d Mittlere Globaltemperaturen vor 1 Mio Jahren bis Jahr 2000
↑ a Die letzten 100 Millionen Jahre
-
Wikipedia
de Dinosaurier
Die Dinosaurier sind die Gruppe der Landwirbeltiere (Tetrapoda), die im Mesozoikum (Erdmittelalter) von der Oberen Trias vor rund 235 Millionen Jahren bis zur Kreide-Paläogen-Grenze vor etwa 66 Millionen Jahren die festländischen Ökosysteme dominierte.
en Dinosaur
Dinosaurs are a diverse group of reptiles of the clade Dinosauria.
They first appeared during the Triassic period, between 243 and 233.23 million years ago, although the exact origin and timing of the evolution of dinosaurs is the subject of active research.
They became the dominant terrestrial vertebrates after the Triassic-Jurassic extinction event 201 million years ago; their dominance continued through the Jurassic and Cretaceous periods.
Reverse genetic engineering and the fossil record both demonstrate that birds are modern feathered dinosaurs, having evolved from earlier theropods during the late Jurassic Period.
As such, birds were the only dinosaur lineage to survive the Cretaceous-Paleogene extinction event 66 million years ago.
fr Dinosaure
Présents dès le milleu du Ladinien (dernier étage du Trias moyen), il y a environ 240 Ma, ils disparaissent presque entièrement lors de l'extinction Crétacé-Tertiaire il y a 66 Ma.
![]()
![]()

Man erkennt, dass wir heute am Ende einer Serie mehrerer Eiszeiten leben.
Die Temperaturen heute (und seit ca. 2 Millionen
Jahre) sind immer noch wesentlich niedriger ( um ca.
10 Grad) als die im Erdmittelalter (Zeit der Saurier).
Diese Zeit wurde durch einen Metoriteneinschläg grössten Ausmasses beendet.
-
Der Wasserplanet / Ernst-Georg Beck
de- Die letzten 10'000 Jahre
- Die letzten 450'000 Jahre
- Die letzten 100 Millionen Jahre
- Die letzten 600 Millionen Jahre
Der Wasseplanet von Ernst-Georg Beck wurde anscheinend nach dem Ableben von Beck von der Zentrale für Unterrichtsmedien (ZUM) aus offensichtlich ideologischen Gründen mit sämtlichen Spuren zu Beck vom ZUM-Server gelöscht.
- Teile abschreiben und das Original entfernen ??
- die gleichen Links führen nun auf die neuen Seiten der Aktivisten des Verlags.
- Der Wasserplanet war das Lebenswerk von Ernst-Georg Beck, das er auch seinen ehemaligen Schülern hinterlassen wollte.
▶Der Wasserplanet (Ernst-Georg Beck)
↑
Klima vor 56 Millionen Jahren
en Climate 56 million years ago
-
Klimaskeptiker:
de 2011-02-26 de Natürliche globale Erwärmung - vor 56 Millionen JahrenVor etwa 56 Millionen Jahren gab es eine Periode globaler Erwärmung, die als Palöozän-Eozän-Thermalmaximum (PETM) bezeichnet wird, während derer die globalen Meeresoberflächentemperaturen um etwa 5 °C anstiegen.
Wenn sich vor 56 Millionen Jahren die Ozeanoberflächen um 5 °C erwärmt haben, wofür die damals noch nicht existierenden Menschen wohl kaum verantwortlich sein konnten, mit welcher Logik wird dann aus einer globalen Erwärmung um vielleicht 0,7 °C im 20. Jahrhundert gefolgert, diesmal sei der Mensch verantwortlich?
Klimawandel hat es immer gegeben und wird es immer geben, es gibt kein verbrieftes Recht auf ein bestimmtes Klima.
Die Wirkungen der "Treibhausgase" wie CO2 werden jedenfalls weit überschätzt.
-
The National Oceanography Centre (NOC),
2011-02-25 en Arctic environment during an ancient bout of natural global warmingAround 56 million years ago there was a period of global warming called the Paleocene-Eocene Thermal Maximum (PETM), during which global sea surface temperatures increased by approximately 5°C.
↑ c Vor acht Millionen Jahren
Meldungen:
- Vor acht Millionen Jahren war es im Gebiet der Antarktis etwa so warm wie im heutigen Neuseeland.
- Die in den Sedimenten entdeckten Fossilien deuten auf wärmere Verhältnisse hin als bislang angenommen. Der Blick in diesen Teil der Erdgeschichte zeigt dabei durchaus wichtige Parallelen zum heutigen Klimageschehen:
- Damals war die Konzentration des "Treibhausgases Kohlendioxid" in der Atmosphäre ähnlich hoch wie heute.
Kommentar zu den "Treibhausgasen"::
-
Wenn, wie im Artikel berichtet, die Konzentration der
"Treibhausgase" in der Atmosphäre ähnlich hoch war wie heute,
kann man ja davon ausgehen, dass der von einigen Wissenschaftlern
angeblich beobachtete Klimawandel ja wohl rein gar nichts
mit der Konzentration der Gase zu tun hat. Wie auch, ist doch
unsere Sonne alleinig für unser Klima verantwortlich!
Nicht das ich gegen Umweltschutz oder Schonung der Energieressourcen wäre, ganz im Gegenteil. Aber, alles unsinniges Gerede um den von Menschenhand gemachten Klimawandel hat nur einen einzigen Sinn, und das Geld aus der Tasche zu ziehen!
- Welt Service de Antarktis war zu Urzeiten praktisch eisfrei
- Handelsblatt.com de Vor acht Millionen Jahren
↑ d Mittlere Globaltemperaturen vor 1 Mio Jahren bis Jahr 2000

- klimaskeptiker.info: Temperaturschwankungen
⇧
C6 Begin der neuen großen Eiszeit vor 2,5 Millionen Jahren
en
The new great ice age began 2.5 million years ago
fr
La nouvelle grande période glaciaire a commencé
il y a 2,5 millions d'années
Mit folgenden Links wird von anderen Webseiten auf diese Seite verwiesen:
| de | en | fr |
|---|---|---|
|
Klima Geschichte Begin der neuen großen Eiszeit vor 2,5 Millionen Jahren |
Climate History The new great ice age began 2.5 million years ago |
Histoire du climat La nouvelle grande période glaciaire a commencé il y a 2,5 millions d'années |
![]()
![]() Vor 3,2 bis 2,5 Millionen Jahren:
Vor 3,2 bis 2,5 Millionen Jahren:
Absturz in den eiszeitlichen Temperaturbereich

Seit dem letzten Wärmemaximum vor 90 Millionen Jahren mit 28°C Globaltemperatur war eine kontinuierliche Abfall der Temperaturen festzustellen.
Im Zeitraum von vor 3,2 bis 2,5 Millionen Jahren erfolgte dann der Absturz in den eiszeitlichen Temperaturbereich von 9 bis 11°C als globalem Durchschnitt (Bild 4).
Eine neue und vermutlich lange neue Eiszeit hat begonnen
Eine neue und vermutlich lange neue Eiszeit hat begonnen - in Übereinstimmung mit dem großen Klima-Zyklus.
Warum merken wir nichts davon?
Der Grund dafür ist das Auftreten von relativ kurzen Warmzeiten, jeweils im Abstand von etwa 100 000 Jahren, wie Bild 5 zeigt.
Die gegenwärtige Warmzeit, Holozän genannt, gibt es seit 11 000 Jahren, und das ist der Zeitraum, in dem sich die menschliche Zivilisation entwickelt hat - angefangen mit dem Ackerbau, der durch den Temperaturanstieg möglich geworden war, und die Entstehung von Dorfgemeinschaften.
Davor gab es nur Gruppen von nomadisierenden Jägern und Sammlern.
Die letzte Warmzeit vor 125 000 Jahren war relativ kurz - ca. 13 000 Jahre, erreichte aber um 2°C höhere Maximaltemperaturen als die jetzige Warmzeit des Holozäns.
Das ist besonders bemerkenswert, da damals ein wesentlich geringeres CO2-Niveau der Atmosphäre vorherrschte (= 280 ppm), wie wir von der Eiskern-Bohrungen in der Antarktis und Grönland wissen.
Man nimmt an, dass zyklische Änderungen der Erdbahnparameter, die sogenannten Milankovitsch-Zyklen, den Antrieb des 100.000-Jahres Klimazyklus zwischen Eiszeiten und Warmzeiten bilden.
-
Watts Up With That? (Antony Watts)
2009-05-13 en '90% of the last million years, the normal state of the Earth's climate has been an ice age'
⇧ D Vor 500'000 Jahren
- D1 de
Die aktuelle Eiszeit seit 500'000 Jahren
en The current ice age for 500'000 years
fr L'âge glaciaire actuel depuis 500'000 ans - D2 de
Klima vor 160'000 Jahren
en Climate 160'000 years ago
fr Climat il y a 160'000 ans - D3 de
Entwicklung seit 100'000 Jahren
en Development for 100'000 years
fr Développement depuis 100'000 ans
⇧
D1 Die aktuelle Eiszeit seit 500'000 Jahren
en
The current ice age for 500'000 years
fr
L'âge glaciaire actuel depuis 500'000 ans
Mit folgenden Links wird von anderen Webseiten auf diese Seite verwiesen:
| de | en | fr |
|---|---|---|
|
Klima Geschichte Die aktuelle Eiszeit seit 500'000 Jahren |
Climate History The current ice age for 500,000 years |
Histoire du climat L'âge glaciaire actuel depuis 500 000 ans |
![]()
![]() Das zyklische Auftreten von kurzen Warmzeiten während der
aktuellen Eiszeit
Das zyklische Auftreten von kurzen Warmzeiten während der
aktuellen Eiszeit
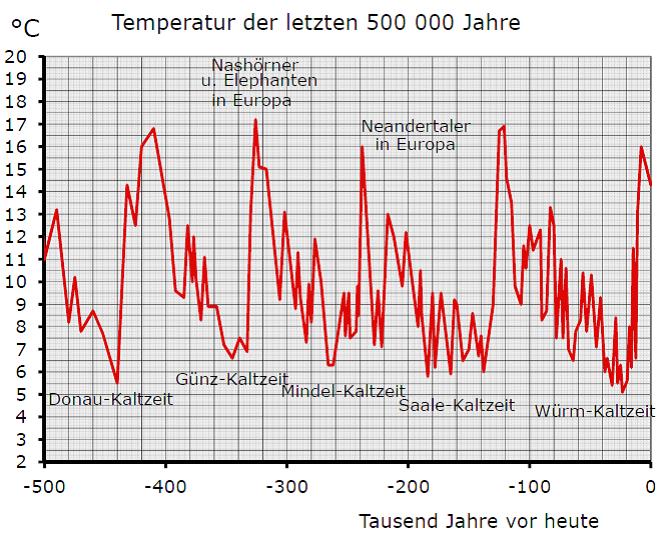
Wenn sich der Klimazyklus der vergangenen 500'000 Jahre so fortsetzt,
dann könnte das bedeuten, dass in wenigen tausend Jahren
wieder der Rückfall auf das echte Eiszeit-Temperaturniveau
mit Ausbreitung der Gletscher über Kanada und Skandinavien eintreten würde.
![]() de
de
![]() en
en
![]()
Temperaturschwankungen der letzten 450.000 Jahre.
Zum einen sind die Temperaturschwankungen zyklisch und zum anderen
ist das heutige Niveau vergleichsweise niedrig!

![]()
![]() Antarctica EPICA and VOSTOK Ice Cores
Antarctica EPICA and VOSTOK Ice Cores

-
EIKE Europäisches Institut fü Klima und Energie
2011-06-16 de Wenn sich Blinde an Blinden orientieren - die Messreihen der GISS et al. - Oder Hütchenspieler unter sich!
-
Watts Up With That? (Antony Watts)
2014-01-25 en When Did Global Warming Begin?
EPICA Core and VOSTOK Core
⇧
D2 Klima vor 160'000 Jahren
en
Climate 160'000 years ago
fr
Climat il y a 160'000 ans
Mit folgenden Links wird von anderen Webseiten auf diese Seite verwiesen:
| de | en | fr |
|---|---|---|
|
Klima Geschichte Klima vor 160'000 Jahren |
Climate History Climate 160,000 years ago |
Histoire du climat Climat il y a 160 000 ans |
![]()
![]() IRI Data Library ICE CORE VOSTOK temperature difference
from present
IRI Data Library ICE CORE VOSTOK temperature difference
from present
[-50.0 164350.0] years before present
Quelle

-
2008-10-06 en
The Last Ice Age (120 000 years ago to Modern)
This is a visualization of the last ice age using a global ice sheet model with pro-glacial lakes included.
⇧
D3 Entwicklung seit 100'000 Jahren
en
Development for 100,000 years
fr
Développement depuis 100 000 ans
Mit folgenden Links wird von anderen Webseiten auf diese Seite verwiesen:
| de | en | fr |
|---|---|---|
|
Klima Geschichte Entwicklung seit 100'000 Jahren |
Climate History Development for 100,000 years |
Histoire du climat Développement depuis 100 000 ans |
![]()
![]() Kommentar:
Kommentar:
Offensichtlich besteht kein Zusammenhang zwischen
der mittleren globalen Temperatur mit der Akitvität des
Menschen!
|
1 Materialverbrauch |
2 Globaler Ölkonsum |
| 3 Weltbevölkerung | 4 Kohlendioxid CO2 |
| 5 Globaler Wasserverbrauch | 6 Mittlere globale Temperatur |

⇧ E Vor 40'000 Jahren
- E1 de
Aussterben der Neandertaler vor ca. 40'000 Jahren
en Extinction of the Neanderthals approximately 40'000 years ago
fr Extinction des Néandertaliens il y a environ 40'000 ans
⇧
E1 Aussterben der Neandertaler vor ca. 40'000 Jahren
en
Extinction of the Neanderthals approximately 40,000 years ago
fr
Extinction des Néandertaliens il y a environ 40 000 ans
Mit folgenden Links wird von anderen Webseiten auf diese Seite verwiesen:
| de | en | fr |
|---|---|---|
|
Klima Geschichte Aussterben der Neandertaler vor ca. 40'000 Jahren |
Climate History Extinction of the Neanderthals approximately 40,000 years ago |
Histoire du climat Extinction des Néandertaliens il y a environ 40 000 ans |
-
Watts Up With That? (Antony Watts)
2016-05-11 en Study: extreme cold from climate change may have killed off Neanderthals
⇧ F Vor 25'000 Jahren
- F1 de
Klima vor 25'000 Jahren - Die letzte Eiszeit
en Climate 25'000 years ago - the last ice age
fr Le climat il y a 25'000 ans - la dernière période glaciaire
⇧
F1 Klima vor 25'000 Jahren - Die letzte Eiszeit
en
Climate 25,000 years ago - the last ice age
fr
Le climat il y a 25 000 ans - la dernière période glaciaire
Mit folgenden Links wird von anderen Webseiten auf diese Seite verwiesen:
| de | en | fr |
|---|---|---|
|
Klima Geschichte Klima vor 25'000 Jahren - Die letzte Eiszeit |
Climate History Climate 25,000 years ago - the last ice age |
Histoire du climat Le climat il y a 25 000 ans - la dernière période glaciaire |
- a Letzteiszeitliches Maximum
- b Greenland temperatures over the past 25,000 years
- c Temperaturverlauf der letzten 20'000 Jahre in Grönland
- d Die Sonne steuerte das Klima in der Eiszeit
↑ a Letzteiszeitliches Maximum
-
Wikipedia
de
Letzteiszeitliches Maximum
en Last Glacial Maximum
fr Dernière période glaciaire
↑ b Greenland temperatures over the past 25,000 years
|
|
||
|
||


↑ c Temperaturverlauf der letzten 20'000 Jahre in Grönland
![]()
![]()

![]()
![]()

Glaubt man den Prognosen des Weltklimarats IPCC, stolpert die Menschheit im Gefolge des globalen Klimawandels unaufhaltsam der grössten Krise ihrer Geschichte entgegen.
-
Basler Zeitung
2014-04-02 de Nichts Neues unter der SonneMehrere Male hat ein dramatischer Klimawandel die Geschichte der Menschheit bereits neu geschrieben.
Nie war der Mensch daran schuld - und immer hat er eine Lösung gefunden.
de Panik-Küche en Panic laboratory fr Marmite alarmiste
IPCC Climat Change 2013/14
en
![]() Videos
WGI,
WGII
Videos
WGI,
WGII
Heute vor rund 12'000 Jahren:
Das Jordantal ist eine Steppenlandschaft. Wild gibt es in Hülle und Fülle. Noch wichtiger für die Jäger und Sammler, die hier leben: die wilden Gräser, die hier überall von selber wachsen. Das Nahrungsangebot ist gut, nirgendwo leben so viele Menschen wir hier. Sie leben scheinbar im Paradies: Sie ernten, ohne zu säen. Bis der Regen ausbleibt...
Eiszeit kam abrupt zurück
Während rund 1000 Jahren, der Epoche der sogenannten Jüngeren Dryas, stiess das Eis noch einmal kräftig vor. Wo zuvor Wälder wuchsen, zogen wieder Rentiere über baumlose Tundra. Der Nordatlantik fror zu. Der regenreiche Westwind blieb aus...
Wie abrupt die Abkühlung wirklich war, ahnte lange niemand. Wenn Geologen über «rasche Änderungen» sprechen, meinen sie Jahrtausende. Doch neue Forschungen zeigen ein anderes Bild: Der Rückfall in die Eiszeit fand innerhalb eines Jahrzehnts statt.
In Europa warm, im Süden Regen
Die letzte schnelle Erwärmung vor rund 11'500 Jahren änderte das Klima fundamental: Die Gletscher schmolzen auf das heutige Niveau, es wurde warm in Europa, und es regnete wieder im Nahen Osten.
Jahrhundertelang war es in Europa wärmer als heute. Im Süden, im Nahen Osten und in Nordafrika, regnete es mehr. Was heute die Sahara ist, war eine Savanne.
Lesen Sie weiter...
-
Basler Zeitung 2014-04-02 de Nichts Neues unter der Sonne
↑
d Die Sonne steuerte das Klima in der Eiszeit
en Persistent link between solar activity and
Greenland climate during the Last Glacial Maximum
fr Lien entre l'activité solaire et le climat
pendant la dernière période glaciaire
-
Die kalte Sonne (Fritz Vahrenholt & Sebastian Lüning)
2014-09-08 de Die Sonne steuerte das Klima in der EiszeitEin bekanntes Verhaltensmuster der Sonne ist ihre unregelmäßige Sonnenaktivität.
Der bekannteste Aktivitätszyklus der Sonne ist der elfjährige Sonnenfleckenzyklus, bei dem sich alle elf Jahre Sonnenfleckenmaxima und -minima abwechseln.
Es sind aber auch Schwankungen auf anderen Zeitskalen bekannt.
Sonnenflecken sind Stellen auf der Oberfläche der Sonne, die dunkler erscheinen, weil sie Sonnenstrahlen mit verminderter Leuchtkraft ins Universum abgeben.
Gleichzeitig verlässt dort sehr energiereiche Strahlung, vor allem im UV-Bereich, die Sonne. Während des Sonnenfleckenminimums gibt es weniger Sonnenflecken und es kommt daher weniger energiereiche Sonnenstrahlung auf der Erde an, bei einem Sonnenfleckenmaximum ist es genau umgekehrt.
Mehr Sonnenstrahlung, insbesondere im UV-Bereich, führt im Sonnenfleckenmaximum zu einer Erwärmung der Stratosphäre (zwischen 15 und 50 km) in den Tropen und zu einer verstärkten Ozonproduktion.
Dies führt wiederum über komplizierte Wechselwirkungsmechanismen zu Zirkulationsänderungen in der Atmosphäre, die bis zum Erdboden zu spüren sind.
Die Mechanismen, wie Änderungen in der Sonnenaktivität die Atmosphäre beeinflussen, sind allerdings immer noch Gegenstand aktueller Forschung. Insbesondere wird über den Zusammenhang von großen Sonnenfleckenminima mit kalten, schneereichen Wintern spekuliert oder ob die momentan geringere Sonnenaktivität für die Pause in der globalen Erderwärmung verantwortlich sein könnte.
Wissenschaftlern der Universität Lund (Schweden) ist es jetzt in Kooperation mit den GEOMAR-Klimaforschern Prof. Dr. Katja Matthes und Dr. Rémi Thiéblemont gelungen, die Sonnenaktivität bis zur letzten Eiszeit zu rekonstruieren. Die Studie wurde im August in der internationalen Fachzeitschrift Nature Geoscience veröffentlicht.
Um Aufschlüsse über die damalige Sonnenaktivität zu bekommen, als Schweden und Norddeutschland unter einem dicken Eispanzer lagen, wurden Eisbohrkerne aus Grönland verwendet.
Das Auswertungsprinzip funktioniert wie bei Baumringen: Im Eisbohrkern sind verschiedene Schichten zu sehen, die Informationen über Temperatur- und Niederschlagsverhältnisse enthalten.
Die radioaktiven, kosmischen Moleküle Beryllium und Kohlenstoff spielen hierbei eine wichtige Rolle. Sie entstehen nämlich immer dann in der Atmosphäre, wenn das Magnetfeld um die Erde zu schwach ist und viel kosmische Strahlung durchlässt. Wenn im Eisbohrkern also viel radioaktives Beryllium und Kohlenstoff vorhanden ist, weist das auf eine schwache Schutzschicht und somit auf eine geringe Sonnenaktivität hin.
Eine kombinierte Analyse aus Eisbohrkernen und Tropfsteinen der Wissenschaftler der Lund University erlaubte eine Rekonstruktion der Sonnenaktivität bis zum Ende der letzten Eiszeit.
Sie zeigen, dass der elfjährige Sonnenfleckenzyklus auch damals existierte und offensichtlich ein typisches Muster der Sonnenaktivität darstellt.
"Erstmals ist es gelungen eine hochauflösende Aufzeichnung der Sonnenaktivität nachzuweisen", sagt Prof. Matthes.
"Mit unserem Klimamodell, welches die Übertragung des Sonnensignales von der Stratosphäre bis zum Erdboden genauer als andere Modelle enthält, konnten wir die für ein Sonnenfleckenminimum typischen atmosphärischen Zirkulationsmuster rekonstruieren und so Rückschlüsse auf mögliche Temperatur- und Niederschlagsverhältnisse über Grönland gewinnen, die den Verhältnissen zum Ende der letzten Eiszeit sehr nahe kommen."
"Die Übereinstimmung ist beeindruckend und lässt vermuten, dass der Mechanismus für die Beeinflussung des Klimas durch solare Aktivität damals und heute sehr ähnlich funktioniert."
Die Ergebnisse bestätigen die Hinweise aus anderen Studien, dass Jahre mit geringer Sonnenaktivität mit strengen Wintern auf der Nordhalbkugel zusammenhängen.
Ein Beispiel dafür ist der starke Wintereinbruch, verbunden mit Schneefall und Stürmen, wie wir es 2008 und 2010 in Nordeuropa und Nordamerika erlebten.
In diesen Jahren befanden wir uns in einem Sonnenfleckenminimum.
Der Effekt der Sonnenaktivität auf regionale Klimaschwankungen ist sehr aufschlussreich. Abschätzungen der zukünftigen Sonnenaktivität könnten zu genaueren Klimavorhersagen innerhalb der nächsten Jahrzehnte führen", erklärt Prof. Matthes.
-
Nature Geoscience
2014-08-17 en Persistent link between solar activity and Greenland climate during the Last Glacial Maximum
⇧ G Vor 11'000 Jahren
- G1 de
Von der letzten Eiszeit bis heute
en From the last ice age to today
fr De la dernière période glaciaire à aujourd'hui
- G2 de
Klima vor 10'000 Jahren bis heute - Das Holozän
en Climate 10'000 years ago until today - the Holocene
fr Le climat il y a 10'000 ans jusqu'à aujourd'hui - l'Holocène - G2 a de Das Holozän
- G2 b de Temperaturverlauf der letzten 11'000 Jahre
- G2 c de Wir leben heute in einer Warmzeit eines Eiszeitalters
- G2 d de Temperaturrekonstruktion aus grönländischen Eisbohrkernen
- G2 e de Temperaturrekonstruktion aus Tropfsteinen
- G2 f en Tree rings: Summer temperature anomalies for the past 7000 years
- G2 g
de
Klimawirksamkeit der Sonne während der vergangenen 9000 Jahre
en Powerful correlation between sun and climate over the last 9000 years - G2 h de
Solarflaute vor 2800 Jahren löste Kälteperiode in Mitteleuropa aus
en Climatic effects of a solar minimum: grand solar minimum and climate response
recorded for first time in same climate archive - G2 i de
Die Aktivität der Sonne in den letzten 10'000 Jahren
en The activity of the sun in the last 10000 years
fr L'activité solaire dans les 10000 dernières années - G2 j de Was geschah vor 10 000 Jahren?
- G2 k de
"Anthropozän" fällt bei Kommission zur Stratigraphie glatt
durch
en Blow to warmists, the proposed 'Anthropocene' epoch has been denied by ICS
- G3 de
Klima im Laufe der Geschichte der Menschheit
en Climate throughout human history
fr Le climat à travers l'histoire humaine - G3 a Das Subatlantikum
- G3 b Langfristiger Abkühlungstrend Nordeuropas über die letzten Jahrtausende
- G3 c Global Temperatures (2500 B.C, to 2008 A.D.)
- G3 d Global Temperatur Reconstruction Based on Non-Treering Proxies
- G3 e Klima in den letzten 5000 Jahren
- G3 f Klima in den letzten 3000 Jahren
- G3 g Klima in den letzten 2000 Jahren
- G3 h Temperaturen in Grönland
- G3 i Einfluss der Sonne auf das Klima der Römer
- G3 j
de
Sonnenstrahlung 1611-2001
en Solar Irradiation 1611-2001
fr Rayonnement solaire 1611-2001 - G3 k
de
Die Geschichtsfälschung von Michael Mann mit der Hockeystick-Kurve
en Falsification of the climate history with the hockeystick curve by Michael Mann
fr Falsification de l'histoire du climat avec la courbe de la crosse de hockey par Michael Mann
- G4 de
Die Minoische Warmzeit
en The Minoan Warm Period
fr La période chaude minoenne - G5 de
Völkerwanderungszeit (Kelten)
en Migration Period (Celts)
fr Période de migration (Celtes) - G6 de
Das Römische Klimaoptimum /
Die letzten 2000 Jahre
en The Roman climate optimum / The last 2000 years
fr L'optimum climatique romain / Les derièeres 2000 années - G7 de
Pessimum der Völkerwanderungszeit (Goten)
en Pessimum of the Migration Period (Goths)
fr Pessimum de la période de migration (Goths)
- G8 de
Das Mittelalter
en Middle Ages
fr Moyen Âge
- G8 A de
Die Mittelalterliche Warmzeit und die Kleine Eiszeit
en Medieval Warm Period and the Little Ice Age
fr L'optimum climatique médiéval et le petit âge glaciaire
- G8 B de
Die Mittelalterliche Warmzeit (ca. 900 - 1350)
en The Medieval Warm Period
fr L'optimum climatique médiéval
- G9 de
Klimawandel seit der Kleinen Eiszeit
en Climate change since the Little Ice Age
fr Changement climatique depuis le petit âge glaciaire
⇧
G1 Von der letzten Eiszeit bis heute
en
From the last ice age to today
fr
De la dernière période glaciaire à aujourd'hui
Mit folgenden Links wird von anderen Webseiten auf diese Seite verwiesen:
| de | en | fr |
|---|---|---|
|
Klima Geschichte Von der letzten Eiszeit bis heute |
Climate History From the last ice age to today |
Histoire du climat De la dernière période glaciaire à aujourd'hui |
![]()
![]()
de
Eisbohrkernen zufolge war das letzte Jahrtausend von 1000 bis 2000
das kälteste Millenium des gegenwärtigen Interglazials.
en
According to ice core records, the last millennium 1000AD - 2000AD has
been the coldest millennium of our current Holocene interglacial.

-
EIKE Europäisches Institut für Klima und Energie
Ed Hoskins / Chris Frey
2018-09-09 de Wir sollten jetzt die realen und nachteiligen Folgen von Abkühlung fürchtenUnser gegenwärtiges warmes Interglazial hat es erst möglich gemacht, dass sich die Zivilisation der Menschheit während der letzten 10.000 Jahre entwickeln konnte - von frühesten Ackerbau-Methoden bis zu den jüngsten Technologien.
Eisbohrkernen zufolge war das letzte Jahrtausend von 1000 bis 2000 das kälteste Millenium des gegenwärtigen Interglazials.
Am deutlichsten wird dieser Umstand illustriert, wenn man die Ergebnisse aus den Eisbohrkernen im Zeitmaßstab von Jahrtausenden darstellt, und zwar zurück bis zum Zeitalter des Eemian.
-
Ice Age Now / Ed Hoskins
2018-09-01 de We should now fear the real and detrimental effects of coolingOur current, warm, interglacial has been the enabler of mankind's civilisation for the last 10,000 years, from mankind's earliest farming to the most recent technologies.
According to ice core records, the last millennium 1000AD - 2000AD has been the coldest millennium of our current Holocene interglacial.
This point is more fully illustrated with ice core records on a millennial basis back to the Eemian period here.
-
EIKE Europäisches Institut für Klima und Energie
Ed Hoskins / Chris Frey
2017-07-23 de Die Welt sollte jetzt die realen und schädlichen Auswirkungen von Abkühlung fürchten
![]()
![]() Holozän Interglaziale Epoche: 8000 BC - 2000AC
Holozän Interglaziale Epoche: 8000 BC - 2000AC

Das Holozän-Interglazial dauert nunmehr bereits seit 10.000 bis 11.000 Jahren an,
und zieht man die zeitliche Länge früherer Interglaziale als Vergleich heran, müsste die Epoche des Holozäns in diesem Jahrhundert zu ihrem Ende kommen
- vielleicht aber auch erst im nächsten Jahrhundert oder in diesem Millenium.
![]()
![]() Temperature of the Northern Hemisphere derived from Greenland
ice cores
Temperature of the Northern Hemisphere derived from Greenland
ice cores
It provides a brief context to show the wider natural range of
temperature over the last 10,000 years.
It shows the meaningless identification of the Anthropocene
identified by the small red bar.

![]()
![]() Central Greenland Temperatures
Central Greenland Temperatures

![]()
![]()
![]() Ice Age is ending ... Must be our fault
Ice Age is ending ... Must be our fault

-
Watts Up With That? (Antony Watts)
Dr. Tim Ball
2016-07-31 en A Warm Period by Any Other Name - The Climatic OptimumHypsithermal,
Altithermal,
Holocene Optimum,
Holocene Thermal Maximum,
Holocene Megathermal,
Anthropogene;
The Last Ice Age
About 24,000 years ago
-
while the world was still in the grip of the last Ice Age and huge continental glaciers covered large areas, a sudden warming of about 20°F occurred.
Shortly thereafter, temperatures dropped abruptly about 11°F. Temperatures then remained cold for several thousand years but oscillated between about 5°F warmer and cooler.
About 15,000 years ago
- a sudden, intense, climatic warming of about 21°F (~12° C;) caused dramatic melting of the large ice sheets that covered Canada and the northern U.S., all of Scandinavia, and much of northern Europe and Russia.
A few centuries later
- temperatures again plummeted about 20° F (~11°C) and glaciers readvanced.
About 14,000 years ago
- global temperatures once again rose rapidly, about 8° F (~4.5°C), and glaciers receded.
About 13,400 years ago
- global temperatures plunged again, about 14° F (~8°C) and glaciers readvanced.
12,700 yrs ago
- global temperatures plunged sharply, 14° F (~8°C) and a 1300 year cold period, the Younger Dryas, began.
After 1300 years of cold climate
-
global temperatures rose sharply, about 21° F (~12° C),
11,500 years ago, marking the end of the Younger Dryas cold period and the end of the Pleistocene Ice Age.
Early Holocene climate changes
8,200 years ago
-
the post-Ice Age interglacial warm period was interrupted by a sudden global cooling that lasted for a few centuries
During this time, alpine glaciers advanced and built moraines.
The warming that followed the cool period was also abrupt.Neither the abrupt climatic cooling nor the warming that followed was preceded by atmospheric CO2 changes.
Late Holocene climate changes
750 B.C. to 200 B.C. cool period
- Prior to the founding of the Roman Empire, Egyptians records show a cool climatic period from about 750 to 450 B.C. and the Romans wrote that the Tiber River froze and snow remained on the ground for long periods.
The Roman warm period (200 B.C. to 600 A.D.)
- After 100 B.C., Romans wrote of grapes and olives growing farther north in Italy than had been previously possible and of little snow or ice.
The Dark Ages cool period (440 A.D. to 900 A.D.)
-
The Dark Ages were characterized by marked cooling.
A particularly puzzling event apparently occurred in 540 A.D. when tree rings suggest greatly retarded growth, the sun appeared dimmed for more than a year, temperatures dropped in Ireland, Great Britain, Siberia, North and South America, fruit didn't ripen, and snow fell in the summer in southern Europe.
In 800 A.D., the Black Sea froze and in 829 A.D. the Nile River froze.
The Medieval Warm Period (900 A.D. to 1300 A.D.)
-
The Medieval Warm Period (MWP) was a time of warm climate from about 900-1300 AD when global temperatures were apparently somewhat warmer than at present.
Its effects were particularly evident in Europe where grain crops flourished, alpine tree lines rose, many new cities arose, and the population more than doubled.
The Vikings took advantage of the climatic amelioration to colonize Greenland, and wine grapes were grown as far north as England where growing grapes is now not feasible and about 500 km north of present vineyards in France and Germany.
Grapes are presently grown in Germany up to elevations of about 560 meters, but from about 1100 to 1300 A.D., vineyards extended up to 780 meters, implying temperatures warmer by about 1.0 to 1.4° C.
Wheat and oats were grown around Trondheim, Norway, suggesting climates about one degree C warmer than present (Fagan, 2007).
The Vikings colonized southern Greenland in 985 AD during the Medieval Warm Period when milder climates allowed favorable open-ocean conditions for navigation and fishing.
This was close to the maximum Medieval warming recorded in the GISP2 ice core at 975 AD.
Elsewhere in the world, prolonged droughts affected the southwestern United States and Alaska warmed.
Sediments in Lake Nakatsuna in central Japan record warmer temperatures.
Sea surface temperatures in the Sargasso Sea were approximately 1°C warmer than today and the climate in equatorial east Africa was drier from 1000-1270 AD.
An ice core from the eastern Antarctic Peninsula shows warmer temperatures during this period.
The Little Ice Age (1300 A.D. to the 20th century)
-
At the end of the Medieval Warm Period, ~1230 AD, temperatures dropped ~4°C (~7° F) in ~20 years and the cold period that followed is known as the Little Ice Age.
The colder climate that ensued for several centuries was devastating.
Temperatures of the cold winters and cool, rainy summers were too low for growing of cereal crops, resulting in widespread famine and disease.
When temperatures declined during the 30-year cool period from the late 1940's to 1977, some climatologists and meteorologists predicted a return to a new Little Ice Age.
Glaciers expanded worldwide.
Glaciers in Greenland advanced and pack-ice extended southward in the North Atlantic in the 13th century.
The population of Europe had become dependent on cereal grains as a food supply during the Medieval Warm Period and when the colder climate, early snows, violent storms, and recurrent flooding swept Europe, massive crop failures occurred.
Three years of torrential rains that began in 1315 led to the Great Famine of 1315-1317.
The Thames River in London froze over, the growing season was significantly shortened, crops failed repeatedly, and wine production dropped sharply.
Winters during the Little Ice Age were bitterly cold in many parts of the world.
Advance of glaciers in the Swiss Alps in the mid-17th century gradually encroached on farms and buried entire villages.
The Thames River and canals and rivers of the Netherlands frequently froze over during the winter.
New York Harbor froze in the winter of 1780 and people could walk from Manhattan to Staten Island.
Sea ice surrounding Iceland extended for miles in every direction, closing many harbors.
The population of Iceland decreased by half and the Viking colonies in Greenland died out in the 1400s because they could no longer grow enough food there.
In parts of China, warm weather crops that had been grown for centuries were abandoned.
In North America, early European settlers experienced exceptionally severe winters.
Modern Warm Period
-
The Modern Warm Period starts around 1850 AD, which is also the time when people began systematically recording and collecting surface air temperature data from around the world.
These temperatures were spotty in the beginning, but by the middle of the 20th Century a fairly good worldwide temperature database was developing.
Finally, in 1979, satellites were launched that could give us a reasonably accurate and complete lower Troposphere temperature record over nearly the entire globe.
Quellen / Sources
-
Watts UP With That? (Antony Watts)
2011-01-24 en Easterbrook on the magnitude of Greenland GISP2 ice core dataConclusions
-
Temperature changes recorded in the GISP2 ice core from the Greenland Ice Sheet show that the magnitude of global warming experienced during the past century is insignificant compared to the magnitude of the profound natural climate reversals over the past 25,000 years, which preceded any significant rise of atmospheric CO2.
-
If so many much more intense periods of warming occurred naturally in the past without increase in CO2, why should the mere coincidence of a small period of low magnitude warming this century be blamed on CO2?
-
-
Watts UP With That? (Antony Watts)
2015-11-29 en Andy May: Climate and Human Civilization over the last 18,000 yearsEvidence of organized human civilizations during the last glacial period
If there were any organized human civilizations during the last glacial period we have not found any evidence of it, other than some pottery in China, dated to 20,000 BP.
At this time people lived in small communities of a few families and hunted for animals and edible natural vegetation.
Conclusions
-
Correlation is not causation, but many, if not all, of man's worst times since the last glacial maximum occur during colder and dryer periods.
Often these times were made worse by warfare as in the Greek Dark Ages, the sacking of Rome, the collapse of the Akkadian Empire, etc.
The colder and more arid climate could have been part of the cause of the wars.
We go to war when we are starving and thirsty.
-
More importantly, I was unable to find evidence of a crisis that was due to warming.
-
Given that man-made Carbon Dioxide is a very recent phenomenon, the radical climatic changes before 200 years ago cannot be attributed to man's influence.
They must be natural.
-
The recent warming of 0.85°C from 1880 to 2012 is pretty small compared to other temperature changes in the Holocene.
-
It is clear from history that natural forces can cause significant climate changes.
It is also clear that droughts are usually associated with colder periods, not warmer periods.
-
Some climate changes are probably due to variations in the Earth's orbit, but some might be due to variations in TSI (total solar irradiance) or other solar influences.
How much is due to nature and how much is due to man is unknown.
-
Much of the last 18,000 years is characterized by more rapid sea-level rise than we see today.
The current rise of sea level is very slow relative to the past and we are arguably more adaptable due to modern technology.
Precipitation
The history of civilization shows that cooler periods have less precipitation than warmer times.
It seems counter-intuitive, but warm air has a higher water carrying capacity and this leads to more rain. For example, the Sahara is now becoming greener as Carbon Dioxide and air temperature go up.
In the words of Steven Mithen
-
"The next century of human-made global warming is predicted to be far less extreme than that which occurred at 9600 BC [11,600 BP].
At the end of the Younger Dryas, mean global temperature had risen by 7°C in fifty years, whereas the predicted rise for the next hundred years is less than 3°C.
The end of the last ice age led to a 120 meter increase in sea level, whereas that predicted for the next fifty years is a paltry 32 centimeters at most,..."
-
⇧
G2 Klima vor 10'000 Jahren bis heute - Das Holozän
en
Climate 10,000 years ago until today - the Holocene
fr
Le climat il y a 10 000 ans jusqu'à aujourd'hui
- l'Holocène
Mit folgenden Links wird von anderen Webseiten auf diese Seite verwiesen:
| de | en | fr |
|---|---|---|
|
Klima Geschichte Klima vor 10'000 Jahren bis heute Das Holozän |
Climate History Climate 10,000 years ago until today The Holocene |
Histoire du climat Le climat il y a 10 000 ans jusqu'à aujourd'hui l'Holocène |
- G2 a de Das Holozän
- G2 b de Temperaturverlauf der letzten 11'000 Jahre
- G2 c de Wir leben heute in einer Warmzeit eines Eiszeitalters
- G2 d de Temperaturrekonstruktion aus grönländischen Eisbohrkernen
- G2 e de Temperaturrekonstruktion aus Tropfsteinen
- G2 f en Tree rings: Summer temperature anomalies for the past 7000 years
- G2 g
de
Klimawirksamkeit der Sonne während der vergangenen 9000 Jahre
en Powerful correlation between sun and climate over the last 9000 years - G2 h de
Solarflaute vor 2800 Jahren löste Kälteperiode in Mitteleuropa aus
en Climatic effects of a solar minimum: grand solar minimum and climate response
recorded for first time in same climate archive - G2 i de
Die Aktivität der Sonne in den letzten 10'000 Jahren
en The activity of the sun in the last 10000 years
fr L'activité solaire dans les 10000 dernières années - G2 j de Was geschah vor 10 000 Jahren?
- G2 k de
"Anthropozän" fällt bei Kommission zur Stratigraphie glatt
durch
en Blow to warmists, the proposed 'Anthropocene' epoch has been denied by ICS
↑
G2 a Das Holozän
en Holocene
fr Holocène
de Das Holozän en The Holocene fr Le holocène
|
|
||||||
|

![]() Die unterschlagene historische COMNISPA-Temperaturkurve
Die unterschlagene historische COMNISPA-Temperaturkurve
![]()
![]() Temperaturentwicklung der letzten 2000 Jahre auf der außertropischen
Nordhemisphäre
Temperaturentwicklung der letzten 2000 Jahre auf der außertropischen
Nordhemisphäre
RWP = Roman Warm Period
DACP = Dark Ages Cold Period
MWP = Medieval Warm Period
LIA = Little Ice Age
CWP = Modern Warm Period
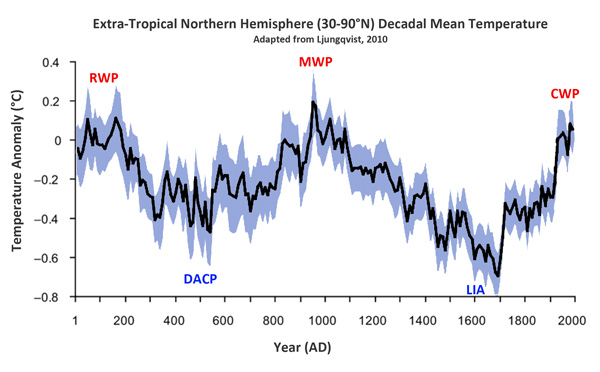
![]()
![]() Wassertemperaturen der vergangenen 2000 Jahre
Wassertemperaturen der vergangenen 2000 Jahre

- TU Berlin de Holozän
-
Climate Change Science en
Climate Is Always Changing
Vor 10'000 Jahren folgte auf die Wurm-Eiszeit das bis heute andauernde Holozän mit dem Nacheiszeitlichen Optimum, das bis etwa 4'000 Jahre vor heute gedauert hat.
-
Die meisten Paradiesmythen schildern ein längst vergangenes, Goldenes Zeitalter, in dem die Menschen ohne Furcht und Mangel lebten.
Die älteste bekannte Paradiesvorstellung stammt von den Sumerern, die in Mesopotamien vor über 5000 Jahren lebten.
In dem Mythos wird ein Land beschrieben, dessen Felder ewig grün und fruchtbar sind und aus dessen Erde reine Quellen sprudeln.
Dieses Land ist von Göttern und Göttinnen bevölkert, die frei von Krankheit, Tod und Mühsal sind.
Das Paradies, von dem die Mythen berichten, hat es tatsächlich gegeben.
Der Stuttgarter Geograph Professor Wolf Dieter Blümel ist davon überzeugt, dass die Mythen einen ganz realen Hintergrund haben.
Auf die letzte Würm-Eiszeit folgte vor 10.200 Jahren die jetzige Warmzeit, das Holozän. Zu diesem Zeitpunkt etwa zwischen 10.000 bis 4.000 vor heute war es auf der Erde so warm, wie es bis heute nicht mehr gewesen ist.
Stonehenge kann als Paradebeispiel am Ende dieser prosperierenden Wärmeperiode gelten, denn es gehört viel Energie dazu, die gewaltigen Stelen und Steinsäulen über lange Strecken zu transportieren.
Es muss eine Überschussproduktion an Lebensmitten gegeben haben.
Eine darbende Gesellschaft hätte dies nicht zuwege gebracht
Vor 5'300 Jahren
-
Vor 5300 Jahren schneit ein Mann in den Ötztaler Alpen ein, mumifiziert, und die Schneedecke gibt den Mann am Hauslabjoch - der populär geworden ist als "Ötzi" - erst in unseren Tagen wieder frei.
Es muss damals als der Mann ums Leben kam, ein sprunghafter Klimawechsel stattgefunden haben.
Denn vor diesem Zeitpunkt wanderten die Menschen aus dem heutigen Südtirol mit ihren Herden regelmäßig nach Nordtirol.
Ganz plötzlich, in einem Klimasprung muss es kälter geworden sein, so dass die Alpen nicht mehr passierbar waren.
In der Periode der so genannten Klimadepression der Bronzezeit wird es ein bis zwei Grad kälter als heute.
Die Folgen sind regionale Missernten und Versorgungsprobleme.
Aber die schwierigen Zeiten scheinen jetzt den Erfindergeist herauszufordern.
Obwohl der neue Werkstoff Bronze schon in der Jungsteinzeit bekannt war - Ötzi besaß ein Bronzebeil - erhält das neue Metall immer größere Bedeutung, bis es von einem anderen Metall, dem Eisen abgelöst wird.
-
Tagesschau.de
Tim Staeger / ARD-Wetterredaktion
2016-03-22 de KlimageschichteDie Menschheitsgeschichte ist eng mit Klimaschwankungen verknüpft.
Als vor etwa 11 000 Jahren die letzte Eiszeit zu Ende ging und sich die Eispanzer nach Norden zurückzogen begann eine sehr stabile Klimaperiode, die aufstrebenden Hochkulturen ideale Entwicklungsbedingungen bot.
Aber auch geringere Klimaschwankungen führten in Europa zu historischen Umwälzungen.
Die Letzte Eiszeit
Die Letzte Eiszeit dauerte etwa 60 000 Jahre und war geprägt von starken Klimaschwankungen.
Seit etwa 11 000 Jahren befinden wir uns im sogenannten Holozän
Seit etwa 11 000 Jahren befinden wir uns im sogenannten Holozän oder Neo-Warmzeit, welches durch ein stabiles Klima geprägt war.
Tatsächlich fanden die frühen Hochkulturen am Nil und im Zweistromland ideale Bedingungen vor, welche ihnen sehr gute Ernteerträge einbrachten, was den Aufstieg Ägyptens und Mesopotamiens erst ermöglichte.
Die Sahara war zu dieser Zeit eine Savanne mit reichlichen Wasservorkommen durch die Giraffen und Elefanten zogen, wie alte Fels- und Höhlenmalereien bezeugen.
Optimum der Römerzeit
Auch die als Optimum der Römerzeit bezeichnete, recht warme Periode zwischen 100 und 500 n. Chr. fällt wohl nicht ganz zufällig mit der Blütezeit des Römischen Reiches zusammen.
Jedenfalls steht diese Epoche in deutlichem Gegensatz zu dem darauffolgenden Pessimum der Völkerwanderungszeit.
Pessimum der Völkerwanderungszeit
Denn zwischen etwa 400 und 600 n. Chr. verschlechterten sich die klimatischen Bedingungen in Europa wieder und die ausbleibenden Ernten zwangen viele germanische Völker ihren angestammten Lebensraum zu verlassen und sich auf die Suche nach einer neuen Heimat zu machen.
Das Mittelalterliche Optimum
Darauf folgte zwischen 800 und 1300 das Mittelalterliche Optimum, in dem es ähnlich warm war, wie in der letzten Klimanormalperiode von 1961 bis 1990, deren Mitteltemperatur als Bezugswert verwendet wird.
Da aus dieser Zeit keine direkt gemessenen Daten existieren, sondern beispielsweise die Breite von Baumringen oder Eisbohrkerne zu Rate gezogen werden, sind die Unsicherheiten aber größer als bei direkt gemessenen Temperaturwerten.
Jedoch deuten viele deutsche Ortsnamen aus dieser Zeit auf Weinanbau in Regionen hin, in denen es bis vor Kurzem noch zu kühl dafür war.
Die Wikinger besiedelten 982 zum ersten Mal Grönland
Des Weiteren besiedelten die Wikinger 982 zum ersten Mal Grönland, was übersetzt "Grünland" bedeutet.
Die Kleine Eiszeit
Sie mussten jedoch etwa 200 Jahre später ihre Siedlungen dort wieder aufgeben, da erneut eine kühlere Klimaepochen, die sogenannte "Kleine Eiszeit" begann.
Sie war charakterisiert von sehr strengen und langen Wintern, sowie kühlen Sommern.
Es ist belegt, dass die Ostsee im 15. Jahrhundert mindestens zweimal komplett zufror.
Die Gletschervorstöße in den Alpen in dieser Zeit waren die stärksten der letzten etwa 10.000 Jahre.
Hungersnöte und Auswanderungswellen in die Neue Welt waren die Folge.
Es wird sogar ein Zusammenhang zwischen dem Höhepunkt der Hexenverbrennungen und einer besonders kalten Phase zu Beginn des 17. Jahrhunderts vermutet.
Ursache hierfür sind Schwankungen der Sonneneinstrahlung und eine Reihe besonders starker Vulkanausbrüche, die zu einer weltweiten Abkühlung in den Folgejahren führten.
Das eindrucksvollste Beispiel ist der Ausbruch des Tambora in Indonesien 1815.
Das Folgejahr ist als "Jahr ohne Sommer" in die Geschichte eingegangen.
Die unausweichlichen Missernten ließen vor allem in Süddeutschland den Getreidepreis auf das Dreifache ansteigen.
↑ G2 b Temperaturverlauf der letzten 11'000 Jahre
|
|
|
|
|
Auch in der GFZ-Graphik finden sich die historisch bestens dokumentierten Schwankungen in den letzten 1.000 Jahren - und noch ein paar ältere mehr. Wie sich der Graphik entnehmen läßt, hat es weit vor jedem denkbaren menschlichen Einfluß nicht nur Schwankungen gegeben, es war teilweise auch noch wärmer als momentan. Die vergangenen Schwankungen fallen nach den Ergebnissen der Studie mit Schwankungen der Sonenaktivität zusammen. Es besteht also überhaupt keine Notwendigkeit, eine Erklärung auf der Grundlage von CO2 zu versuchen. Das bedeutet für die Gegenwart, die ebenfalls von besonders intensiver Sonnenaktivität gekennzeichnet ist: Wenn in der Vergangenheit ohne Kohlendioxidschwankungen und ohne menschlichen Einfluß Klimaveränderungen aufgetreten sind, die sich mit Mechanismen erklären lassen, welche auch gegenwärtig wirksam sind, wieso sollte dann ein gegenwärtiger Erwärmungstrend nicht dieselben, vom Menschen unabhängigen Ursachen haben? Oder kurz: Die Hypothese vom menschengemachten Kohlendioxid-Treibhauseffekt ist als falsch widerlegt! |
||
Northern Hemisphere Temperatures
![]()
![]()
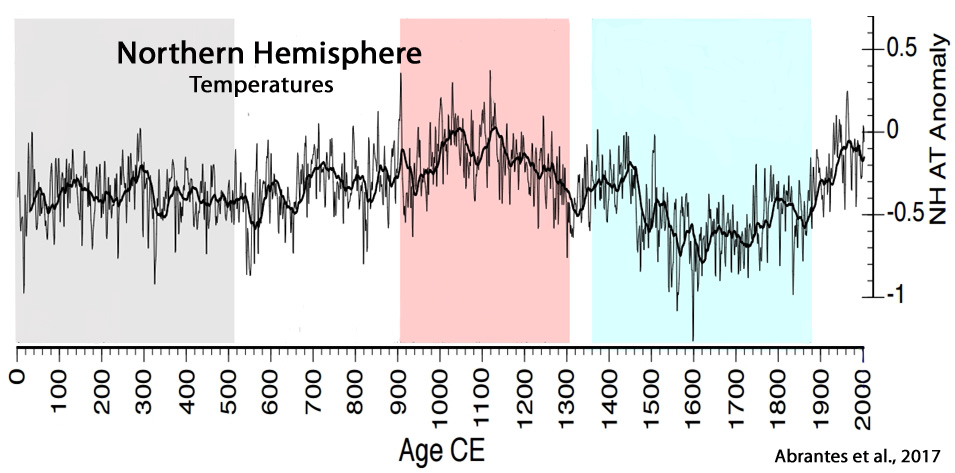
![]()
![]()
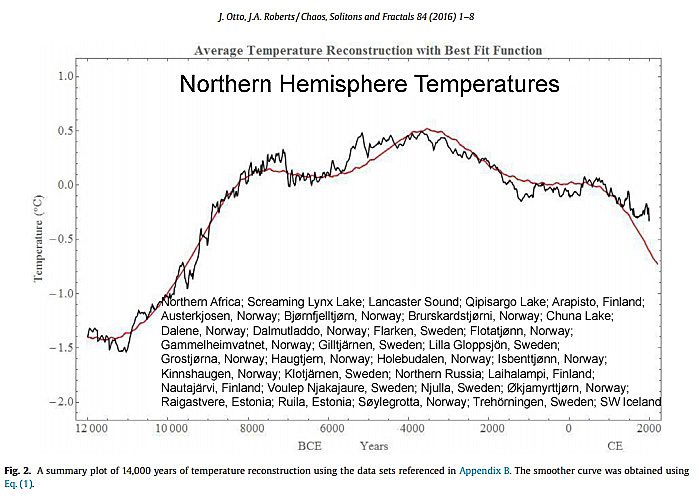
-
NoTricksZone / Pierre L. Gosselin
2017-04-20 en NEW RESEARCH: MEDIEVAL WARM PERIOD WAS AS WARM AS TODAYNew research papers suggest Northern hemisphere temperatures during the Medieval Warm Period were as warm as recent decades.
Grönlandisches Eisschild:
Temperatur & Sonne /
Temperatur & CO2
en Greenland Is Way Cool
Greenland ice sheet:
Temperature & Sun /
Temperatur & CO2
![]()
![]() Grönlandisches Eisschild / Greenland ice sheet
Grönlandisches Eisschild / Greenland ice sheet
1 Temperatur & Sonne / Temperature & Sun
Temperature (left scale)
Summer insolation in watts (right scale)
Average ice sheet temperature
1960-1980

![]()
![]() Temperaturentwicklung
and
CO2
des grönlandischen Eisschildes
Temperaturentwicklung
and
CO2
des grönlandischen Eisschildes
2 Temperatur & CO2 /
Temperature & CO2
Temperature (left scale)
Ice core CO2 data, 9000 BCE - 1515 AD

-
Die kalte Sonne (Fritz Vahrenholt & Sebastian Lüning)
2019-04-30 de Anastasios Tsonis: Wir müssen zunächst die natürliche Klimavariabilität verstehen, bevor wir den anthropogenen Anteil am Klimawandel einschätzen könnenGrönlandisches Eisschild: Temperatur & Sonne / Temperatur & CO2
Die Vergangenheit ist der Schlüssel für die Zukunft.
Wenn wir die vorindustrielle Klimageschichte und ihre natürlichen Antriebe verstehen, können wir auch die Klimazukunft besser prognostizieren.
Willis Eschenbach hat auf WUWT einen Blick auf die Klimageschichte Grönlands während der vergangenen 12.000 Jahre geworfen.
In seinem lesenswerten Kurzbeitrag erinnert er daran, dass die Durchschnittstemperaturen dort im Zeitraum von 8300-800 v. Chr. - also mehr als sieben Jahrtausende lang -
oberhalb der Mitteltemperatur von 1960-1980 lag.
Und selbst wenn wir die modernen Temperaturen aus dem 21. Jahrhundert verwenden, bleibt noch immer eine lange vorindustrielle Periode, während der es in Grönland wärmer war als heute.
Hatten Sie das gewusst?
-
Watts UP With That? (Anthony Watts) / Willis Eschenbach
2019-01-08 en Greenland Is Way Cool1 Temperature & Summer insolation
Figure 1 shows the full length of the data, along with the change in summer insolation at 75°N, the general location of the ice cores used to create the temperature dataset.
The insolation swing shown above is about fifty watts per square metre.
Over the period in question, the temperature dropped about two and a half degrees from the peak in about 5800 BCE.
That would mean the change is on the order of 0.05°C for each watt per square metre change in insolation ...
From about 8300 BCE to 800 BCE,
the average temperature of the ice sheet, not the maximum temperature but the average temperature of the ice sheet, was greater than the 1960-1980 average temperature of the ice sheet.
That's 7,500 years of the Holocene when Greenland's ice sheet was warmer than recent temperatures.
2 Temperature and CO2
Figure 2 shows the same temperature data as in Figure 1, but this time with the EPICA Dome C ice core CO2 data.
Hmmm ... for about 7,000 years,
CO2 is going up ...
and Greenland temperature is going down ...
who knew?
|
|
Grönlandisches Eisschild: Temperatur & Sonne / Temperatur & CO2 Klima-Beobachtungen: Korrelationen mit der Sonne Klima Geschichte: Klima vor 10'000 Jahren - Das Holozän Solarer Einfluss in der Klima-Geschichte: Temperatur und CO2-Konzentration |
↑ G2 c Wir leben heute in einer Warmzeit eines Eiszeitalters
-
ESA Europäische Weltraumorganisation
de Heute: Wir leben im EiszeitalterWenig bewusst ist uns die Tatsache, dass wir in einem Eiszeitalter leben, dem quartären Eiszeitalter.
Es ist nicht das erste und wird auch nicht das letzte Eiszeitalter sein. Das sind Abschnitte der Erdgeschichte, in denen die mittlere Temperatur so weit absank, dass gewaltige Flächen mit einem dicken Eispanzer überzogen wurden sowie Dauerfrostböden und Meereis auftraten.
Die genannten Eigenschaften treffen auf die heutige Erde zu: Gegenwärtig sind rund 16 Mill. km2 der Landoberfläche unter Inlandeis und Gletschern begraben. Das sind fast 11 Prozent des Festlandes. Wird der - teilweise bis weit über 1500 Meter mächtige - Dauerfrostboden in Eurasien und Nordamerika hinzugerechnet, so sind etwa 37 Mill. km2 der Landflächen vereist. Das ist nahezu ein Viertel der Festlandsfläche.
Aus der Erdgeschichte ist bekannt, dass in den letzten 950 Millionen Jahren mindestens sechs bedeutende Eiszeitalter auftraten. Jede dieser Perioden ist durch einen wellenartigen Wechsel von Kaltzeiten (sehr große Gebiete der Erde sind vereist) und Warmzeiten (ein kleiner Teil der Erde ist vereist) gekennzeichnet.
Die letzte Kaltzeit endete vor 11 000 Jahren und es begann eine neue Warmzeit.
Wir leben also heute in einer Warmzeit des quartären Eiszeitalters. Sie wird von Geologen als Holozän bezeichnet. Erst wenn kein Eis mehr auf der Erdoberfläche auftritt, hat das quartäre Eiszeitalter sein Ende gefunden.
↑ G2 d Temperaturrekonstruktion aus grönländischen Eisbohrkernen
![]()
![]() Greenland Ice Core data:
Almost all of the past 10,000 years were warmer than the past 1500 years
Greenland Ice Core data:
Almost all of the past 10,000 years were warmer than the past 1500 years

-
Die kalte Sonne
2012-10-12 en The past is the key to the future: Temperature history of the past 10,000 yearsTemperatures for almost all of the 10,000 year record were higher than those in 1987.
The last 1500 years or so were cooler.
Thawing out has occurred since the Little Ice Age, but temperatures are not yet back to where they had been for almost all of the Holocene.
↑ G2 e Temperaturrekonstruktion aus Tropfsteinen
|
|
|

↑ G2 f Tree rings: Summer temperature anomalies for the past 7000 years
|
|
|

↑
G2 g Klimawirksamkeit der Sonne während der vergangenen 9000 Jahre
en
Powerful correlation between sun and climate over the last 9000 years
![]()
![]()
Vergleich der Sonnenaktivität (blaue Kurve) und der asiatischen
Klimaentwicklung (grüne Kurve, delta 18O eines Stalagmiten aus einer
chinesischen Höhle) für die vergangenen 9000 Jahre (beide Kurven sind
normiert).
Es ist eine gute Übereinstimmung der beiden Kurven zu erkennen,
was auf einen signifikanten Antrieb des Klimageschehens durch die
Sonne hinweist.

-
Die kalte Sonne (Fritz Vahrenholt & Sebastian Lüning)
2012-05-03 de Neue Arbeit in PNAS belegt die Klimawirksamkeit der Sonne während der vergangenen 9000 JahreDer Weltklimarat hält die Sonne für klimatisch wenig bedeutsam und ordnet ihr in seinen Klimamodellen eine verschwindend geringe Klimawirksamkeit zu.
Während anthropogene Faktoren fast die gesamte Erderwärmung seit 1850 erklären sollen, bilden solare Aktivitätsschwankungen nur unbedeutendes Beiwerk.
Eine neue Arbeit eines internationalen Forscherteams um Friedhelm Steinhilber vom Schweizerischen Bundesinstitut für aquatische Wissenschaften und Technologie (Eawag) hat nun weitere wichtige Hinweise für die Wirksamkeit der Sonne in der nacheiszeitlichen Klimaentwicklung gefunden.
Die Gruppe, zu der auch der Glaziologe Hans Oerter vom Alfred-Wegener-Institut in Bremerhaven gehört, veröffentlichte seine Ergebnisse im April 2012 in den Proceedings of the National Academy of Sciences (PNAS).
Anhand mehrerer antarktischer und grönländischer Eiskerne sowie globaler Baumringdaten rekonstruierten die Wissenschaftler die Sonnenaktivität für die vergangenen 9000 Jahre.
Hierzu verwendeten sie sogenannte kosmogene Beryllium- und Kohlenstoff-Isotope, 10Be und 14C, deren Häufigkeit auf der Erde von der Stärke des Sonnenmagnetfeldes und damit der Sonnenaktivität gesteuert wird.
Die Gruppe führte auch eine Spektralanalyse der neuen Sonnenaktivitätskurve durch und fand wie erwartet die üblichen charakteristischen Solarzyklen, darunter auch
- der Suess-de Vries Zyklus mit einer Periode von 210 Jahren,
- den Eddy-Zyklus (1000 Jahre)
- sowie den Hallstatt-Zyklus (2300 Jahre).
Die Minima der Millenniumszyklik, die auch als "Grand Solar Minima" bezeichnet werde, fallen dabei meist in die Minima der Suess-de Vries Zyklen.
Überlagert ist die Zyklik durch ein langfristiges An- und Abschwellen des Signals, das durch Erdbahnveränderungen im Zusammenhang mit den Milankovic-Zyklen hervorgerufen wird.
Milankovic ist unter anderem für die warmen Temperaturen des holozänen Klimaoptimums vor 6000 Jahren verantwortlich, die deutlich über den heutigen lagen.
Dieses Erdbahnparameter-Signal zogen Steinhilber und Kollegen von ihren Daten ab, um die primäre Sonnenaktivität herauszufiltern.
Das Forscherteam verglich die neue Rekonstruktion der Sonnenaktivität mit einem Klimadatensatz, der vor einiger Zeit von Kollegen in einer chinesischen Höhle gewonnen wurde und ebenfalls die letzten 9000 Jahre abdeckt.
Die Schwankungen der 18O-Sauerstoff-Isotopen-Konzentration bilden dabei Niederschlagsschwankungen und die Stärke des asiatischen Monsuns ab.
Es ergab sich eine überraschend gute Übereinstimmung zwischen Sonnenaktivität und asiatischer Klimaentwicklung (siehe Abbildung).
-
NoTricksZone (P Gosselin)
2012-05-05 en PNAS Study Shows Powerful Correlation Between Sun And Climate Over The Last 9000 YearsThe IPCC thinks the sun plays nary a role on climate and that anthropogenic factors explain almost the entire warming since 1850.
Now a new paper by the international team of scientists led by Friedhelm Steinhilber of the Swiss Federal Institute for Aquatic Sciences and technology (Eawag) has just produced yet more important evidence of the sun^'s impact on the Holocene climate development.
The group, which also includes glaciologist Hans Oerter of the Alfred Wegener Institute in Bremerhaven, Germany, published the results last month in the Proceedings of the National Academy of Sciences (PNAS)
Using multiple Antarctic and Greenland ice cores and global tree-ring data, the scientists reconstructed solar activity over the last 9000 years. T
They also used the so-called cosmogenic beryllium and carbon isotopes 10Be and 14C, whose frequency on Earth is controlled by the strength of the sun's magnetic field, and thus by solar activity.
The group carried out a spectral analysis of the new solar activity curves and found, as expected, the usual characteristic solar cycles, among them also
- the 210-year Suess-de Vries cycle,
- the 1000-year Eddy-cycle
- and the 2300-year Hallstatt-cycle.
The Grand Solar Minima coincided mostly with the minima of the Suess-de Vries cycles.
The cycles are superimposed by the longterm rising and falling signal of orbital changes associated with the Milankovitch cycles.
The Milankovitch cycle is in part responsible for the warm temperatures of the Holocene Optimum 6000 years ago, when it was considerably warmer than today.
Steinhilber and his colleagues removed these orbital signals from the data in order to filter out the primary solar activity.
They then compared the new solar activity reconstruction with a climate dataset earlier obtained by colleagues in a Chinese cave covering the last 9000 years.
The fluctuations in the 18O-oxygen isotope concentrations show the precipitation fluctuations and the intensity of the Asian monsoons.
What resulted was a surprising agreement between solar activity and the Asian climate development (see Figure 1 above).
Referenzen / References:
-
PNAS
Friedhelm Steinhilber, Jose A. Abreu, Jürg Beer, Irene Brunner, Marcus Christl, Hubertus Fischer, Ulla Heikkilä, Peter W. Kubik, Mathias Mann, Ken G. McCracken, Heinrich Miller, Hiroko Miyaharag, Hans Oerter, and Frank Wilhelms
2012-02-14 en 9,400 years of cosmic radiation and solar activity from ice cores and tree ringsAbstract
Understanding the temporal variation of cosmic radiation and solar activity during the Holocene is essential for studies of the solar-terrestrial relationship.Cosmic-ray produced radionuclides, such as 10Be and 14C which are stored in polar ice cores and tree rings, offer the unique opportunity to reconstruct the history of cosmic radiation and solar activity over many millennia.
Although records from different archives basically agree, they also show some deviations during certain periods.
So far most reconstructions were based on only one single radionuclide record, which makes detection and correction of these deviations impossible.
Here we combine different 10Be ice core records from Greenland and Antarctica with the global 14C tree ring record using principal component analysis.
This approach is only possible due to a new high-resolution 10Be record from Dronning Maud Land obtained within the European Project for Ice Coring in Antarctica in Antarctica.
The new cosmic radiation record enables us to derive total solar irradiance, which is then used as a proxy of solar activity to identify the solar imprint in an Asian climate record.
Though generally the agreement between solar forcing and Asian climate is good, there are also periods without any coherence, pointing to other forcings like volcanoes and greenhouse gases and their corresponding feedbacks.
The newly derived records have the potential to improve our understanding of the solar dynamics and to quantify the solar influence on climate.
-
Science
Gerard Bond, Bernd Kromer, Juerg Beer, Raimund Muscheler, Michael N. Evans, William Showers, Sharon Hoffmann, Rusty Lotti-Bond, Irka Hajdas and Georges Bonani
2001-11-15 en Persistent Solar Influence on North Atlantic Climate During the HoloceneAbstract
Surface winds and surface ocean hydrography in the subpolar North Atlantic appear to have been influenced by variations in solar output through the entire Holocene.The evidence comes from a close correlation between inferred changes in production rates of the cosmogenic nuclides carbon-14 and beryllium-10 and centennial to millennial time scale changes in proxies of drift ice measured in deep-sea sediment cores.
A solar forcing mechanism therefore may underlie at least the Holocene segment of the North Atlantic's "1500-year" cycle.
The surface hydrographic changes may have affected production of North Atlantic Deep Water, potentially providing an additional mechanism for amplifying the solar signals and transmitting them globally.
↑
G2 h Solarflaute vor 2800 Jahren löste Kälteperiode in Mitteleuropa
aus
en Climatic effects of a solar minimum:
grand solar minimum and climate response recorded for first time in
same climate archive
de
-
Die kalte Sonne (Fritz Vahrenholt & Sebastian Lüning)
2012-05-08 de Solarflaute vor 2800 Jahren löste Kälteperiode in Mitteleuropa ausSeen bilden ein ausgezeichnetes Klimaarchiv.
Lage für Lage stapeln sich die Sedimentschichten im Laufe der Zeit wie in einem Geschichtsbuch.
Aus den Ablagerungen kann durch die Analyse charakteristischer Materialwechsel im Jahresrhythmus, Fossilinhalt und Schwankungen der chemischen Zusammensetzung das Klima der Vorzeit rekonstruiert werden.
Geowissenschaftler des Deutschen GeoForschungsZentrums GFZ in Potsdam haben sich nun gemeinsam mit schwedischen und niederländischen Kollegen die Klimageschichte eines Eifel Maar vorgeknöpft, des Meerfelder Maar.
Dabei konzentrierten sie sich auf die Zeit 3300 bis 2000 Jahre vor heute, die sogenannte Eisenzeit.
Bei ihrer Analyse stießen die Forscher auf eine abrupte Klimaverschlechterung die vor knapp 2800 Jahren begann und fast 200 Jahre andauerte.
Die Temperaturen kühlten sich spürbar ab, es wurde feuchter und die Winde verstärkten sich.
Eine ungemütliche Zeit.
Danach entspannte sich die klimatische Situation wieder.
Zeitgleich zur solaren Schwächephase
Die Forschergruppe um Celia Martin-Puertas konnte zeigen, dass die Abkühlungsphase zeitgleich zur solaren Schwächephase verlief.
Als die Sonne schließlich wieder aufdrehte, begannen auch die Temperaturen wieder anzusteigen.
Es muss daher davon ausgegangen werden, dass die Klimaschwankungen durch Änderungen der Sonnenaktivität verursacht wurden.
-
Süddeutsche Zeitung
2012-05-07 de Schmuddelwetter zu Homers ZeitenVor 2800 Jahren wurde es in Europa plötzlich kühler, 200 Jahre lang waren die Winter besonders windig.
Ein internationales Forscherteam konnte nun zeigen, dass die Klimaänderung mit einem Phänomen zusammenhing, das nach dem griechischen Dichter Homer benannt ist.
Als Homer irgendwo in Griechenland seine Epen schrieb, waren die Winter in Mitteleuropa besonders unangenehm.
Einen Teil der Verantwortung weisen Klimaforscher jetzt der Sonne zu, genauer einer ihrer magnetischen Schwächeperioden.
200 Jahre lang waren dann die Winter von heftigeren Winden als gewöhnlich geprägt, während auf der Sonne die Magnetfelder, die sich zum Beispiel in der Zahl der Sonnenflecken äußern, Pause machten.
Beide Phänomene, das Homersche Minimum der Sonnenaktivität und die Abkühlung Europas, waren schon vorher bekannt.
Die Forscher um Brauer konnten aber den direkten Zusammenhang beider aus ihren Daten ablesen.
Sie haben Sedimente aus dem Meerfelder Maar in der Eifel untersucht, die eine Struktur wie Jahresringe haben.
Vor 2800 Jahren wurden diese plötzlich doppelt so dick wie zuvor.
Der Zuwachs ging allein auf eine gesteigerte Algenblüte zurück.
Heftige Winde und Wellen hätten das Wasser aufgewühlt und mehr Phosphor ins oberflächennahe Wasser gespült, wo die Algen es wie Dünger aufnahmen, vermuten die Forscher mangels anderer Erklärungen.
Doch daneben enthielten die Sedimente eine Botschaft aus dem All.
"Wir haben einen gleichzeitigen Anstieg von Berryllium-10 gefunden", sagt Achim Brauer.
"Das ist ein Isotop aus der kosmischen Strahlung, das bei einer schwachen Sonne in stärkerem Ausmaß auf die Erde kommt."
-
Spiegel Online
2012-05-06 de Klimageschichte: Schwächelnde Sonne löste antike Kälteperiode ausForscher konnten jetzt anhand von Bohrkernen aus einem See in der Eifel nachweisen, dass eine Schwächeperiode der Sonnenaktivität vor 2800 Jahren eine Kälteperiode ausgelöst hat.
Eine dieser Kälteperioden, das sogenannte Homerische Minimum, ereignete sich vor rund 2800 Jahren. Volle 200 Jahre mussten die Europäer bibbern - jetzt hat ein internationales Wissenschaftlerteam unter Leitung des Geoforschungszentrums Potsdam (GFZ) herausgefunden, dass offenbar die niedrige Aktivität der Sonne verantwortlich war.
Die Wissenschaftler glauben, hier einen Verstärkungsmechanismus gefunden zu haben. Er könnte laut Brauer erklären, "warum die häufig als gering angesehenen Schwankungen der Solarstrahlung zumindest regional deutliche klimatische Auswirkungen mit weitreichenden Konsequenzen haben".
Eine chemische Analyse der Warven erbrachte Hinweise auf die Ursache der stärkeren Frühjahrswinde. Zur gleichen Zeit sank der Gehalt des Elements Beryllium-10 in den Ablagerungen deutlich ab. Dieses Beryllium-Isotop wird immer dann im Gestein gebildet, wenn es Strahlung ausgesetzt ist. Die geringe Beryllium-Menge in den Warven zeigt daher an, dass während der Kälteperiode vor 2800 Jahren auch die Sonneneinstrahlung geringer war. Vor allem die UV-Strahlung könnte damals um fünf bis acht Prozent gesunken sein, mutmaßen die Forscher.
en
-
ScienceDaily
2012-05-06 en Climatic Effects of a Solar Minimum: Grand Solar Minimum and Climate Response Recorded for First Time in Same Climate ArchiveAn abrupt cooling in Europe together with an increase in humidity and particularly in windiness coincided with a sustained reduction in solar activity 2800 years ago.
Scientists from the German Research Centre for Geosciences GFZ in collaboration with Swedish and Dutch colleagues provide evidence for a direct solar-climate linkage on centennial timescales.
Using the most modern methodological approach, they analysed sediments from Lake Meerfelder Maar, a maar lake in the Eifel/Germany, to determine annual variations in climate proxies and solar activity.
The study published online this week in Nature Geoscience reports the climatic change that occurred at the beginning of the pre-Roman Iron Age and demonstrates that especially the so-called Grand Minima of solar activity can affect climate conditions in western Europe through changes in regional atmospheric circulation pattern.
Around 2800 years ago, one of these Grand Solar Minima, the Homeric Minimum, caused a distinct climatic change in less than a decade in Western Europe.
The exceptional seasonally laminated sediments from the studied maar lake allow a precise dating even of short-term climate changes.
The results show for a 200 year long period strongly increased springtime winds during a period of cool and wet climate in Europe.
In combination with model studies they suggest a mechanism that can explain the relation between a weak sun and climate change.
"The change and strengthening of the tropospheric wind systems likely is related to stratospheric processes which in turn are affected by the ultraviolet radiation" explains Achim Brauer (GFZ), the initiator of the study.
"This complex chain of processes thus acts as a positive feedback mechanism that could explain why assumingly too small variations in solar activity have caused regional climate changes."
-
Watts Up With That? (Antony Watts)
2009-05-07 en Solar grand minima linked to cooling period in EuropeThis is interesting.
A quick cooling in Europe together with an increase in humidity and particularly in windiness was found to coincide with a long-term reduction in solar activity 2800 years ago during something called the "Homeric minimum".
Referenzen / References:
-
Nature Geoscience
Celia Martin-Puertas, Katja Matthes, Achim Brauer, Raimund Muscheler, Felicitas Hansen, Christof Petrick, Ala Aldahan, Göran Possnert & Bas van Geel
2012-05-06 en Regional atmospheric circulation shifts induced by a grand solar minimumAbstract
Large changes in solar ultraviolet radiation can indirectly affect climate by inducing atmospheric changes.Specifically, it has been suggested that centennial-scale climate variability during the Holocene epoch was controlled by the Sun.
However, the amplitude of solar forcing is small when compared with the climatic effects and, without reliable data sets, it is unclear which feedback mechanisms could have amplified the forcing.
Here we analyse annually laminated sediments of Lake Meerfelder Maar, Germany, to derive variations in wind strength and the rate of 10Be accumulation, a proxy for solar activity, from 3,300 to 2,000 years before present.
We find a sharp increase in windiness and cosmogenic 10Be deposition 2,759? ±? 39 varve years before present and a reduction in both entities 199? ±? 9 annual layers later.
We infer that the atmospheric circulation reacted abruptly and in phase with the solar minimum.
A shift in atmospheric circulation in response to changes in solar activity is broadly consistent with atmospheric circulation patterns in long-term climate model simulations, and in reanalysis data that assimilate observations from recent solar minima into a climate model.
We conclude that changes in atmospheric circulation amplified the solar signal and caused abrupt climate change about 2,800 years ago, coincident with a grand solar minimum.
↑
G2 i Die Aktivität der Sonne in den letzten 10'000 Jahren
en The activity of the sun in the last 10000 years
fr L'activité solaire dans les 10000 dernières années
![]()
![]()

-
EIKE Europäisches Institut für Klima und Energie
2019-12-29 de 13. IKEK in München: Sebastian Lüning - Wie viel Klima macht der Mensch?
|
The activity of the Sun over the last 11,400 years, i.e., back to the end of the last ice age on Earth, has now for the first time been reconstructed quantitatively by an international group of researchers led by Sami K. Solanki from the Max Planck Institute for Solar System Research (Katlenburg-Lindau, Germany). The scientists have analyzed the radioactive isotopes in trees that lived thousands of years ago. ...one needs to go back over 8,000 years in order to find a time when the Sun was, on average, as active as in the last 60 years. Based on a statistical study of earlier periods of increased solar activity, the researchers predict that the current level of high solar activity will probably continue only for a few more decades. |
|
|
|
|
|


↑ G2 j Was geschah vor 10 000 Jahren?
-
EIKE Europäisches Institut fü Klima und Energie
Dr. Gerhard Kühn
2016-06-24 de Was geschah vor 10 000 Jahren? Teil 1, Teil 2Diese Frage stellt sich die Menschheit schon seit tausenden von Jahren.
Die Wissenschaft, in Form von verschiedenen Einzeldisziplinen, die sich jeweils mit Erde, Wasser, Luft sowie Menschen, Tieren und Pflanzen beschäftigen, hat darauf bis heute keine eindeutige, von allen akzeptierte Antwort finden können.
Diese Zeit ist so bedeutsam, dass die Wissenschaft extra ein neues Erdzeitalter eingeführt hat, das "Holozän", mit einem relativ exakten Anfangsdatum 11650 Jahre vor Heute.
Diese Zeit ist mit einigen herausragenden Ereignissen verbunden, wie zum Beispiel das Ende der Eiszeit, das Aussterben der Großtiere wie der Mammuts auf der nördlichen Halbkugel,
ein Meeresspiegelanstieg von 120 m,
die Sintflut sowie (das ist weniger geläufig) die Bildung von riesigen Lössschichten.
↑
G2 k "Anthropozän" fällt bei Kommission zur Stratigraphie glatt
durch
en
Blow to warmists, the proposed 'Anthropocene epoch
has been denied by ICS
![]()
![]()
![]() INTERNATIONAL CHRONOSTRATIGRAPHIC CHART
INTERNATIONAL CHRONOSTRATIGRAPHIC CHART
Stratigraphie des Quartärs laut überarbeiteter Tabelle der
International Commission on Stratigraphy (ICS)
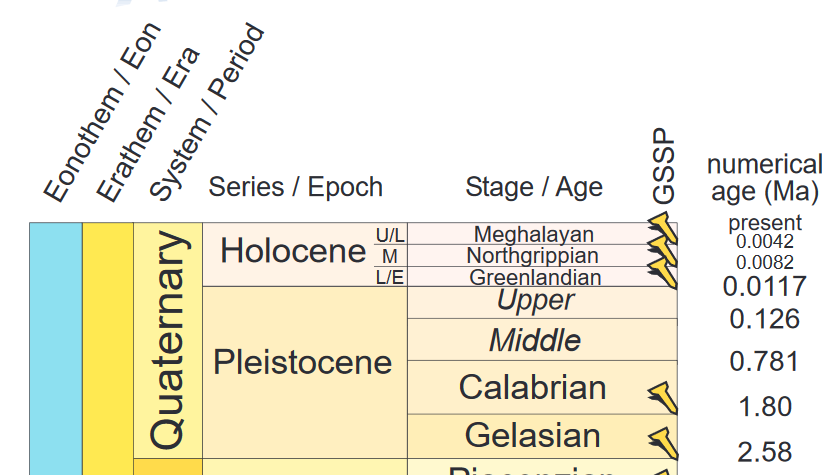
-
Die kalte Sonne (Fritz Vahrenholt & Sebastian Lüning)
2018-09-12 de "Anthropozän" fällt bei Kommission zur Stratigraphie glatt durchLeben wir in einer klimatisch außergewöhnlichen Zeit, die alles Vorherige in den Schatten stellt?
Dafür muss man in die klimatische Vergangenheit schauen.
Anhänger des Klimaalarmismus beschränken sich dabei auf die letzte 150 Jahre und kommen zu dem vorschnellen aber persönlich erhebenden Schluss:
Ja, wir sind Teil einer Entwicklung die es noch nie gegegben hat, und wir sind auch noch selber Schuld daran.
Wir mächtigen Menschen haben es geschafft, uns das Klima Untertan zu machen.
Wenn man jedoch den Vergleichszeitraum einige hundert und wenige tausend Jahre nach hinten erweitert, wird schnell klar, dass es stets einen Wechsel zwischen kalt und warm gegeben hat.
Es ist ernüchternd, aber auch unsere Vorfahren hatten bereits unter dem Klimawandel zu leiden bzw. profitierten teilweise auch davon.
Geologen werden speziell dafür ausgebildet, die Naturgeschichte zu dokumentieren und zu entschlüsseln.
Das hierzu benötigte Zeitgerüst heißt "Stratigraphie".
Und damit alles seine Ordnung hat, gibt es eine internationale Kommission zur Stratigraphie, die über Veränderungen im verwendeten Zeitschema wacht.
Eben diese Kommission hat sich im Juli 2018 zusammengesetzt und darüber diskutiert, wie man die letzten 12.000 Jahre (das sogenannte Holozän) am sinnvollsten gliedert.
Vertreter der harte Klimalinie hatten gefordert, die letzten 150 Jahre als "Anthropozän" zu bezeichnen.
Dieser Vorschlag wurde jetzt vom Gremium klar abgelehnt.
Stattdessen unterteilte man das Holozän in drei Stufen.
Oberes Holozän: Meghalayan (4200 Jahre vor heute bis heute)
Mittleres Holozän: Northgrippian (8200 bis 4200 Jahre vor heute)
Unteres Holozän: Greenlandian (11.700 bis 8200 Jahre vor heute)
-
Watts UP With That? (Antony Watts)
2018-08-13 en Blow to warmists, the proposed 'Anthropocene epoch has been denied by ICSThe global body tasked with naming geological eras, the International Commission on Stratigraphy, has rejected the proposed Anthropocene epoch, the controversial 'geological' epoch in which mankind allegedly dominates natural processes.
The international commission has now rejected the proposal and has instead split the Holocene Epoch into three different geological ages, all of which were primarily shaped by natural, not human factors.
Quelle / Source:
-
International Commission on Stratigraphy
2018-07 en ICS chart containing the Quaternary and Cambrian GSSPs and new stages (v 2018/07) is now released!
⇧
G3 Klima im Laufe der Geschichte der Menschheit
en
Climate throughout human history
fr
Le climat à travers l'histoire humaine
Mit folgenden Links wird von anderen Webseiten auf diese Seite verwiesen:
| de | en | fr |
|---|---|---|
|
Klima Geschichte Klima im Laufe der Geschichte der Menschheit |
Climate History Climate throughout human history |
Histoire du climat Le climat à travers l'histoire humaine |
- G3 a Das Subatlantikum
- G3 b Langfristiger Abkühlungstrend Nordeuropas über die letzten Jahrtausende
- G3 c Global Temperatures (2500 B.C, to 2008 A.D.)
- G3 d Global Temperatur Reconstruction Based on Non-Treering Proxies
- G3 e Klima in den letzten 5000 Jahren
- G3 f Klima in den letzten 3000 Jahren
- G3 g Klima in den letzten 2000 Jahren
- G3 h Temperaturen in Grönland
- G3 i Einfluss der Sonne auf das Klima der Römer
- G3 j
de
Sonnenstrahlung 1611-2001
en Solar Irradiation 1611-2001
fr Rayonnement solaire 1611-2001 - G3 k
de
Die Geschichtsfälschung von Michael Mann mit der Hockeystick-Kurve
en Falsification of the climate history with the hockeystick curve by Michael Mann
fr Falsification de l'histoire du climat avec la courbe de la crosse de hockey par Michael Mann
↑ G3 a Das Subatlantikum
-
Wikipedia de Subatlantikum
Das Subatlantikum ist der letzte und derzeit aktuelle Zeitabschnitt des Holozäns.
Es dauert seit rund 2500 Jahren an.
Seine Durchschnittstemperaturen liegen geringfügig tiefer als im vorausgehenden Subboreal und Atlantikum.
In seinem Verlauf ereigneten sich mehrere Temperaturschwankungen, deren unmittelbare, ökologische Auswirkungen auf Flora und Fauna indirekt auch die Entwicklungsgeschichte der menschlichen Zivilisation deutlich beeinflussten.
en Subatlantic
The Subatlantic is the current climatic age of the Holocene epoch. It started at about 2,500 years BP and is still ongoing.
Its average temperatures were slightly lower than during the preceding Subboreal and Atlantic.
During its course the temperature underwent several oscillations which had a strong influence on fauna and flora and thus indirectly on the evolution of human civilisations.
Sur l'échelle des temps géologiques, le Subatlantique est le dernier étage géologique de l'Holocène.
Succédant au Subboréal, il s'étend depuis environ -850 (tant que la proposition de création de l'Anthropocène n'est pas retenue)1,2.
Ses températures moyennes sont un peu plus basses qu'aux étages précédents (Subboréal et Atlantique).
Pendant sa durée les températures subissaient plusieurs oscillations qui directement influençaient la faune et la flore, mais plutôt indirectement aussi l'évolution de la société humaine.
↑ G3 b Langfristiger Abkühlungstrend Nordeuropas über die letzten Jahrtausende
Langfristiger Abkühlungstrend Nordeuropas über die letzten Jahrtausende erstmals präzise berechnet
![]()
![]() Langfristiger Abkühlungstrend Nordeuropas über die letzten
Jahrtausende
Langfristiger Abkühlungstrend Nordeuropas über die letzten
Jahrtausende
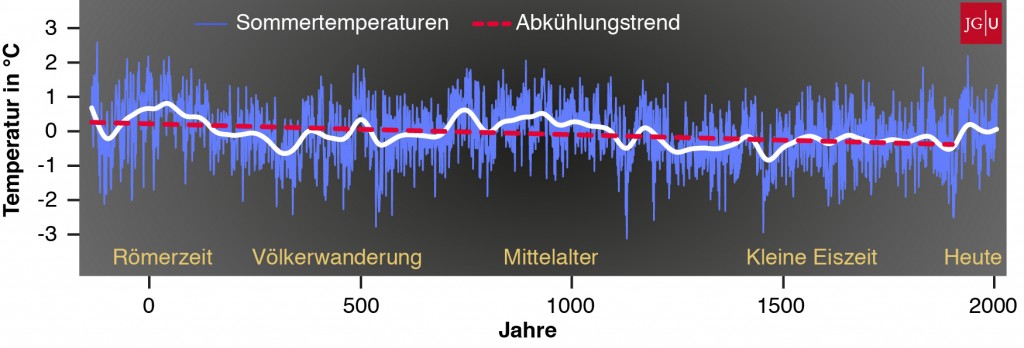
Eine 2.000-jährige Klimarekonstruktion für Nordeuropa
Langfristigen Abkühlungstrend über die letzten Jahrtausende präzise berechnet.
Temperaturen zur Römerzeit und im Mittelalter wurden bis dato als zu kühl eingeschätzt
"Diese Befunde sind auch insofern von klimapolitischer Bedeutung, da sie die Beurteilung des aktuellen Klimawandels im Vergleich zu den historischen Warmphasen beeinflussen."
Längerfristigen Abkühlungstrend Abkühlung von -0.3°C pro Jahrtausend
Die neue Klimakurve zeigt neben diesen Kalt- und Warmphasen aber noch ein Phänomen, mit dem in dieser Form nicht zu rechnen war.
Erstmalig konnten die Forscher anhand der Baumjahrringe einen viel längerfristigen Abkühlungstrend, der sich kontinuierlich über die letzten 2.000 Jahre abspielte, präzise berechnen.
Auf Grundlage der neuen Befunde macht dieser Trend, der durch langsame Veränderungen des Sonnenstandes aber auch der Distanz der Erde zur Sonne verursacht wurde, ein Abkühlung von -0.3°C pro Jahrtausend aus.
"Eigentlich erscheint diese Zahl nicht sonderlich imposant", so Professor Esper, "allerdings ist sie im Vergleich zur globalen Erwärmung, die bis heute auch weniger als 1°C beträgt, nicht zu vernachlässigen.
Wir konnten nun zeigen, dass die großräumigen Klimarekonstruktionen, die auch vom internationalen Klimarat 'IPCC' verwendet werden, den langfristigen Abkühlungstrend über die letzten Jahrtausende unterschätzen."
Temperaturrekonstruktion der letzten 2000 Jahre für Nordskandinavien.
![]()
![]() Temperaturrekonstruktion der letzten 2000 Jahre für Nordskandinavien
Temperaturrekonstruktion der letzten 2000 Jahre für Nordskandinavien

2000-jährigen Untersuchuchungszeitraum mit Abweichungen um 2 Grad.
Wenn man die Sommertemperaturen von 5-Jahres-Perioden betrachtet, findet man Unterschiede von bis zu 5 Grad.
Temperaturentwicklung von Zentral-Grönland für die letzten 4000 Jahre.
![]()
![]() Temperaturentwicklung von Zentral-Grönland für die letzten 4000 Jahre
Temperaturentwicklung von Zentral-Grönland für die letzten 4000 Jahre

Quelle / Source:
-
Die kalte Sonne (Fritz Vahrenholt & Sebastian Lüning)
2012-07-10 de Langfristiger Abkühlungstrend Nordeuropas über die letzten Jahrtausende erstmals präzise berechnet: Temperaturen zur Römerzeit und im Mittelalter wurden bis dato als zu kühl eingeschätzt
↑ G3 c Global Temperatures (2500 B.C, to 2008 A.D.)
Mit folgendem Link wird von anderen Webseiten auf diese Seite verwiesen.
Klima im Laufe der Geschichte der Menschheit:
▶ Global Temperatures (2500 B.C, to 2008 A.D.)
![]()
![]()

| de | en | fr |
|---|---|---|
|
Die Erde Vulkane |
The Earth Volcano |
La terre Volcan |
↑ G3 d Global Temperatur Reconstruction Based on Non-Treering Proxies
Craig Loehle | Ph.D., Principal Scientist with the National Council for Air and Stream Improvement (NCASI |
|---|
Mit folgendem Link wird von anderen Webseiten auf diese Seite verwiesen.
| Craig Loehle |
Ph.D., Principal Scientist with the National Council for Air and Stream
Improvement (NCASI) His research interests include ecological modeling, landscape ecology, life history theory, and natural resource management. He is the author of over 100 scientific publications. ▶Craig Loehle: Who is who (Skeptiker) |
|
|
de Das Ergebnis der Studie zeigt, dass es sich beim mittelalterlichen Wärmeoptimum und der kleinen Eiszeit um reale Ereignisse handelte und dass diese globale Auswirkungen hatten. en It clearly shows that natural climate variability happens, and these proxies coincide with known events in human history.
Roy Spencer Ph.D. |
de Temperaturrekonstruktion der letzten 2000 Jahre - ohne Baumring-Proxies
-
Craig Loehle hat sich die Kritiken an seiner Veröffentlichung zu Herzen genommen, die Kritikpunkte aufgegriffen und nun einen korrigierte Fassung, in Zusammenarbeit mit J. Huston McCulloch, veröffentlicht. Anbei die Rekonstruktion:
-
Das Ergebnis der Studie zeigt, dass es sich beim mittelalterlichen Wärmeoptimum und der kleinen Eiszeit um reale Ereignisse handelte und dass diese globale Auswirkungen hatten, was in anderen Studien bezweifelt wurde (z.B. Crowley und Lowery, 2000).
Das mittelalterliche Wärmeoptimum und die kleine Eiszeit wird ebenfalls in den Veröffentlichungen von Moberg et al. (2005) und Viau et al. (2006) nachgewiesen.
-
Diese Temperaturrekostruktionen widersprechen klar den Hockeystick-Rekonstruktionen vom "Team" (Crowley, 2000; Crowley and Lowery, 2000; Jones, 1998; Jones et al., 1999; Mann and Jones, 2003; Mann et al., 1995, 1998, 1999; Overpeck et al., 1997) und damit der daraus resultierenden Behauptung, die Temperaturänderung in den letzten 150 Jahren wäre beispiellos in den letzten 2000 Jahren.
en Temperatures published by Craig Loehle in 2007, and later revised in 2008
-
This graph shows the average of 18 non-tree ring proxies of temperature from 12 locations around the Northern Hemisphere, published by Craig Loehle in 2007, and later revised in 2008.
It clearly shows that natural climate variability happens, and these proxies coincide with known events in human history.
-
Loehle also published in 2008 a paper that described why tree rings can not be trusted as a proxy for past temperature variations.
Tree ring data have what is called a "divergence problem" in the late 20th Century where the tree ring data data suggests cooling, when in fact there has been warming.
This, by itself, should cast serious doubt on whether tree ring reconstructions (such as Michael Mann's famous "hockey stick" curve) can be used to estimate past global temperature variability.
-
Craig Loehle, J. Huston McCulloch
2008-01-10 en Correction to: A 2000-Year Global Temperature Reconstruction Based on
Non-Tree Ring Proxies
Correction to: A 2000-Year Global Temperature Reconstruction Based on
Non-Tree Ring Proxies
↑
G3 e Klima in den letzten 5000 Jahren
en Climat in the last 5000 years
fr Le climat dans les derniers 5000 ans
![]()
![]()

-
Watts UP With That?
2009-11-01 en In-betweeners: Enjoy the warmth while it lasts
↑
G3 f Klima in den letzten 3000 Jahren
en Climat in the last 3000 years
fr Le climat dans les derniers 3000 ans
- Klima-Entwicklung in den letzten 3200 Jahren
- Sea Surface Temperature
- Der Einfluss des Klimas auf die Geschichte
- Blick in das Klimabuch der Erde
↑ Klima-Entwicklung in den letzten 3200 Jahren
| Warmzeiten | Kaltzeiten | |
| Minoische Warmzeit | Völkerwanderung (Kelten) | |
| Römisches Klima-Optimum | Völkerwanderung (Goten) | |
| Mittelalterliches Klima-Optimum | Die Kleine Eiszeit (Hungersnöte in Europa ) | |
| Jetzige Warmzeit |
![]()
![]()
![]()
![]()
![]() Klima-Entwicklung in den letzten 3200 Jahren
Klima-Entwicklung in den letzten 3200 Jahren

↑ Sea Surface Temperature
Mit folgendem Link wird von anderen Webseiten auf diese Seite verwiesen.
▶Verlauf: Sea Surfache Temperaturen
![]()
![]() Oberflächentemperatur
Oberflächentemperatur
der Sargasso See
-
biokurs.de de
Oberflächentemperatur
der Sargasso See
![]()
![]() Fig.1: Surface temperatures
Fig.1: Surface temperatures
in the Sargasso Sea
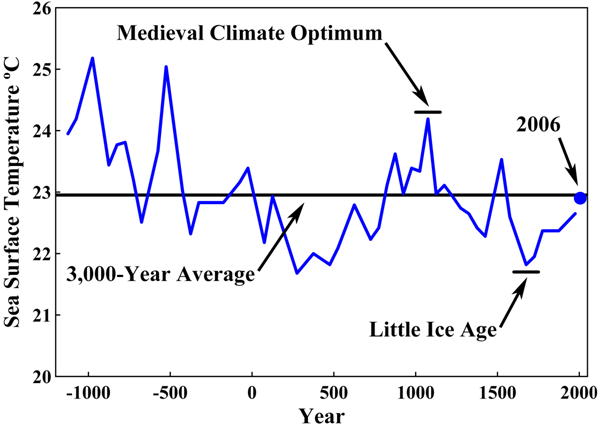
- Petition Project en Sea Surface Temperature
![]()
![]()
The last thousand years Climate changes in Europe
![]()
![]() Canada's Columbia Icefield
Canada's Columbia Icefield
↑ Der Einfluss des Klimas auf die Geschichte
- Der Einfluss des Klimas auf die Geschichte wurde bislang unterschätzt. Durch klimahistorische Fakten und Forschungsergebnisse müssten historische Ereignisse neu interpretiert werden. Aufstieg und Niedergang ganzer Kulturen sind vom Klima beeinflusst; die Hexenverfolgung ist ebenso durch das Klima mitverursacht wie der Beginn der industriellen Revolution.
-
uni-protokolle.de/Prof. Dr. Wolfgang Behringer:
de Das Klima schreibt Geschichte - Neue Thesen zur Kulturgeschichte des Klimas
-
James S. Aber en
Detailed Chronology of Late Holocene Climatic Change
en Medieval climatic optimum 760-1129
en Medieval glaciation late 1100s-1530-75
en Little Ice Age 1570
en Wine harvests of western Europe (de Die Weinlese)
↑ Blick in das Klimabuch der Erde
-
Die Klimageschunseres Planeten ist eine Geschichte der natürlichen Klimaschwankungen. Vorherrschend war das Warmklima, sozusagen der "Normalzustand" der Erde. Wenig bewusst ist uns die Tatsache, dass wir heute in einem Eiszeitalter leben.
-
Die Erde existiert seit etwa 4,6 Mrd. Jahren. Die Klimageschichte unseres Planeten ist eine Geschichte der natürlichen Klimaschwankungen. Und in der langen Klimageschichte war das Warmklima das vorherrschende Klima, sozusagen der "Normalzustand" der Erde. Dieser Normalzustand (20-25°C)zeichnete sich mit bis zu 10 Grad höheren Erdmitteltemperaturen aus. Heute liegt dieser Wert bei 15°C. Es ist also - gemessen an dem Normalzustand der Erde - gegenwärtig ziemlich kalt auf diesem Planeten.
-
Wenn wir das Alter der Erde gleich einem Jahr setzen, so kennen wir die irdische Klimageschichte von Anfang März bis zum 31. Dezember. Der Mensch als homo erectus erscheint auf dieser Skala am 31. Dezember gegen 23.00 Uhr. Seit etwa 200 Jahren, also 23.59 Uhr, übt er Einfluss auf das Globalklima aus. Wir sollten also nicht nur die letzten Millisekunden Klimageschichte betrachten, sondern wenigstens ein paar Tage, wenn nicht Wochen zurückgehen. Wer die Vergangenheit nicht kennt, wird kaum Gegenwart oder Zukunft verstehen können.
-
ESA Europäische Weltraumorganisation
de Blick in das Klimabuch der Erde
Etwa 300 vor Christus
-
Vor 2.300 Jahren steigen die Temperaturen wieder an und
es wird ein bis eineinhalb Grad wärmer als heute.
Das große Römische Imperium scheint von diesem Klimaoptimum begünstigt zu sein.
200-600 nach Christus bis etwa 1000 nach Christus
-
Dann, 200 - 600 nach Christus, schlägt das Klimapendel
wieder zur anderen Seite aus.
Ein kühles, stark wechselhaftes Klima in Nord- und Nordwest-Europa verursacht Ernteausfälle und führt zur Völkerwanderung.
Um 1.000 nach Christus endet die kalte Periode.
Um 1000 nach Christus beginnt die Mittelalterliche Warmzeit, die bis etwa zum Jahr 1350 dauert.
-
Überdurchschnittliche Temperaturen führen zu kulturellem
Fortschritt - diese Erkenntnis gilt auch für das Mittelalter:
Die Anbaugrenzen in den deutschen Mittelgebirgen sind
200 Meter höher als heute. Die Kulturlandschaft erfährt
ihre bisher größte Ausdehnung, der Anteil des Waldes geht
in 300 Jahren von drei Viertel auf ein Fünftel der Fläche
zurück.
Zahlreiche Siedlungen werden neu gegründet, was sich heutzutage in vielen Stadtjubiläen widerspiegelt.
Große Städte mit Handel und Gewerbe, mit Dienstleistung und Ständewesen können sich entwickeln, weil sie vom Umland sicher versorgt werden.
Unter dem günstigen Klima gedeiht eine ergiebige Landwirtschaft, die mehr erwirtschaftet, als zum Leben direkt notwendig ist.
Auf dieser Grundlage entsteht neuer Wohlstand, auch wenn nicht alle in gleichem Maße von diesem profitieren. Die aufwändige Architektur der Gotik ist für diese mittelalterliche Entwicklung ein deutliches Sinnbild.
Die kleine Eiszeit von 1350 bis ca. 1850.
-
In acht Tagen fällt damals ungefähr die Hälfte des sonst
üblichen Jahresmenge an Niederschlag, alle Brücken
zerreißen, alle Mühlen werden zerstört, die mit Weinreben
bestellten Hänge kommen ins Rutschen, fruchtbarer
Ackerboden wird weggespült.
Das Katastrophenwetter terrorisiert in diesem Jahr die Menschen allerorts. Überschwemmungen, wie wir sie beim Oderhochwasser 1997 erlebt haben, suchen ganz Mitteleuropa heim. Die Jahrtausendflut schwemmt so viel fruchtbaren Boden fort, wie bei normalen Wetterbedingungen in einem Zeitraum von 2000 Jahren verloren geht.
Das ist der Beginn einer neuen Epoche, um 1350 herum beginnt sich das Klimasystem offenbar umzustellen, es kippt regelrecht, es kommt zu starken Hochwässern, die Menschen sind geschwächt, weil auch die Ernten relativ schlecht sind, durch zu feuchte Witterungsverhältnisse kann das Getreide nicht optimal ausreifen, es verfaulen die Getreidevorräte in den Zehentscheuern.
Hungersnöte und Pest raffen in den kommenden Jahren fast die Hälfte der Bevölkerung dahin.
Mitteleuropa erlebt einen zivilisatorischen Rückfall mit Aberglauben, Hexenverfolgung und Judenpogromen. Viele Menschen wandern in die Neue Welt aus.
Im Dreißigjährigen Krieg, bei dem 1618 bis 1648 ganze Landstriche entvölkert wurden - Schätzungen zufolge verlor die Hälfte der deutschen Bevölkerung ihr Leben - sei die Hälfte der Opfer auf Mangelernährung und Seuchen zurückzuführen. "Es handelt sich um einen besonders kalten Abschnitt der Kleinen Eiszeit. Es gab Jahre praktisch ohne Sommer". "Die Sonne zeigte sich nicht, der Dauerregen ließ die Ernte verfaulen. Es folgten extrem kalte und lange Winter." Die Wetterbedingungen führten zu Missernten, diese zu Hungersnöten, in deren Folge sich Seuchen wie Pest, Typhus oder Ruhr leicht ausbreiten konnten.
Mit dem Jahr 1.850 kommt diese krisengeschüttelte Epoche, auch unter dem Namen "Kleine Eiszeit" bekannt, zu ihrem Ende.
Ab 1850 bis heute
-
Es wird seitdem wieder wärmer, die Tendenz hält bis heute an.
Neue Prognosen zeigen aber, dass im Jahr 2000 bereits wieder ein Umschwung stattefunden hat.
-
Wolf Dieter Blümel de
20 000 Jahre Klimawandel und Kulturgeschichte - von der
Eiszeit in die Gegenwart
- mynetcologne.de de Wer waren die Hunnen überhaupt? Eine Geschichte mit vielen Unklarheiten!
↑
G3 g Klima in den letzten 2000 Jahren
en Climat in the last 2000 years
fr Le climat dans les derniers 2000 ans
![]()
![]()

-
EIKE Europäisches Institut für Klima und Energie
2019-12-29 de 13. IKEK in München: Sebastian Lüning - Wie viel Klima macht der Mensch?
↑ G3 h Grönland / Greenland / Grœnland
- Grönland Temperaturen / Greenland Temperatures
- Summit (Greenland) reconsstructed surface temperatures since 8000 BP
↑ Grönland Temperaturen / Greenland Temperatures
![]()
![]() Temperature variations from the Greenland Glacier Ice Core
Temperature variations from the Greenland Glacier Ice Core
![]() Image from Internet Archive's Wayback Machine
Image from Internet Archive's Wayback Machine

-
Watts Up With That? (Antony Watts)
2009-03-01 en Limitations on Anthropogenic Global Warming
![]()
![]() Central Greenland surface temperature for the last millennium
Central Greenland surface temperature for the last millennium

-
CO2 Science
2010-09-01 en Greenland Temperatures of the Past Millennium Based on Nitrogen and Argon Isotopic Ratios
↑ Summit (Greenland) reconsstructed surface temperatures since 8000 BP
Generalised temperature diagram based on temperature measurements in the Greenland Ice Sheet (Dahl-Jensen et al. 1998), annotated with a number of historical events around the North Atlantic.
![]()

↑
G3 i Einfluss der Sonne auf das Klima der Römer
en Solar inpact on the climat at the roman period
fr Impacte du soleit sur le climat du temps der romains
-
de
Solare Millenniumszyklen kontrollierten Feucht- und Dürrephasen der
Römerzeit im Mittelmeer
en A seesaw in Mediterranean precipitation during the Roman Period linked to millennial-scale changes in the North Atlantic -
de
Das römische Klimaoptimum in Nordamerika
en Roman Warm Period (North America)
←
Solare Millenniumszyklen kontrollierten Feucht- und Dürrephasen der
Römerzeit im Mittelmeer
en A seesaw in Mediterranean precipitation
during the Roman Period linked to millennial-scale changes in the North Atlantic
de
-
Die kalte Sonne (Fritz Vahrenholt & Sebastian Lüning)
2012-05-23 de Solare Millenniumszyklen kontrollierten Feucht- und Dürrephasen der Römerzeit im MittelmeerDas Römische Imperium beherrschte das zentrale Mittelmeergebiet fast tausend Jahre lang (500 v. Chr bis 500 n. Chr.) und erlebte starke langfristige Klimazyklen mit warmen und kalten Phasen.
Auch die Regenmengen schwankten signifikant, wobei sich die ausgeklügelte landwirtschaftliche Produktion der Römer an Feucht- und Dürrephasen anpassen musste.
Eine niederländische Forschergruppe um Brian Dermody von der Universität Utrecht hat sich die Klimageschichte des Mittelmeerraums jetzt anhand der veröffentlichten Daten im Zusammenhang näher angeschaut und versuchte mit statistischen Methoden aus den zum Teil widersprüchlichen Zahlen ein Gesamtbild für die Zeit 1000 v. Chr. bis 1000 n. Chr. zu erstellen. Zusätzlich führten sie auch Modellierungen durch. Die Studie erschien vor kurzem in der Fachzeitschrift Climate of the Past.
Eine besonders feuchte Phase konnte für die Zeit um das Jahr Null in Israel und Spanien sowie in anderen Teilen Europas wie etwa Norwegen registriert werden.
In anderen Teilen der Region, wie zum Beispiel in der Türkei und im zentralen Mittelmeergebiet mit Griechenland und Tunesien herrschten zur gleichen Zeit jedoch außergewöhnlich trockene Bedingungen.
Die Forscher puzzelten die komplexen Verhältnisse zusammen und konnten herausarbeiten, dass in der Region eine Art "Feuchtigkeitsschaukel" ausgebildet war, wobei sich Feucht- und Dürrebedingungen im 1000er-Jahrestakt in den jeweiligen Gebieten austauschten.
Wo vorher Dürre herrschte, zog Feuchtigkeit ein und umgekehrt.
Dies belegt noch einmal eindrucksvoll, dass es bereits in vorindustrieller Zeit einen signifikanten, natürlichen Klimawandel gegeben hat.
Es stellt sich die Frage, was nun diese klimatischen Veränderungen wohl ausgelöst haben könnte, wenn es das CO2 offensichtlich nicht gewesen sein kann.
Dazu schaute sich das niederländische Forscherteam an, wodurch das Klima im Mittelmeer heute beeinflusst wird.
Dabei stießen sie auf eine ähnlich geartete "Feuchtigkeitsschaukel" wobei sich die Regenmengen im südöstlichen Teil des Mittelmeeres gegensätzlich zu den im übrigen mediterranen Gebiet verhalten.
Die jeweiligen Wechsel werden dabei von der Nordatlantischen Oszillation (NAO) gesteuert, die den Druckunterschied zwischen dem Azorenhoch und dem Islandtief darstellt.
Es sind also Veränderungen im Atlantik, die das heutige Klima im Mittelmeer zum schwanken anregt.
en
-
Climate of the Past
B. J. Dermody, H. J. de Boer, M. F. P. Bierkens, S. L. Weber, M. J. Wassen, and S. C. Dekker
2012-03-29 en A seesaw in Mediterranean precipitation during the Roman Period linked to millennial-scale changes in the North AtlanticAbstract.
We present a reconstruction of the change in climatic humidity around the Mediterranean between 3000-1000 yr BP.Using a range of proxy archives and model simulations we demonstrate that climate during this period was typified by a millennial-scale seesaw in climatic humidity between Spain and Israel on one side and the Central Mediterranean and Turkey on the other, similar to precipitation anomalies associated with the East Atlantic/West Russia pattern in current climate.
We find that changes in the position and intensity of the jet stream indicated by our analysis correlate with millennial changes in North Atlantic sea surface temperature.
A model simulation indicates the proxies of climatic humidity used in our analysis were unlikely to be influenced by climatic aridification caused by deforestation during the Roman Period.
That finding is supported by an analysis of the distribution of archaeological sites in the Eastern Mediterranean which exhibits no evidence that human habitation distribution changed since ancient times as a result of climatic aridification.
Therefore we conclude that changes in climatic humidity over the Mediterranean during the Roman Period were primarily caused by a modification of the jet stream linked to sea surface temperature change in the North Atlantic.
Based on our findings, we propose that ocean-atmosphere coupling may have contributed to regulating Atlantic Meridional Overturning Circulation intensity during the period of analysis.
←
Das römische Klimaoptimum in Nordamerika
en
Roman Warm Period (North America)
-
Klimaskeptiker Info
2010-06-09 de Das römische Klimaoptimum in Nordamerika
-
CO2 Science
2010-06-09 de Roman Warm Period (North America) -- Summary
↑
G3 j Sonnenstrahlung 1611-2001
en Solar Irradiation 1611-2001
fr Rayonnement solaire 1611-2001
← Sonnenstrahlung 1611-2001
de Die Zeit von 1645-1715 ist die "Kleine Eiszeit" im Maunder Minimum.
en The low flatline from 1645-1715 is the Maunder Minimum, a period of virtually no sunspots, where the historical reports from the northern hemisphere tell a story of dramatic climate change: harsh winters, cools summers, crop failures, famine and disease.
![]()
![]() Solar Irradiance 1611-2001
Solar Irradiance 1611-2001
-
Sott.net
2009-06-28 en The Critical Importance of Solar Cycles
-
Watts UP With That? (Antony Watts)
2007-04-06 en It's the Sun, stupid
2008-03-22 en The Solar to Global Warming Connection - A short essay
2008-06-07 en Some Planetary Perspective
← Sonnenfleckenzyklus 1610-2000
- über die Jahrhunderte wurden die Sonnenflecken intensiv beobachtet und gezählt. Dabei lässt sich ein in etwa 11 Jahre dauernder Zyklus der Zu- und Abnahme der Zahl der Sonnenflecken nachweisen.
- Während der Zeit der Sonnenfleckenbeobachtung kam es zwischen etwa 1645 und 1715 zu einer Periode, in der fast keine Sonnenflecken auftraten. Diese Zeit fällt zusammen mit der "kleinen Eiszeit2, in der die Temperaturen erheblich unter den davor und danch üblichen Temperaturen lagen. Es konnten im Winter regelmässig Märkte auf zugefrorenen Flüssen (etwa in London auf der Themse) veranstaltet werden, die ausserhalb der kleinen Eiszeit nicht zugefroren waren bzw. zufrieren.
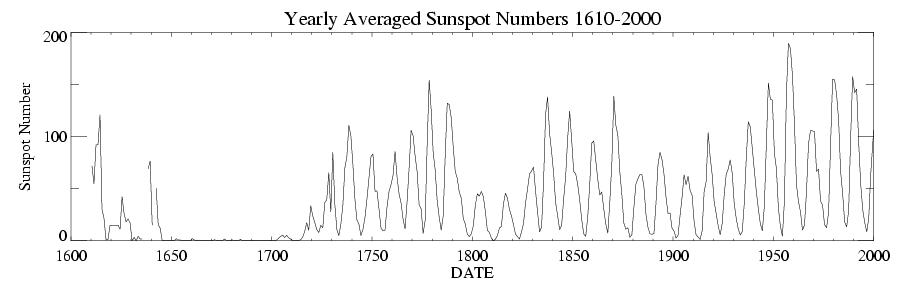
- klimaskeptiker.info de Die Sonne
↑
G3 k Die Geschichtsfälschung von Michael Mann mit der Hockeystick-Kurve
en Falsification of the climate history with the hockeystick curve by Michael Mann
fr Falsification de l'histoire du climat avec la courbe de la crosse de hockey par Michael Mann
![]()
![]()

-
Telegraph.co.uk
2006-11-05 en Climate chaos? Don't believe it
| de | en | fr |
|---|---|---|
|
Fehler, Teil I Falsche Temperaturen von IPCC und Kyoto Das Hockeyschläger Diagramm Fälschung von Michael Mann Das IPCC lässt das Mittelalterliche Klimaoptimum verschwinden |
Errors, Part I Wrong temperatures of IPCC and Kyoto The Hockey Stick Curve Falsification by Michael Mann IPCC changed viewpoint on the MWP in 2001 |
Erreurs, partie I Fausses températures du GIEC et de Kyoto La courbe en crosse de hockey Falsification par Michael Mann Le GIEC fait disparaître l'optimum médiéval climatique |
⇧
G4 Die Minoische Warmzeit
en
The Minoan Warm Period
fr
La période chaude minoenne
Mit folgenden Links wird von anderen Webseiten auf diese Seite verwiesen:
| de | en | fr |
|---|---|---|
|
Klima Geschichte Die Minoische Warmzeit |
Climate History The Minoan Warm Period |
Histoire du climat La période chaude minoenne |
-
Wikipedia
Nach dem mythischen König Minos wird die bronzezeitliche Kultur Kretas als minoisch, kretisch-minoisch oder kretominoisch bezeichnet.
Die etwa gleichzeitige Kultur des griechischen Festlandes wird als Helladische Kultur bezeichnet.
Die minoische Kultur ist die früheste Hochkultur Europas.
Ihre älteste Phase, Frühminoisch I verläuft parallel zur ersten bis vierten Dynastie Ägyptens.
The Minoan civilization was an Aegean Bronze Age civilization on the island of Crete and other Aegean Islands which flourished from c. 2700 to c. 1450 BCE.
La civilisation minoenne s'est développée sur les îles de Crète et de Santorin au sud de la Grèce de 2700 à 1200 av. J.-C..
⇧
G5 Völkerwanderungszeit (Kelten)
en
Migration Period (Celts)
fr
Période de migration (Celtes)
Mit folgenden Links wird von anderen Webseiten auf diese Seite verwiesen:
| de | en | fr |
|---|---|---|
|
Klima Geschichte Völkerwanderungszeit (Kelten) |
Climate History Migration Period (Celts) |
Histoire du climat Période de migration (Celtes) |
-
Wikipedia
de Kelten
Als Kelten (lateinisch Celtae oder Galli, griechisch ???t?? Keltoi oder Ga??ta? Galatai) bezeichnete man seit der Antike Volksgruppen der Eisenzeit in Europa.
Der Name ist wahrscheinlich von den indogermanischen Wurzeln *kel-1 "ragen, hoch" und *g[h]al- "können" abgeleitet und bedeutet sinngemäß "die Mächtigen, Erhabenen, Starken".
en Celts
The Celts (/'k?lts/, occasionally /'s?lts/, see pronunciation of Celtic) were people in Iron Age and Medieval Europe who spoke Celtic languages and had cultural similarities,
fr Celtes
Les Celtes constituent une civilisation protohistoriquenote 1 qui se définit par l'usage de langues celtiques et par certains particularismes culturels. Ils ont jadis été présents sur une grande partie du continent européen et en Asie mineure.
L'apogée de l'expansion celte se situe entre le viiie siècle av. J.-C. et le iiie siècle, marqué notamment par la civilisation laténienne au ve siècle av. J.-C.1.
Une succession de conquêtes et de migrations les mènent jusqu'en Galatie, en Asie mineure. Ainsi, leur domination s'étendait dans l'Europe actuelle de Galice jusqu'à Gala?i
⇧
G6 Das Römische Klimaoptimum / Die letzten 2000 Jahre
en
The Roman climate optimum / The last 2000 years
fr
L'optimum climatique romain / Les derièeres 2000 années
| de | en | fr |
|---|---|---|
|
Klima Geschichte Das Römische Klimaptimum |
Climate History The Roman climate optimum |
Histoire du climat L'optimum climatique romain |
- de Verzeichnis en Contents fr Sommaire
de Allgemein en General fr Générale
-
Wikipedia
de Optimum der RömerzeitAls Optimum der Römerzeit (oder Klimaoptimum der Römerzeit) wird in der Klimageschichte die Zeit von der Regierungszeit des Kaisers Augustus bis etwa 400 n. Chr. bezeichnet.
In diese Zeit fällt die Blüte und die größte Ausdehnung des Römischen Reichs.
The Roman Warm Period or the Roman climatic optimum has been proposed as a period of unusually warm weather in Europe and the North Atlantic that ran from approximately 250 BC to 400 AD.
L'optimum climatique romain, est une courte période de climat inhabituellement chaud en Europe et dans l'Atlantique nord, qui court d'environ 250 av. J.-C. à 400 apr. J.-C.
![]()
![]() Temperaturentwicklung der letzten 2000 Jahre auf der außertropischen
Nordhemisphäre
Temperaturentwicklung der letzten 2000 Jahre auf der außertropischen
Nordhemisphäre
RWP = Roman Warm Period
DACP = Dark Ages Cold Period
MWP = Medieval Warm Period
LIA = Little Ice Age
CWP = Modern Warm Period
![]()
![]() Wassertemperaturen der vergangenen 2000 Jahre
Wassertemperaturen der vergangenen 2000 Jahre
⇧ de Verzeichnis en Contents fr Sommaire
- 2020
- en Roman Warm Period Was 2 °C Warmer Than Today, New Study Shows
- 2016
- de Klimawandel im Lauf der Zeit
de Text en Text fr Texte
⇧ 2020
↑ en Roman Warm Period Was 2 °C Warmer Than Today, New Study Shows
-
The Global Warming Policy Forum (GWPF) / xxx
2020-07-24 en Roman Warm Period Was 2 °C Warmer Than Today, New Study ShowsRoman Empire coincided with warmest period of the last 2,000 years in the Med
The Mediterranean Sea was 3.6 °F (2 °C) hotter during the Roman Empire than other average temperatures at the time, a new study claims.
⇧ 2016
↑ Klimawandel im Lauf der Zeit
-
Wiener Zeitung
2016-07-16 de Klimawandel im Lauf der ZeitDie Bewohner Englands hatten es gut:
Um an begehrte mediterrane Produkte wie Oliven oder Wein zu gelangen, brauchten sie nur in der unmittelbaren Nachbarschaft einzukaufen, denn im nördlichen Europa wuchs vor 2000 Jahren so manches, was man viel weiter im Süden vermuten würde.Römisches Klimaoptimum
Der römische Historiker Tacitus etwa weiß von rund 500 Weinbergen zu berichten, auf denen man zu seiner Zeit in England geerntet haben soll.
Möglich machten dies klimatische Faktoren, die heutige Forscher unter dem Begriff "Klimaoptimum" zusammenfassen:
Eine vergleichs- weise hohe Durchschnittstemperatur und ein idealer Mix aus Niederschlag und Sonnenschein führte zu reichen Ernten im gesamten römischen Machtbereich.
In der eigentlichen Kornkammer des Reiches, im Niltal, führten damals - Klimaforscher sprechen von der Periode zwischen 30 vor und 155 nach Christi - regelmäßig die für die Bewässerung der Felder notwendigen Überschwemmungen zu reichen Ernten, die den Römern das Brot zu den Spielen sicherten.
Vielleicht war es kein Zufall, dass die größte Ausdehnung des Römischen Reiches ausgerechnet in diesen Zeitraum fiel: von 98 bis 117 n. Chr. regierte Kaiser Trajan, der römischen Gelehrten später als der beste aller Herrscher, als optimus galt - gewissermaßen ein optimaler Kaiser im Klimaoptimum.
Wie warm genau es in römischer Zeit war, ist nicht entschieden.
Bohrungen in die Vergangenheit (in Baumringe oder Bodensedimente) geben keine Gewissheit.
Und die Gletscherausdehnung bleibt ein unsicherer Indikator, weil hierbei der Regen mitspielt.
Frühmittelalterliches Klimapessimum
Sicher ist jedenfalls, dass es ab dem 3. Jahrhundert deutlich ungemütlicher wurde: das 500 Jahre währende "Klimapessimum" des Frühmittelalters sorgte für dramatische Veränderungen der politischen Verhältnisse:
Zum einen blieben die guten Ernten in Nordafrika und in der römischen Heimat selbst aus, der Wohlstand war Vergangenheit.
Zum anderen verschlechterte die Klimaabkühlung das Leben weiter im Norden und Osten Europas drastisch.
Sie war einer der Gründe für die große Völkerwanderung, die nun einsetzte.
Goten, Franken und Vandalen drangen auf römisches Reichsgebiet vor, ihrerseits getrieben von den Hunnen, die wiederum vor Asiens rauerem Klima flohen.
Mittelalterliches Optimum
Erst unter Karl dem Großen wurde das Klima milder: Das "Mittelalterliche Optimum" sorgte in Mitteleuropa für einen wirtschaftlichen Aufschwung, der sich in der Gründung neuer Städte niederschlug.
Doch schon litt mancher unter den hohen Temperaturen; so wird für das Jahr 1022 berichtet, "dass viel Leut' umb Nürnberg auff den Strassen vor großer Hitz verschmachtet und ersticket, auch sein viel Brunen vor großer Hitz versieget".
⇧
G7 Pessimum der Völkerwanderungszeit (Goten)
en
Pessimum of the Migration Period (Goths)
fr
Pessimum de la période de migration (Goths)
Mit folgenden Links wird von anderen Webseiten auf diese Seite verwiesen:
| de | en | fr |
|---|---|---|
|
Klima Geschichte Pessimum der Völkerwanderungszeit (Goten) |
Climate History Pessimum of the Migration Period (Goths) |
Histoire du climat Pessimum de la période de migration (Goths) |
-
Wikipedia
de Pessimum der Völkerwanderungszeit
Als Pessimum der Völkerwanderungszeit oder frühmittelalterliches Pessimum bezeichnet man eine kleinere Abkühlung des nacheiszeitlichen Klimas in Europa.
Sie folgte auf das Optimum der Römerzeit.
Danach folgt die Mittelalterliche Warmzeit.
⇧
G8 Das Mittelalter
en
Middle Ages
fr
Moyen Âge
Mit folgenden Links wird von anderen Webseiten auf diese Seite verwiesen:
| de | en | fr |
|---|---|---|
|
Klima Geschichte Die Mittelalterliche Warmzeit und die Kleine Eiszeit |
Climate History Medieval Warm Period and the Little Ice Age |
Histoire du climat L'optimum climatique médiéval et le petit âge glaciaire |
- G8 A de
Die Mittelalterliche Warmzeit und die Kleine Eiszeit
en Medieval Warm Period and the Little Ice Age
fr L'optimum climatique médiéval et le petit âge glaciaire
- G8 B de
Die Mittelalterliche Warmzeit (ca. 900 - 1350)
en The Medieval Warm Period
fr L'optimum climatique médiéval
↑
A Die Mittelalterliche Warmzeit und die Kleine Eiszeit
en Medieval Warm Period and the Little Ice Age
fr L'optimum climatique médiéval et le petit âge glaciaire
- a Temperatur
- b Klimageschichte
- c Einfluss der Sonne auf die Mittelalterliche Wärmeperiode und Kleine Eiszeit
- d IPCC liess das Mittelalterliche Klimaoptimum und die Kleine Eiszeit verschwinden
↑
a Temperatur
en Termperarure
fr Température
![]()
![]()
-
In der mittelalterlichen Warmperiode waren die Temperaturen im Mittel 2 - 4°C höher als heute,
Island und Grönland wurden im 9. Jahrhundert durch die Wikinger besiedelt;
das Packeis zog sich weiter nördlich zurück;
in England und Grönland wurde Wein angebaut;
in Island wuchsen Eichen und man baute Weizen und Gerste an;
die Nordwestpassage und Nordostpassage war schiffbar.
![]()
![]()
The last thousand years Climate changes in Europe
![]()
![]() Canada's Columbia Icefield
Canada's Columbia Icefield
![]()
![]()

-
Climate Change Science en
The last thousand years in Europe
-
Klimanews
2008-09-30 de Mittelalterliche Warmzeit und Kleine Eiszeit in der Antarktis, im Widerspruch zum Michael Mann Hockeystick
-
Paul Homewood
2011-11-01 en What Was Life Like In The Little Ice Age? - Part I
Northern Hemisphere Temperatures
![]()
![]()
![]()
![]()
-
NoTricksZone / Pierre L. Gosselin
2017-04-20 en NEW RESEARCH: MEDIEVAL WARM PERIOD WAS AS WARM AS TODAYNew research papers suggest Northern hemisphere temperatures during the Medieval Warm Period were as warm as recent decades.
↑
b Klimageschichte
en Climate History
fr Histoire du climat
2017-02-06 de
![]() Kathedralen - Superbauten im Mittelalter
Kathedralen - Superbauten im Mittelalter
Die Dokumentation erzählt die Geschichte des Kathedralenbaus und zeigt die dramatischen Momente im 1000-jährigen Leben des Doms.
-
Wikiwand
de Mittelalterliche WarmzeitIn der Zeitspanne, in der die mittelalterliche Warmperiode verortet wurde, kam es in Europa zu einer regelrechten Bevölkerungsexplosion.
Dieses ist sicherlich auch auf die günstige Klimaentwicklung zurückzuführen, aber keineswegs ausschließlich.
Zwar kam es infolge des wärmeren Klimas in Europa zu einer Expansion der Agrarwirtschaft, der Getreideanbau war nun sowohl in wesentlich nördlicheren als auch in höher gelegenen Gebieten möglich.
So wurde Getreidewirtschaft bis nach Norwegen und in den Bergen Schottlands nachgewiesen, die in der nachfolgenden Kleinen Eiszeit und der damit verbundenen Abkühlung des Klimas wieder eingestellt wurde.
So wird angenommen, dass sich die Bevölkerung in Europa zwischen 1100 und 1400 fast verdreifacht hat.
| de |
▶ Internet-Terror: Manipulation von Wikipedia durch einen Administrator ▶ Das Lexikon der Lügen ▶ Vom Onlinelexikon zur Propagandamaschine: Zensur, Einschüchterung und arglistige Täuschung ▶ Wikipedia: Klima-Fälscher Connolley: Der Mann, der unser Weltbild umschrieb ▶Die dunkle Seite von WIKIPEDIA: EIKE Zensur - kurz und knapp [Who is who (Skeptische Institute): EIKE; Wikipedia: Websites, Opfer: EIKE, Manipulatoren: Andol] |
|||||
|---|---|---|---|---|---|---|
| en |
▶ At Wikipedia, one man engineers the debate on global warmingator |
|||||
| fr |
▶ A Wikipedia, un homme dirige le débat sur le réchauffement climatique et à sa manière |
-
James S. Aber
en Detailed Chronology of Late Holocene Climatic Change
-
Medieval Warming Period
A look back to the Medieval Warming Period offers an insight into how things changed in the following centuries.
Most people are aware that the Vikings colonised and farmed parts of Greenland in ways that are still to this day not possible.
In Europe summer temperatures were between 0.7C and 1.0C warmer than 20th Century averages.
Central European summers were even warmer, as much as 1.4C warmer than now.
During the height of the Warm Period, so many lords quaffed prime English wines that the French tried to negotiate trade agreements to exclude them from the Continent.
Populations rose sharply during medieval times.
Numerous examples are quoted which show how crops were grown at altitudes where crops cannot be supported today such as Dartmoor and the Pennine Moors.
In Scandinavia farming spread 100 to 200 meters farther up valleys and hillsides in central Norway, from levels that had been static for more than 1000 years.
To the south in the Alps, tree levels rose sharply and farmers planted deeper and deeper into the mountains. During late prehistoric times, numerous copper mines had flourished in the Alps until advancing ice sealed them off; late medieval miners reopened some of these when the ice retreated.
For five centuries, Europe basked in warm, settled weather, with only the occasional bitter winters, cool summers and memorable storms.
Summer after summer passed with long, dreamy days, golden sunlight and bountiful harvests.
Compared with what was to follow, these centuries were a climatic golden age.
Greenland
Eirik the Red is credited with discovering Greenland in the 10th Century and Viking colonists followed him to set up farming settlements as far north as Godthab.
They found the green summer pastures were better than either back home in Norway or Iceland.
However in the 13th Century Greenland and Iceland experienced increasing cold.
Sea ice spread south creating difficulties for Norse ships sailing from Iceland as early as 1203.
By 1250 many fewer ships made the crossing to Greenland and those that did had to take a more hazardous route further south in the open Atlantic to avoid pack ice off southeastern Greenland.
Extent of the Little Ice Age
There is been plenty of historical evidence which confirms the existence of a much colder climate in much of Europe between the 14th and 19th Centuries.
This is not surprising because there is such a wealth of historical records and documents which has been handed down from the Europe of those days.
Glaciers
We tend to regard alpine landscapes today such as those in Switzerland as being picturesque and think that the people there live in an beautiful idyll.
It was not always so.
In the 16th Century the occasional traveller would remark on the poverty and suffering of those who lived on the marginal lands in the glacier's shadow.
-
Watts Up With That? (Antony Watts)
2011-11-11 en "Without energy, life is brutal and short"Storms and Floods
It was not only the cold that was a problem during the Little Ice Age.
Throughout Europe, the years 1560-1600 were cooler and stormier, with late wine harvests and considerably stronger winds than those of the 20th Century.
Storm activity increased by 85% in the second half of the 16th Century and the incidence of severe storms rose by 400%.
Perhaps the most infamous of these storms was the All Saints Flood in November 1570, which worked its way northeast up the North Sea.
The storm brought enormous sea surges ashore in the Low Countries, flooding most of Rotterdam, Amsterdam, Dordrecht and other cities and drowning at least 100,000 people.
In the River Ems further north in Germany, sea levels rose an incredible four and a half meters above normal.
In 1607 another storm caused even greater floods in the Bristol Channel with flood waters rising 8 meters above sea level miles inland.
Later in the 17th Century, great storms blew millions of tonnes of formerly stable dunes across the Brecklands of Norfolk and Suffolk, burying valuable farm land under meters of sand.
This area has never recovered and is heathland.
A similar event occurred in Scotland in 1694.
The 1400 hectare Culbin Estate had been a prosperous farm complex next to the Moray Firth until it was hit by another huge storm which blew so much sand over it that the farm buildings themselves disappeared.
A rich estate had become a desert overnight and the owner, the local Laird, died pauper three years later.
The Great Storm of 1703 is recognized as the most powerful storm ever recorded in England and caused immense damage there as well as across the North Sea in Holland and Denmark.
Cold, Snow and Ice
Between 1680 and 1730, the coldest cycle of the Little Ice Age, temperatures plummeted and the growing season in England was about five weeks shorter than now.
The winter of 1683/4 was so cold that the ground froze to a depth of more than a meter in parts of south west England and belts of ice appeared off the Channel coast of England and northern France.
The ice lay up to 30 miles offshore along the Dutch coast and many harbours were so choked with ice that shipping halted throughout the North Sea.
Another exceptional winter was that of 1708/9.
Deep snow fell in England and lasted for weeks while further East people walked from Denmark to Sweden on the ice as shipping was again halted in the North Sea.
Hard frosts killed thousands of trees in France, where Provence lost most of its orange trees and vineyards were abandoned in northern France, not to be recultivated until the 20th Century.
In 1716 the Thames froze so deep that a spring tide raised the ice fair on the river by 4 meters!
The summer of 1725 in London was the coldest in the known temperature record and described as "more like winter than summer".
Fishing and Sea Conditions
During the 17th Century conditions around Iceland became exceptionally severe.
Sea ice often blocked the Denmark Strait throughout the summer.
In 1695, ice surrounded the entire coast of Iceland for much of the year, halting all ship traffic.
The inshore cod fishery failed completely, partly because the fish may have moved offshore into slightly warmer water.
On several occasions between 1695 and 1728, inhabitants of the Orkney Islands were startled to see an Inuit in his kayak paddling off their coasts.
These solitary hunters must have spent weeks marooned on large ice floes.
As late as 1756, sea ice surrounded much of Iceland for as many as thirty weeks a year.
The cod fishery off the Faeroe Islands failed completely as the sea surface temperature became 5C cooler than today, while enormous herring shoals deserted Norwegian waters for warmer seas further south.
Famine
As climatic conditions deteriorated, a lethal mix of misfortunes descended on a growing European population.
Crops failed and cattle perished by diseases caused by abnormal weather.
Famine followed famine bringing epidemics in their train, bread riots and general disorder.
Witchcraft accusations soared, as people accused their neighbours of fabricating bad weather.
Farming was just as difficult in the fledgling European colonies of North America where there were several severe drought cycles between 1560 and 1612 along the Carolina and Virginia coasts.
From 1687 to 1692, cold winters and cool summers led to a series of bad harvests.
Alpine villagers lived on bread made from ground nutshells, whilst in France, wine harvests were delayed till as late as November.
Widespread blight damaged many crops, bringing one of the worst famines in Europe since 1315.
Finland lost perhaps as much as a third of its population to famine and disease in 1696-7.
Things did not improve. 1739 brought more problems, ruining grain and wine harvests over much of western Europe, while winter grain yields were well down because the ground was too hard to plough for weeks.
By 1815, Europe was struggling with yet another cold spell, when the Tambora eruption made matters a whole lot worse.
The following year was described as "The year without a summer".
In France the grain harvest was half its normal level and southern Germany suffered a complete harvest failure.
In Switzerland grain and potato prices tripled, and 30000 were breadless, without work and resorted to eating "sorrel,moss and cats".
Inevitably such suffering brought with it social unrest, pillaging, rioting and criminal violence.
The famine encouraged many to emigrate to America, although in Saint John's, Newfoundland, 900 were sent back to Europe because there was so little food in town.
The crisis of 1816/7 was the last truly extensive food dearth in the Western world and its effects ranged from the Ottoman Empire, to parts of North Africa, large areas of Switzerland and Italy, western Europe and even New England and Canada.
Other parts of the world were also badly affected such as China.
Death tolls are hard to calculate but 65000 may have perished in Ireland, while in Switzerland the death rate could have doubled.
The death toll would have been much worse in England and France but for the availability of and ability to efficiently distribute reserve stocks of food.
| Craig Loehle |
Ph.D., Principal Scientist with the National Council for Air and Stream
Improvement (NCASI) His research interests include ecological modeling, landscape ecology, life history theory, and natural resource management. He is the author of over 100 scientific publications. ▶Craig Loehle: Who is who (Skeptiker) |
![]() de
de
![]() en
en
![]()
Annual mean temperature reconstruction for Greenland (blue line)
calibrated to instrumental temperatures for the west coast of Grennland
(red line) with 2 standard deviation error bars (grey shading).

-
Klimaskeptiker Info
2010-11-24 de Ein regionaler Ansatz bei der Untersuchung des Mittelalterlichen Klimaoptimumes und der Kleinen EiszeitZu den wichtigsten Ikonen der Vertreter der angeblichen anthropogenen globalen Erwärmung (AGW) gehört die berühmt-berüchtigte Hockeystick-Graphik von Michael Mann et al., mit denen auch Al Gore der Weltöffentlichkeit einreden wollte, die Erwärmung am Ende des 20. Jahrhunderts sei in den letzten 1000 Jahren beispiellos gewesen.
Das historisch gut belegte Mittelalterliche Klimaoptimum um das Jahr 1000 wurde von den Alarmisten dabei ebenso negiert wie die Kleine Eiszeit zwischen 1650 und 1850.
Eine weitere Studie tritt dieser falschen Darstellung der Klimageschichte entgegen.
-
Watts Up With That? (Antony Watts)
2010-11-24 en A regional approach to the medieval warm period and the little ice age
-
Fredrik Charpentier Ljungqvist, Stockholm University Sweden
en
A regional approach to the medieval warm period and the little ice age
-
C3 Headlines Climate Cycles Change
en Historical Temperatures - Charts/Graphs
|
Major Climate Changes Over Last 15'000 Years |
5'000 Years of Temperature Change Greenland Ice Core: Cooling Trend Since Minoan Period Warming |
|

|

|
|
|
Medieval Warming in China: 400 Years |
Western Iceland: Medieval Waarming |
|

|

|
|
The Original Mann "Hockey Stick" Corrected |
Fabricating the 'Blade' of the 'Hockey-Stick' |
|
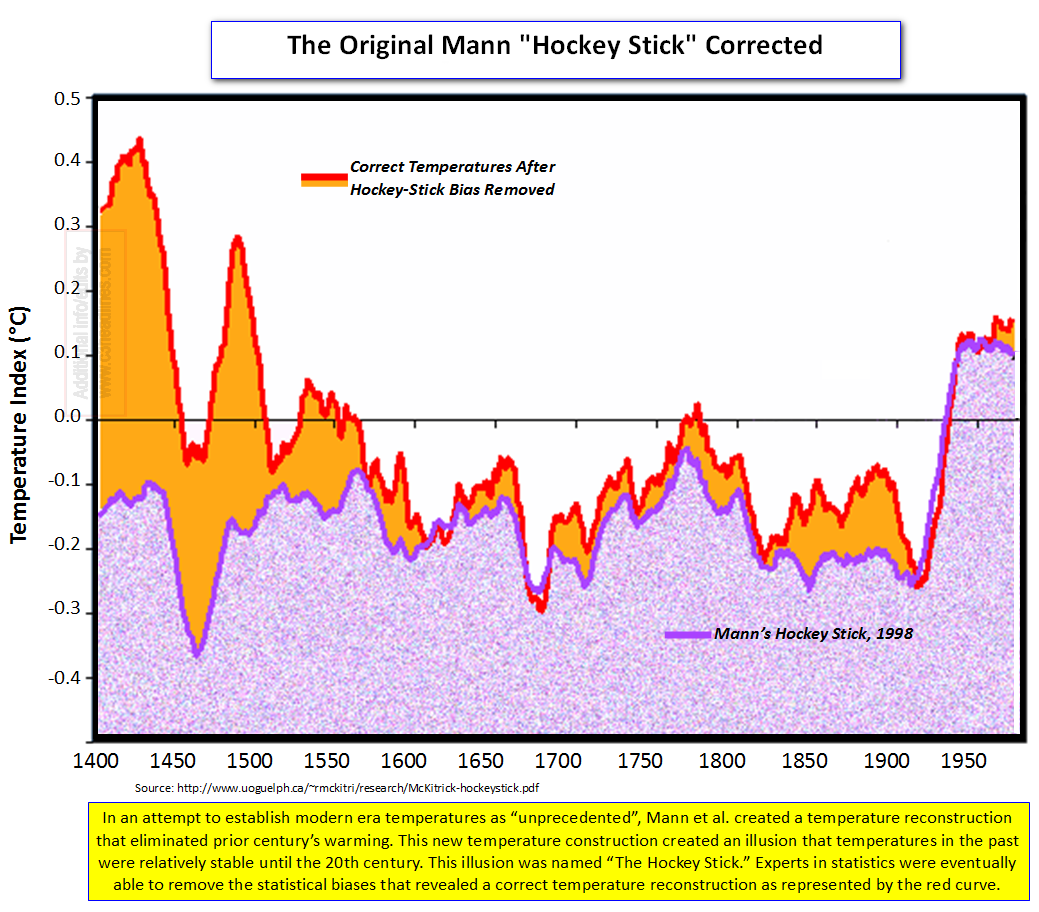
|

|
↑
c Einfluss der Sonne auf die Mittelalterliche Wärmeperiode und Kleine Eiszeit
en Solar inpact on the Medieval Climate Anomaly and the Little Ice Age
fr Impacte du soleit sur L'optimum climatique médiéval et le petit âge glaciaire
- de Mittelalterliche Wärmeperiode und Kleine Eiszeit in Höhlentropfsteinen des Sauerlandes
- de Während der Mittelalterlichen Wärmeperiode war es auf den schottischen Orkneyinseln im Sommer wärmer als heute
-
de
Abrupter Temperaturanstieg von mehr als einem Grad um 980
n. Chr. in Island: Mittelalterliche Wärmeperiode mit enormer Erwärmungsrate
en Decadal variability of sea surface temperatures off North Iceland over the last 2000 years -
de
Mittelalterliche Wärmeperiode und Kleine Eiszeit als lokales
nordatlantisches Phänomen: Seit wann liegt Japan am Atlantik?
en Mann's 'hockey stick' claims of the MWP and LIA being local were refuted years before it was published - de Neues Paper in Quaternary Science Reviews: Mittelalterliche Wärmeperiode und Kleine Eiszeit in den chilenischen Anden nachgewiesen
-
de
Kein nordatlantisches Phänomen: Mittelalterliche Wärmeperiode und
Kleine Eiszeit in den Anden gefunden
en The Medieval Climate Anomaly and the Little Ice Age in the Eastern Ecuadorian Andes - de Nordwestpassage war während der Mittelalterlichen Wärmeperiode eisfrei
- de Mittelalterliche Wärmeperiode: Von Mäusen, Wikingern, einem spanischen See und türkischen Pollen
- de Neues zur Mittelalterlichen Wärmeperiode: Die wundersame Wiederholung der Temperaturgeschichte
- de Die Kleine Eiszeit in China: Im 19. Jahrhundert war es am Jangtsekiang mehr als ein Grad kälter als heute
- de Eine unbequeme Wahrheit: Während der Kleinen Eiszeit waren die Stürme in Europa stärker als heute
↑ Mittelalterliche Wärmeperiode und Kleine Eiszeit in Höhlentropfsteinen des Sauerlandes
-
Die kalte Sonne (Fritz Vahrenholt & Sebastian Lüning)
2012-06-22 de Mittelalterliche Wärmeperiode und Kleine Eiszeit in Höhlentropfsteinen des Sauerlandes
↑ Während der Mittelalterlichen Wärmeperiode war es auf den schottischen Orkneyinseln im Sommer wärmer als heute
-
Die kalte Sonne (Fritz Vahrenholt & Sebastian Lüning)
2012-07-25 de Während der Mittelalterlichen Wärmeperiode war es auf den schottischen Orkneyinseln im Sommer wärmer als heuteDie wärmsten Sommer waren damals auf den Orkneys im Durchschnitt etwa ein Grad wärmer als heute.
Im Winter war es damals mehr als ein Grad kälter als heute.
Wenn man Sommer und Winter zusammenbetrachtet, lagen die Temperaturen auf den Orkneys wohl auf einem ähnlich hohen Niveau wie heute.
Die Untersuchungen zeigen noch einmal deutlich, wie wichtig eine Unterscheidung der einzelnen Klimaanzeiger (Klimaproxies) ist.
Während zum Beispiel Baumringe vor allem das Sommerklima speichern, enthalten Tropfsteine auch Informationen über feuchtere Winter.
Bei der Bildung von Mittelwerten und der Klimakurvenerstellung sollte dies berücksichtigt werden.
↑
Abrupter Temperaturanstieg von mehr als einem Grad um 980 n. Chr. in
Island: Mittelalterliche Wärmeperiode mit enormer Erwärmungsrate
en ADecadal variability of sea surface
temperatures off North Iceland over the last 2000 years
|
|
|


-
Die kalte Sonne (Fritz Vahrenholt & Sebastian Lüning)
2012-06-17 de Abrupter Temperaturanstieg von mehr als einem Grad um 980 n. Chr. in Island: Mittelalterliche Wärmeperiode mit enormer Erwärmungsrate
-
SciVerse / ScienceDirect
2008-01-26 en Decadal variability of sea surface temperatures off North Iceland over the last 2000 years
↑
Mittelalterliche Wärmeperiode und Kleine Eiszeit als lokales
nordatlantisches Phänomen: Seit wann liegt Japan am Atlantik?
en Mann's 'hockey stick' claims of the MWP and LIA
being local were refuted years before it was published
|
|
|

-
Die kalte Sonne (Fritz Vahrenholt & Sebastian Lüning)
2012-06-16 de Mittelalterliche Wärmeperiode und Kleine Eiszeit als lokales nordatlantisches Phänomen: Seit wann liegt Japan am Atlantik?Viele Jahre lang versuchten führende Vertreter des Weltklimarats den politischen Entscheidungsträgern und der Bevölkerung weiszumachen, dass die vorindustrielle Temperaturgeschichte angeblich ereignislos verlief und einen erstrebenswerten Idealzustand darstellte.
Die Erwärmung des 20. Jahrhunderts hingegen wäre etwas ganz Außergewöhnliches, Gefährliches.
Wie wir wissen wendete sich vor wenigen Jahren das Blatt und das unrühmliche Hockey Stick Kapitel endete.
Die fehlerhafte Kurve wurde wieder einkassiert und die Mittelalterliche Wärmeperiode sowie die Kleine Eiszeit waren rehabilitiert.
-
NoTricksZone / P Gosselin
2012-06-17 en Hockey Stick Was Refuted Before Its Fabrication - Study Ignored - IPCC And Mann Took World On 10-Year JoyrideGeologist Dr. Sebastian Lüning and Prof. Fritz Vahrenholt found a Japanese tree-ring temperature reconstruction from 1995, one that should have been heeded by the IPCC and Michael Mann before they took the world on a 10-year joyride in the stolen car of "climate science".
-
Watts Up With That? (Antony Watts)
2012-06-17 en Mann's 'hockey stick' claims of the MWP and LIA being local were refuted years before it was published
↑ Neues Paper in Quaternary Science Reviews: Mittelalterliche Wärmeperiode und Kleine Eiszeit in den chilenischen Anden nachgewiesen
-
Die kalte Sonne (Fritz Vahrenholt & Sebastian Lüning)
2012-07-03 de Neues Paper in Quaternary Science Reviews: Mittelalterliche Wärmeperiode und Kleine Eiszeit in den chilenischen Anden nachgewiesen
↑
Kein nordatlantisches Phänomen: Mittelalterliche Wärmeperiode und Kleine
Eiszeit in den Anden gefunden
en The Medieval Climate Anomaly and the Little
Ice Age in the Eastern Ecuadorian Andes
-
Die kalte Sonne (Fritz Vahrenholt & Sebastian Lüning)
2012-10-13 de Kein nordatlantisches Phänomen: Mittelalterliche Wärmeperiode und Kleine Eiszeit in den Anden gefunden
-
NoTricksZone (P Gosselin)
2012-10-13 de Medieval Warm Period Was Not "Just A Local Phenomenon" - Study Also Finds It In South America
Quelle / Source:
-
Climate of the Past
M.-P. Ledru, V. Jomelli, P. Samaniego, M. Vuille, S. Hidalgo, M. Herrera, and C. Ceron
2012 en The Medieval Climate Anomaly and the Little Ice Age in the Eastern Ecuadorian Andes
↑ Nordwestpassage war während der Mittelalterlichen Wärmeperiode eisfrei
-
Die kalte Sonne (Fritz Vahrenholt & Sebastian Lüning)
2012-11-19 de Nordwestpassage war während der Mittelalterlichen Wärmeperiode eisfrei
↑ Mittelalterliche Wärmeperiode: Von Mäusen, Wikingern, einem spanischen See und türkischen Pollen
-
Die kalte Sonne (Fritz Vahrenholt & Sebastian Lüning)
2012-03-27 de Mittelalterliche Wärmeperiode: Von Mäusen, Wikingern, einem spanischen See und türkischen Pollen
↑ Neues zur Mittelalterlichen Wärmeperiode: Die wundersame Wiederholung der Temperaturgeschichte
-
Die kalte Sonne (Fritz Vahrenholt & Sebastian Lüning)
2012-11-26 de Neues zur Mittelalterlichen Wärmeperiode: Die wundersame Wiederholung der Temperaturgeschichte
↑ Die Kleine Eiszeit in China: Im 19. Jahrhundert war es am Jangtsekiang mehr als ein Grad kälter als heute
-
Die kalte Sonne (Fritz Vahrenholt & Sebastian Lüning)
2012-07-04 de Die Kleine Eiszeit in China: Im 19. Jahrhundert war es am Jangtsekiang mehr als ein Grad kälter als heuteDa war sie wieder, die bei einigen Forschern unbeliebte Kleine Eiszeit. Wie bereits mehrfach berichtet, hatten prominente deutsche IPCC-nahe Forscher die Mittelalterliche Wärmeperiode und die Kleine Eiszeit lange als "lokales nordatlantisches Phänomen" abgetan, welches sich angeblich global herausmitteln sollte (z.B. Stefan Rahmstorf, Gerald Haug). Weit gefehlt.
Heute springen wir nach Asien und wollen uns eine neue Publikation aus China anschauen, in der die Autoren die Wintertemperaturen im Gebiet des längsten Flusses des Landes, des Jangtsekiang, für die vergangenen knapp 275 Jahre rekonstruiert haben.
Basis der Rekonstruktion waren historische Dokumente des Yu-Xue-Fen-Cu-Archivs aus der Qing Dynastie (1644-1911) in denen Tage mit Schneefall minutiös festgehalten wurden. Die Daten wurden mit Temperaturdaten aus der Region kalibriert, welche zwischen 1951-2007 gemessen wurden.
Die Forscher konnten zeigen, dass das 18. Jahrhundert um 0,76°C kälter und das 19. Jahrhundert sogar um 1,18°C kälter war als die moderne Referenzperiode von 1951-2007. Entsprechend waren die letzten 30 Jahre (1981-2007) um ein Viertel Grad wärmer als die Referenzperiode. Die kalte Phase des 18. und 19. Jahrhunderts entspricht dabei der "Kleinen Eiszeit" und die aktuell warmen Bedingungen der "Modernen Wärmeperiode".
Interessanterweise war die Erwärmungsrate im 20. Jahrhundert mit 0,66°C pro 100 Jahre deutlich geringer als die Rate der weniger industriell geprägten Phase 1862-1961, während der die Temperatur fast dreimal so schnell anstieg, nämlich um 1,89°C pro 100 Jahre. Dies zeigt eindrucksvoll, dass wir es in den letzten Jahrzehnten keineswegs mit "noch nie dagewesenen Erwärmungsraten" zu tun haben, sondern derartige Erwärmungsgeschwindigkeiten durchaus auch in der Vergangenheit auftraten.
↑ Eine unbequeme Wahrheit: Während der Kleinen Eiszeit waren die Stürme in Europa stärker als heute
-
Die kalte Sonne (Fritz Vahrenholt & Sebastian Lüning)
2012-08-05 de Eine unbequeme Wahrheit: Während der Kleinen Eiszeit waren die Stürme in Europa stärker als heute
↑
d IPCC liess das Mittelalterliche Klimaoptimum und die Kleine Eiszeit
verschwinden
en IPCC changed viewpoint on the MWP in 2001
fr Le GIEC fait disparaître l'optimum climatique médiéval
![]() de
de
![]() en
en
![]()
MWP = Medieval Warm Period (Mittelalterliche Warmzeit)
LIA = Little Ice Age (Kleine Eiszeit)
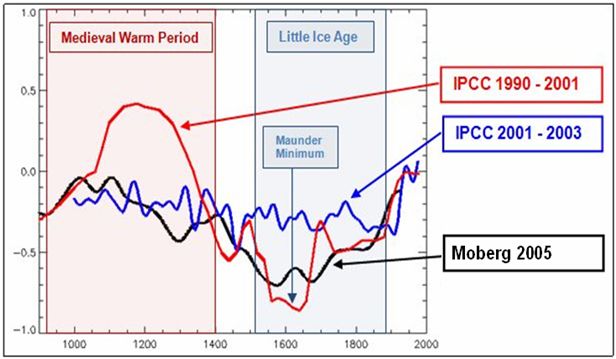
![]()
![]()
The "Hockey stick" curve
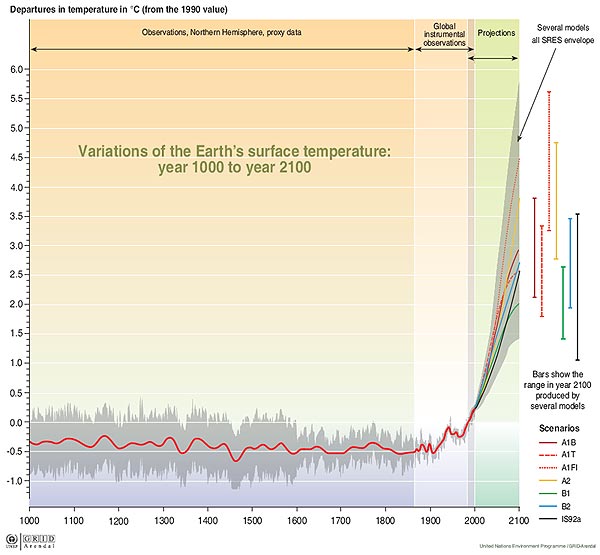
Ab 2001 verschwindet dieses geschichtlich belegte Phänomen.
-
Klimaskeptiker Info
2010-03-10 de Als das IPCC das Mittelalterliche Klimaoptimum verschwinden ließ...In älteren Veröffentlichungen des IPCC war das Mittelalterliche Klimaoptimum (Medieval Warm Period, MWP) enthalten.
Ab 2001 verschwindet dieses geschichtlich belegte Phänomen.
Es paßte nicht zu der Behauptung, die Erwärmung des 20. Jahrhunderts sei beispiellos gewesen.
Im Jahr 2001 reflektierte die Darstellung einer MWP die Mehrheitsmeinung innerhalb der Paläoklimatologie.
Das IPCC aber verbreitete ab 2001 einen neuen Standpunkt.
In der Folge erschienen mehrere Studien, die die Nichtexistenz des Mittelalterlichen Klimaoptimums bestätigte.Nach ClimateGate gibt es den Verdacht, daß bestimmte IPCC-verbundene Wissenschaftler wie Phil Jones das Erscheinen bzw. Nicht-Erscheinen von Studien manipuliert haben, um ihren Standpunkt der beispiellosen anthropogenen Erwärmung zu untermauern.
IPCC oder ihm nahestehende Personen haben also die wissenschaftliche Arbeit kontrolliert oder manipuliert.
Fazit: Die IPCC-Berichte haben mit seriöser Wissenschaft nichts zu tun.
Diese Veröffentlichungen sind nichts als bloße politische Propaganda.
-
Hide the decline
2010-03-08 en IPCC changed viewpoint on the MWP in 2001 - did this have effect on scientific results?
-
2006-12-06 en
"We have to get rid of the Medieval Warm Period!"
Video of Dr David Deming's statement to the U.S. Senate Committee on Environment & Public Works on December 6, 2006.
Dr Deming reveals that in 1995 a leading scientist emailed him saying "We have to get rid of the Medieval Warm Period".
A few years later, Michael Mann and the IPCC did just that by publishing the now throughly discredited hockey stick graph.
↑
G8 B Die Mittelalterliche Warmzeit (ca. 900 - 1350)
en
Medieval Warm Period (or Medieval Climate Optimum)
fr
L'optimum climatique médiéval
- de Allgemein en General fr Généarale
- de
Die Mittelalterliche Warmzeit - Erwärmung oder Datenmanipulation?
en The Medieval Warm Period - warming, or data manipulation? - de Mittelalterliche Wärmeperiode war um ein halbes Grad wärmer als heute
- de
Die Wikinger in Grönland
en The Vikings in Greenland
fr Les Vikings en Grœnland - de
Umfahrung Grönlands und des sibirischen Nordmeers 1421-1423
en The Voyages of the Treasure Fleets 1421-1423
fr Le voyage de l'armade chinoise 1421-1423 - de de Kartographie der Mittelalterlichen Wärmeperiode
- de
Die Mittelalterliche Warmzeit bei den Inkas in Peru
en The Medieval Warm Period linked to the success of Machu Picchu, Inca Empire
fr L'optimum climatique médiéval au Pérou - de The pre Columbian Civilisations of Central America - The Mesoamericans
- de Die Mittelalterliche Wärmeperiode in Afrika
- de Die Mittelalterliche Wärmeperiode in der Antarktis
- de
Belege für mittelalterliches Klimaoptimum im Westen der USA
en Giant Sequoias Yield Longest Fire History from Tree Rings - de Die Mittelalterliche Wärmeperiode der kanadischen Baffininsel
- en Evidence of the Medieval Warm Period in Australia, New Zealand and Oceania
- de Klimamodelle können nicht erklären, warum es vor 800 Jahren wärmer war
↑
Allgemein
en General
fr Générale
-
de
Die Mittelalterliche Warmzeit (auch Mittelalterliches Klimaoptimum
genannt) war eine vom 9. bis in das 14. Jahrhundert andauernde
Periode vergleichsweise milden Klimas.
Sie folgte auf das kalte Pessimum der Völkerwanderungszeit und endete mit Beginn der sog. "Kleinen Eiszeit".
-
en
The Medieval Warm Period (MWP) or Medieval Climate Optimum was a
time of unusually warm climate in the North Atlantic region,
lasting from about the tenth century to about the fourteenth century.
The Medieval Warm Period was a time of warm weather around 800-1300 AD during the European Medieval period.
-
fr
L'optimum climatique médiéval parfois appelé réchauffement
climatique de l'an mil est une période de climat inhabituellement
chaud localisé sur les régions de l'Atlantique nord et ayant duré
du Xe siècle jusqu'au XIVe siècle approximativement.
L'optimum climatique médiéval est une période de réchauffement climatique s'étalant environ de 800 à 1300 après Jésus-Christ, durant le Moyen Âge européen.
-
Wikipedia de
Mittelalterliche Warmzeit
en Medieval Warm Period (or Medieval Climate Optimum)
fr Optimum climatique médiéval
-
EIKE Europäisches Institut fü Klima und Energie
2009-04-22 de Mittelalterliches Optimum, lokal oder global ? "Spectrum der Wissenschaft" unterschlägt außereuropäische Berichte über die Mittelalterliche Warmzeit!
↑
Die Mittelalterliche Warmzeit - Erwärmung oder Datenmanipulation?
en
The Medieval Warm Period - warming, or data manipulation?
![]() Click for an interactive graphic that will expand each graph on mouseover
Click for an interactive graphic that will expand each graph on mouseover

-
Watts Up With That? (Antony Watts)
2009-11-29 en The Medieval Warm Period - a global phenomenon, unprecedented warming, or unprecedented data manipulation?
↑ Mittelalterliche Wärmeperiode war um ein halbes Grad wärmer als heute
-
Die kalte Sonne (Fritz Vahrenholt & Sebastian Lüning)
2015-06-09 de Zweiter Klimazustandsbericht zum Ostseeraum: Mittelalterliche Wärmeperiode war um ein halbes Grad wärmer als heuteMitte Mai 2015 erschien der Zweite Klimazustandsbericht zum Ostseeraum, koordiniert vom Helmholtz-Zentrum Geesthacht.
Das vorindustrielle Klima im Ostseeraum war alles andere als stabil.
Im Zeitraum 8000-4500 Jahre vor heute war es laut Studie um ein bis dreieinhalb Grad wärmer als heute.
Dies entspricht dem sogenannten "mittelholozänen Klimaoptimum".
Eine Hitzeperiode, die in der Öffentlichkeit heute gänzlich unbekannt ist und auch von den Pressestellen offenbar nicht sehr geliebt wird.
Plötzlich stellt sich die Zwischenüberschrift "Erwärmung schreitet voran" in einem ganz anderen Licht dar.
Es wird derzeit wärmer - aber es ist noch lange nicht wieder so warm wie vor 8000-4500 Jahren.
Am Ende der Kurzfassung wird auf die Mittelalterliche Wärmeperiode übergeleitet, die Teil des Folgekapitels von Tadeusz Niedzwiedz und Kollegen ist.
Im Text der Darstellung über das letzte Jahrtausend findet sich die altbekannte Klimazyklik, die man zwischenzeitlich beim IPCC unter den Tisch fallen lassen wollte:
Mittelalterliche Wärmeperiode, Kleine Eiszeit, Moderne Wärmeperiode:
Ein klares Statement:
Zur Zeit der Mittelalterlichen Wärmeperiode war es durchschnittlich um ein halbes Grad wärmer als heute.
Auch diesen nicht ganz unwichtigen Umstand wollte man keinesfalls in der Pressemitteilung zum Bericht erwähnt sehen.
Wie konnte es vor 1000 Jahren wärmer als heute sein, obwohl doch der CO2-Gehalt der Atmosphäre außerordentlich niedrig war?
Quellen / Sources:
-
Springer Link
2015-04-04 en Climate Change During the Holocene (Past 12,000 Years)
-
Springer Link
2015-04-04 en The Historical Time Frame (Past 1000 Years)
↑
Die Wikinger in Grönland
en The Vikings in Greenland
fr Les Vikings en Grœnland
de Allgemein en General fr Générale
|
|
|
de Verzeichnis en Contents fr Sommaire
- 2019
- en Study shows that Vikings enjoyed a warmer Greenland
- 2011
- en
Warum die Wikinger aus Grönland flohen
Ende des 14. Jahrhunderts zogen sie sich zurück - 2010
- en
Changing Greenland: Viking Weather
In 982 Erik the Redhe landed along a fjord near Qaqortoq
de Text en Text fr Texte
⇧ 2019
↑ en Study shows that Vikings enjoyed a warmer Greenland
-
Watts UP With That? (Antony Watts)
2019-02-19 en Study shows that Vikings enjoyed a warmer GreenlandStudy shows that Vikings enjoyed a warmer Greenland
This is a 21st-century reproduction of Thjodhild's church on Erik
the Red's estate (known as Brattahlíð) in present day Qassiarsuk,
Greenland
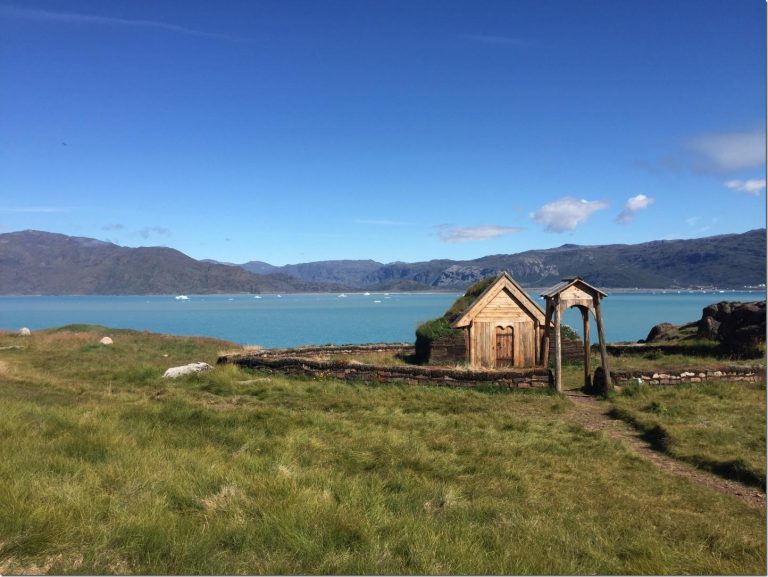
After reconstructing southern Greenland's climate record over the past 3,000 years, a Northwestern University team found that it was relatively warm when the Norse lived there between 985 and 1450 C.E., compared to the previous and following centuries.
"People have speculated that the Norse settled in Greenland during an unusually, fortuitously warm period, but there weren't any detailed local temperature reconstructions that fully confirmed that.
And some recent work suggested that the opposite was true," said Northwestern's Yarrow Axford, the study's senior author.
"So this has been a bit of a climate mystery."
Overall, the climate was about 1.5-degrees Celsius warmer than the surrounding cooling centuries.
This warmer period was similar to southern Greenland's temperatures today, which hover around 10-degrees Celsius (50-degrees Fahrenheit) in summer.
⇧ 2011
↑ Warum die Wikinger aus Grönland flohen
Ende des 14. Jahrhunderts zogen sie sich zurück
-
Spiegel Online
2011-05-31 de Warum die Wikinger aus Grönland flohenLange lebten die Wikinger in Grönland.
Als die Nordmänner ihre Kette kleiner Kolonien entlang der Westküste und im Süden der Insel errichteten, herrschte relativ mildes Klima, vergleichbar mit den heutigen Gegebenheiten.
In diesem "Mittelalterlichen Klimaoptimum" grünte selbst Grönland - daher der Name der Insel.
Als die Durchschnitts-Temperaturen später sanken, versuchten die Wikinger diesem Klima zunächst zu trotzen, mussten aber schließlich aufgeben.
⇧ 2010
↑ en Changing Greenland: Viking Weather
In 982 Erik the Redhe landed along a fjord near Qaqortoq
-
National Geographic
2010-06 en Changing Greenland: Viking WeatherGreenland's first experience of hype happened a millennium ago when Erik the Red arrived from Iceland with a small party of Norsemen, aka Vikings.
Erik was on the lam (from the Old Norse word lemja) for killing a man who had refused to return some borrowed bedsteads.
In 982 he landed along a fjord near Qaqortoq, and then, despite the bedsteads incident, he returned to Iceland to spread word about the country he had found, which, according to the Saga of Erik the Red, "he called Greenland, as he said people would be attracted there if it had a favorable name."
Erik's bald-faced marketing worked. Some 4,000 Norse eventually settled in Greenland.
The Vikings, notwithstanding their reputation for ferocity, were essentially farmers who did a bit of pillaging, plundering, and New World discovering on the side.
Along the sheltered fjords of southern and western Greenland, they raised sheep and some cattle, which is what farmers in Greenland do today along the very same fjords.
They built churches and hundreds of farms; they traded sealskins and walrus ivory for timber and iron from Europe.
Erik's son Leif set out from a farm about 35 miles northeast of Qaqortoq and discovered North America sometime around 1000.
In Greenland the Norse settlements held on for more than four centuries.
Then, abruptly, they vanished.
-
National Geographic Photo Gallery
2010-06 en Viking Weather - The Changing Face of GreenlandAs Greenland returns to the warm climate that allowed Vikings to colonize it in the Middle Ages, its isolated and dependent people dream of greener fields and pastures - and also of oil from ice-free waters.
↑
Umfahrung Grönlands und des sibirischen Nordmeers 1421-1423
en The Voyages of the Treasure Fleets 1421-1423
fr Le voyage de l'armade chinoise 1421-1423
▷Klimaänderungen der Vergangenheit (Wayback ohne Bilder)
Der Wasserplanet war im Original auf dem Server von ZUM gespeichert.
Die Dateien wurden von Lehrern des ZUM entfernt,
die Dateinamen wurden belassen
(damit auch gleich Propaganda für ZUM gemacht werden kann)
Die Links führen heute nur noch auf die Homepage
von ZUM
auf denen nur noch der Mensch für den Klimawandel verantwortlich
gemacht wird.
Alle Hinweise auf natürliche Ursachen des
Klimawandels wurden gelöscht
(vom Server entfernt).
![]() Animation
Animation
![]() Wasserplanet
Wasserplanet
![]()
Umfahrung Grönlands und des sibirischen Nordmeers 1421-1423
Animation: Auf das Bild klicken / Click on the image
(Datei gelöscht - Im Wayback‑Archiv nicht gespeichert)

Wasserplanet
de
1421: Umfahrung Grönlands und des sibirischen Nordmeers
Eine solche Nordpassage ist heute nicht mehr möglich.
1421.tv
en
1421 - The Year China discovered the World
Voyages of the Treasure Fleets, 1421-1423
The Voyages of the Treasure Fleets, 1421-3 are illustrated here using an animated flash movie. Once loaded you can view the passage of the fleets using the play button.
de Chinesische Website mit Animation
-
Am 8. März 1421, begann eine der grössten Flotten der Welt mit
über 100 Schiffen, die teilweise mehr als 150 m lang waren ihre
Reise um die Welt. Kaiser Zhu Dis Admiral Zheng He und andere
sollten den Tribut der Barbaren nach China bringen und der Welt
die Religion des Konfuzius.
Dabei entdeckten Sie Jahrzehnte vor Kolumbus, Maggelan und Cook Amerika, Australien, und die Antarktis.
Nach 2 Jahren kehrten sie nach Umfahrung Grönlands und des sibirischen Nordmeers wieder nach China zurück.
Eine solche Nordpassage ist heute nicht mehr möglich.
1492: Seit 80 Jahren kein Bischof mehr wegen Eis Grönland
-
1492 stellte der Papst fest, dass seit 80 Jahren kein Bischof
mehr wegen Eis Grönland hätte besuchen können.
Seit damals waren die Siedler wegen der Kälte wohl nach Neufundland weiter gewandert oder ausgestorben.
Noch 1408 beschreiben Vermählungsurkunden der grössten grönländischen Grundbesitzer aus staatl. Archiven in Oslo exakt die Landflächen, Viehbestände usw. ( z.B. grosse Schafs- und Rinderherden die auf saftigen Weiden grasten)
↑ Kartographie der Mittelalterlichen Wärmeperiode
-
Die kalte Sonne (Fritz Vahrenholt & Sebastian Lüning)
Das Projekt:
2015-11-07 de Kartographie der Mittelalterlichen Wärmeperiode: Online-Atlas einer noch immer unverstandenen Hitzephase
↑
Mittelalterliche Warmzeit bei den Inkas in Peru
en The Medieval Warm Period linked to the success
of Machu Picchu, Inca Empire
fr L'optimum climatique médiéval au Pérou
|
Gemäss IPCC
|
de Der IPCC-Bericht von 2001 unterschlägt die früheren Perioden, die wärmer waren als heute: "aktuelle Belege sprechen nicht für globale synchrone Perioden von anomaler Kälte oder Wärme während dieses Zeitrahmens, und die geläufigen Begriffe 'Kleine Eiszeit' und 'Mittelalterliches Klimaoptimum' scheinen nur geringen Wert zur Beschreibung hemisphärischer oder globaler Trends oder Veränderungen der Durchschnittstemperaturen in vergangenen Jahrhunderten zu haben.". en The 2001 IPCC report suppresses evidence of earlier periods warmer than today: "current evidence does not support globally synchronous periods of anomalous cold or warmth over this time frame, and the conventional terms of 'Little Ice Age' and 'Medieval Warm Period' appear to have limited utility in describing trends in hemispheric or global mean temperature changes in past centuries". fr Le rapport 2001 du GIEC escamote les périodes du passé plus chaudes qu'aujourd'hui |
Realität
en Reality
fr Réalité
de Die AGW-Anhänger haben die gut dokumentierten und starken Klimaschwankungen der letzten 1000 Jahre, die erheblich intensiver waren als die kurzfristige Erwärmung zwischen 1980 und 2000, als lokale europäische Phänomene kleinzureden versucht.
Dieser Versuch, Beweise gegen die CO2-Treibhaushypothese auszuhebeln, ist jetzt gescheitert.
-
Klimaskeptiker Info
2009-07-08 de Inkas blühten im mittelalterlichen Klimaoptimum auf
en Of course, there's many researchers, such as Michael Mann and his thoroughly discredited "hockey stick" that try mightily to make the Medieval Warm Period disappear.
The rapid expansion of the Inca from the Cuzco area of highland Peru produced the largest empire in the New World between ca. AD 1400-1532.
Although this meteoric rise may in part be due to the adoption of innovative societal strategies, supported by a large labour force and standing army, we argue that this would not have been possible without increased crop productivity, which was linked to more favourable climatic conditions.
-
Whatts Up With That? (Anthony Watts)
2009-07-08 en The Medieval Warm Period linked to the success of Machu Picchu, Inca Empire
-
A. J. Chepstow-Lusty, M. R. Frogley, B. S. Bauer, M. J. Leng,
K. P. Boessenkool, C. Carcaillet, A. A. Ali,
and A. Gioda
2009-03-04 en
Putting the rise of the Inca Empire within a climatic and land
management context
-
Living in Peru / Nicholas Asheshov
2009-07-01 en Opportunity knocks, again, in the Andes
-
Wikipedia de
Inka
en Inca Empire
fr Civilisation inca
↑ The pre Columbian Civilisations of South America
-
Climate History
en What Hubert Lamb Really Wrote About The Medieval Warm PeriodThe subject of the Medieval Warm Period is widely misunderstood.
Not least because few today have read the works of the historian and meteorologist who first brought awareness of climate and its impact on human history to wide public attention.Changes in climate together with extreme weather events have played major roles in the history of the pre-Columbian civilizations of Central and South America of the past two millennia, including the period known as the Medieval Warm Period.
en Drought and the Collapse of the Maya Civilisation
The fascination these abandoned cities hold arose because it became clear that many great cities, over a very wide area, had been abandoned before the arrival of the Spanish conquistadors. These cities and their magnificent buildings had clearly been centres of major states, supported by a vast complex of productive farms.
To name just some of the more significant cities:
Aguateca, Calakmul, Copan, Caracol, Chichen Itzan, Coba, Copan, Edzna, Ek Balem, El Mirador, Izimte, Palenque, Rio Azul, Tikal, Uaxactun, Uxmal & Yaxchilan.en The pre Columbian Civilisations of Central America - The Mesoamericans
There is a pre Conquest history of civilisations in Central America that extends back 3,500 years.
It's thought that humans have been in the Americas since 12,000 - 18,000 years BC.
The earliest human artefacts found so far are from Chile and date to around 11,000 BC.
By the 15th century AD most of the Americas were quite heavily populated.
In total the population of the Americas in pre Colombian times is estimated to have stood at around 40 million people - it may have been higher
en The pre Columbian Civilisations of South America
Mochica, Chimu, Sican, Wari, Tiwanaku and Inca ~ plus Amazonia
↑ Die Mittelalterliche Wärmeperiode in Afrika
-
Die kalte Sonne (Fritz Vahrenholt & Sebastian Lüning)
2015-11-23 de Die Mittelalterliche Wärmeperiode in Afrika
| de | en | fr |
|---|---|---|
|
Auswirkungen des Klimas Auswirkungen auf Afrika |
Impact of Climat Change Impacts on Africa |
Impacts du climat Impacts en Afrique |
↑ Die Mittelalterliche Wärmeperiode in der Antarktis
-
Die kalte Sonne (Fritz Vahrenholt & Sebastian Lüning)
2015-12-15 de Ganzen Kontinent mit einem Datenpunkt erklären? Antarktische Außenseiter-Studien zur Mittelalterliche Wärmeperiode offenbaren große LiteraturlückenErwärmung während der MWP
Peinlich: Alle anderen Arbeiten von der Antarktischen Halbinsel zeigen deutliche Hinweise auf eine Erwärmung während der MWP.
Die Amerikaner dokumentieren in ihrer Studie eine 200 Jahre andauernde Warmphase, die sich dort um das Jahr 1000 n. Chr. ereignete.
Im Sedimentkern findet sich in jenem Zeitabschnitt eine Lage, die reich an organischem Gehalt ist (siehe Abbildung unten).
Die Wärme führte zu einem Aufblühen der Lebewelt, deren Reste heute im Bohrkern enthalten sind.
Erwärmung ab 1600 n. Chr
Eine ungewöhnlich frühe Erwärmung ab 1600 n. Chr., die zur Modernen Wärmeperiode überführte.
Die Erwärmung begann mehrere hundert Jahre bevor der CO2-Gehalt der Atmosphäre im industrielen Zeitalter nach oben schnellte.
Dieser Wärmeepisode des 17. Jahrhunderts begegnen wir übrigens auch in einigen anderen Studien aus der Antarktis.
Dronning Maud Land in der Ostantarktis
Wichtige Erkenntnis: Von 1000 bis 1250 n. Chr.war es so warm wie heute.
Eisschelfs südlich des Weddell-Meeres
Insgesamt zeigt jedoch noch immer die allergrößte Anzahl der Studien in der Antarktis eine MWP-Erwärmung.
-
Die kalte Sonne (Fritz Vahrenholt & Sebastian Lüning)
2015-12-01 de Die Mittelalterliche Wärmeperiode in der Antarktis: Weshalb können die Klimamodelle sie nicht reproduzieren?
| de | en | fr |
|---|---|---|
|
Auswirkungen des Klimas Antarktis (Südpol) |
Effects of Climate Change Antarctic (South Pole) |
Conséquences climatiques Antarctique (Pôle Sud) |
↑
Belege für mittelalterliches Klimaoptimum im Westen der USA
en
Giant Sequoias Yield Longest Fire History from Tree Rings
-
Klimaskeptiker Info
2010-03-17 de Belege für mittelalterliches Klimaoptimum im Westen der USADas in Europa historisch gut belegte mittelalterliche Klimaoptimum, während dessen es um das Jahr 1200 deutlich wärmer war als gegenwärtig, wollen die Anhänger der AGW-Hypothese als auf Europa begrenztes Phänomen marginalisieren.
Jetzt liefert eine Studie weitere Belege für den globalen Charakter der mittelalterlichen Warmzeit.
-
Klimaskeptiker Info
2010-03-17 en Giant Sequoias Yield Longest Fire History from Tree RingsCalifornia's western Sierra Nevada had more frequent fires between 800 and 1300 than at any time in the past 3,000 years, according to a new study led by Thomas W. Swetnam, director of UA's Laboratory of Tree-Ring Research.
↑ Die Mittelalterliche Wärmeperiode der kanadischen Baffininsel
-
Die kalte Sonne (Fritz Vahrenholt & Sebastian Lüning)
2016-01-16 de Eine Moräne macht noch keinen Winter: Mittelalterliche Wärmeperiode behauptet sich im Faktencheck gegen plumpes Aktivistenpaper zur kanadischen Baffininsel
-
Watts Up With That? (Antony Watts)
Sebastian Lüning
2016-01-18 en Baffin Island study disappoints: The illusive 'coup de grace' on the Medieval Warm Period
↑ en Evidence of the Medieval Warm Period in Australia, New Zealand and Oceania
-
Watts Up With That? (Antony Watts)
Sebastian Lüning
2016-01-09 en Evidence of the Medieval Warm Period in Australia, New Zealand and Oceania
↑ Klimamodelle können nicht erklären, warum es vor 800 Jahren wärmer war
|
|
|


-
Klimaskeptiker Info
2009-12-04 de Jo Nova findet das mittelalterliche Klimaoptimum
Eine der Kernbehauptungen der Klima-Alarmisten ist es, daß es in den letzten paar tausend Jahren nicht so warm war wie gegenwärtig und daß dies ein Beleg für den menschlichen Einfluß auf die Temperatur sei.
Aber im Hochmittelalter war es deutlich wärmer als jetzt.
-
JoNova
en Fraudulent hockey sticks and hidden data
These maps and graphs make it clear just how brazen the fraud of the Hockey Stick is.
It's clear that the world was warmer during medieval times.
Marked on the map are study after study (all peer-reviewed) from all around the world with results of temperatures from the medieval time compared to today.
These use ice cores, stalagmites, sediments, and isotopes.
They agree with 6,144 boreholes around the world which found that temperatures were about 0.5°C warmer world wide.
de Aus der Panik-Küche en From the panic laboratory fr De la marmite des alarmistes
-
2009-11-25 en
Al Gore Lies about Melting Ice and Rising Sea Levels
↑
C Die Kleine Eiszeit (von 1350 bis ca. 1850)
en The Little Ice Age
fr Petit âge glaciaire
- Die Kleine Eiszeit
- Die Kleine Eiszeit, eine frühneuzeitliche Klimakatastrophe
- 1815 Der Ausbruch des Vulkans Tambora
1816 Das Jahr ohne Sommer - 1816 The Year Without a Summer
- Kleine Eiszeit war global und extremste Kältephasen ereigneten sich zu Zeiten schwacher Sonnenaktivität
-
de
Die Kleine Eiszeit als weltweite Kältephase: Welche Rolle spielten
die Vulkane?
en From Schmidt 2005 to Miller 2012: the "not needed" excuse for omitted variable fraud - Videos
↑ Die Kleine Eiszeit / The Little Ice Age / Le petit âge glaciaire
-
Wikipedia de
Kleine Eiszeit
en Little Ice Age
fr Petit âge glaciaire
![]()
![]()
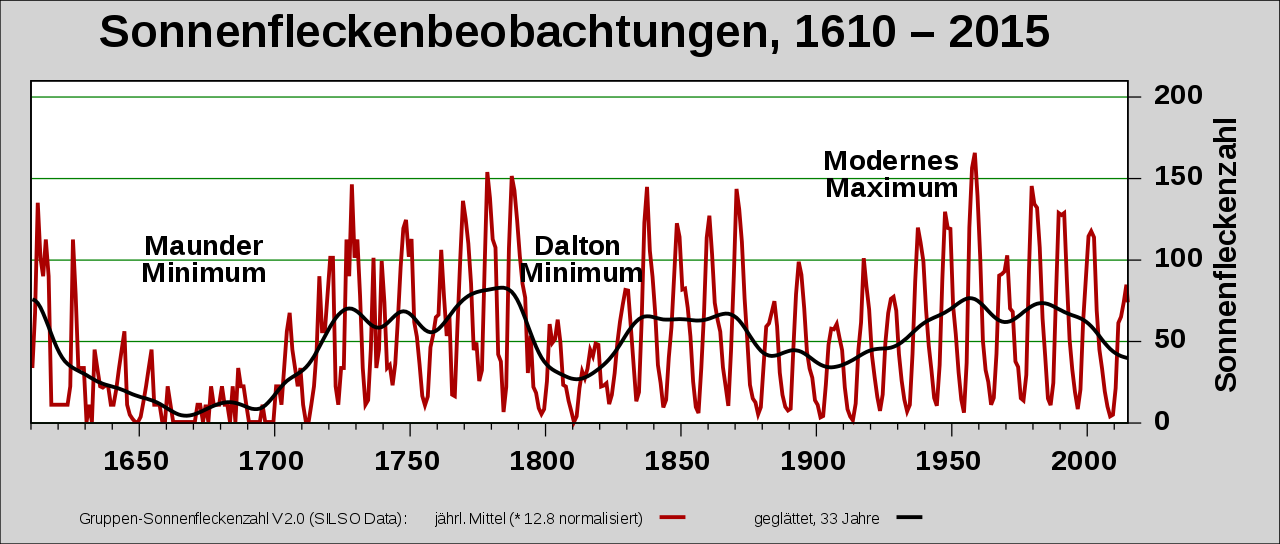
-
de
Die Kleine Eiszeit war eine Periode relativ kühlen Klimas von Anfang
des 15. bis in das 19. Jahrhundert hinein.
Sie gilt in der heutigen Klimadiskussion als das klassische Beispiel einer durch kurzfristige Schwankungen geprägten natürlichen Klimavariation.
Doch auch während der Kleinen Eiszeit gab es erhebliche Klimaschwankungen. So stellen zum Beispiel die Zeiträume von 1570-1630 oder von 1675-1715 besonders kalte Zeitabschnitte dar.
-
en
The Little Ice Age (LIA) was a period of cooling occurring after
a warmer era known as the Medieval climate optimum.
It is generally agreed that there were three minima, beginning about 1650, about 1770, and 1850, each separated by slight warming intervals.
Any of several dates ranging over 400 years may indicate the beginning of the Little Ice Age:- 1250 for when Atlantic pack ice began to grow
- 1300 for when warm summers stopped being dependable in Northern Europe
- 1315 for the rains and Great Famine of 1315-1317
- 1550 for theorized beginning of worldwide glacial expansion
- 1650 for the first climatic minimum
-
fr
Le petit âge glaciaire (PAG) est une période climatique
froide survenue en Europe et en Amérique du Nord, d'environ
1550-1580 à 1850-1860.
Quelques grands évènements climatiques peuvent donc être soulignés comme des points de repère d'un petit âge glaciaire étendu du XIIIe siècle au milieu du XIXe siècle :- 1250 : début de l'extension de la calotte glaciaire en Atlantique
- 1300 : les étés jusqu'alors chauds cessent de l'être de façon nette
- 1315 : précipitations soutenues et Grande Famine de 1315-1317
- 1550 : début théorique de l'expansion mondiale des glaces
- 1650 : premier minimum climatique
|
|
|
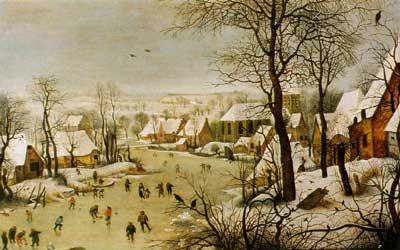
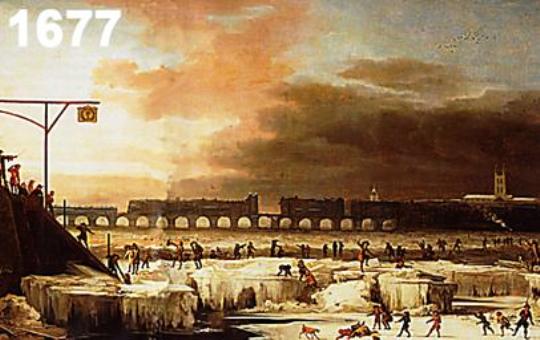
-
Wasserplanet de
Klimaänderungen der Vergangenheit
-
en/sous-titres fr:
Video
![]()
![]()
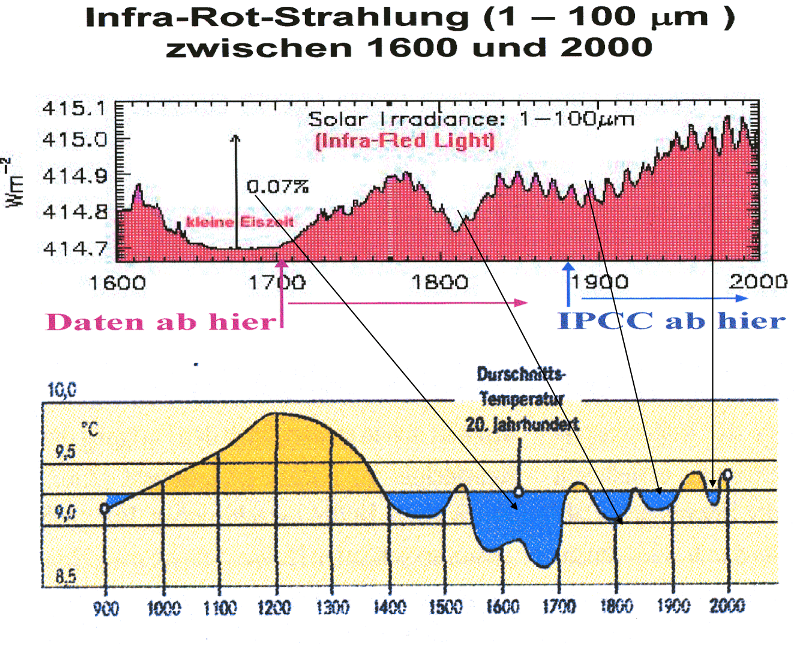
↑ Die Kleine Eiszeit, eine frühneuzeitliche Klimakatastrophe
-
NZZ
2004-01-24 de Die Kleine Eiszeit, eine frühneuzeitliche KlimakatastropheBemerkung:
Lesen Sie den Artikel bis zum Schluss, in dem die Frage gestellt wird, ob heute die Politiker, Umweltschützer, Geschäftsleute, Profiteure und Mitläufer mit der "Klimakatastrophe" die gleiche Hexenjagd auf CO2-Verursacher durchführen, wie dies im späten Mittelalter mit den "Schuldigen an der Eiszeit" geschehen ist.
-
Burghard Schmanck de Realsatire?
(Es soll auch an diejenigen gedacht werden, die selbst nachdenken und ihren Arbeitsplatz verlieren, wenn sie nicht die offizielle Auffassung vertreten)
| de | en | fr |
|---|---|---|
|
Klima-Diskurse: Diskussionen Ausschluss und Maulkorb für Kritiker |
Climate Discurses: Discussions Exclusion of critics |
Clima discurs: Discussions Exclusion des critiques |
↑
1815 Der Ausbruch des Vulkans Tambora
1816 Das Jahr ohne Sommer
-
EIKE Europäisches Institut für Klima und Energie
Dirk Maxeiner
2016-08-29 de Vor 200 Jahren: Der Vulkan und das "Jahr ohne Sommer"Wir freuen uns über einen wunderbaren Spätsommer mit vollen Freibädern, auch Bauern und Winzer sehen alles in allem einer guten Ernte entgegen.
Der Weizenpreis befindet sich wegen einer globalen Rekordernte auf einem Zehnjahrestief, auch Mais und Sojabauern sehen Höchsterträgen entgegen.
Freuen wir uns also über ein Jahr, das den Katastrophen-Kassandras keinen Vorwand bietet, mal wieder das Lied von der unmittelbar bevorstehenden Klimakatastrophe anzustimmen.
-
Berner Zeitung
2015-04-05 de Katastrophe vor blutrotem AbendhimmelVor 200 Jahren explodierte östlich von Java der Vulkan Tambora so heftig, dass ein Jahr später in der Schweiz der Sommer ausfiel.
Nach heutigem Wissensstand die wohl grösste Vulkaneruption der letzten 7000 Jahre.
Die unvorstellbare Gewalt der Explosion vom 10. April 1815 katapultierte die idyllische indonesische Tropeninsel Sumbawa an den Rand des Untergangs.
Über 2000 Kilometer weit soll man das unheimliche Grollen gehört haben.
Das aus dem Erdinnern aufschiessende, brühend heisse Magma jagte die obersten 1500 Höhenmeter des idyllischen Vulkans Tambora in die Luft wie eine lästige Kopfbedeckung, so dass der Kraterrand heute noch auf 2850 Metern über Meer liegt.
Angeblich soll durch die Detonation so viel Energie freigesetzt worden sein, als wären drei Millionen Hiroshima-Bomben gleichzeitig gezündet worden.
Der Ausbruch löste Wirbelwinde aus, die Wälder und Häuser flachlegten. Mit der Erschütterung bäumte sich das Meer zu einem monströsen Tsunami auf. Mindestens 70'000 Menschen kamen auf Sumbawa und den Nachbarinseln direkt nach der Eruption ums Leben.
Tagelang verdunkelte eine Aschewolke den Himmel über dem indonesischen Achipel, ehe sie zu Boden sank.
Die heftige Explosion führte dazu, dass grosse Mengen Schwefelgas über die erdnahe Troposphäre hinaus bis in die Stratosphäre transportiert wurden.
Dort, 25 bis 30 Kilometer vom Erdboden entfernt, gibt es kein Wetter und keine Wolken mehr, mit der Folge, dass Schadstoffe nicht ausgeregnet werden.
Sie können deshalb sehr lange schweben und ihre Wirkung über ein oder zwei Jahre ungehindert entfalten.
Kriegserschöpfte Menschen
Allerdings war den Menschen in der Schweiz dieser Zusammenhang nicht bewusst, als sie «ihrer» Katastrophe in die Augen sahen.
Über Stratosphärenzirkulation wusste man damals noch nichts, einen Zusammenhang zwischen dem nicht stattfindenden Sommer und dem Tambora-Ausbruch stellten Wissenschaftler erst 1913 her.
Abgesehen davon stand der Bevölkerung damals die Not ohnehin schon bis zum Hals.
Das Volk war psychisch und physisch ausgezehrt durch die von Napoleon angezettelten Kriege in den Jahren zuvor.
Zudem setzte den Menschen seit 1810 eine Serie unüblich kühler Sommer zu.
Verzweifelt hoffte man auf Besserung. Doch es kam noch schlimmer.
Während dem Sommer 1816 regnete es praktisch jeden Tag, die Temperaturen lagen ein bis zwei Grad unter dem Durchschnitt und jeden Monat schneite es bis auf den Gurten.
Die Trauben- und Getreideernte musste abgeschrieben werden, Kartoffeln grub man im Herbst unreif aus dem Schnee.
Es war die letzte grosse Hungerkrise in der westlichen Welt, von der die Schweiz stark betroffen war, weil sich, indirekt beeinflusst durch den Tambora-Ausbruch, die Wetterextreme in einer relativ schmalen Zone von Frankreich über die Schweiz bis Süddeutschland konzentrierten.
-
Basler Zeitung
2015-04-09 de Als die Schweizer Gras assen
-
Watts Up With That? (Antoy Watts)
2009-06-20 en Historic Variation in Arctic Ice
The summer of 1816 was exceptionally cold (the year without a summer- probably due to the eruption of Mount Tambora in Indonesia on 10 April 1815)
The Hudson Bay ships bringing fur to London were actually frozen in during this period, whilst 1817 was an "Enso- el nino year" with the late winter of 1816 and summer of 1817 being warm, matching reports from earlier years that the ice was periodically melting, with a great deal of open water, and as reported by the Hudson bay co, and by others, as having an 'unprecedented break up' in 1815 and 1816.
In 1817 Scoresby contacted Banks about the melting,
In 1820 Scoresby found the ice around Greenland was melting and in 1822 mapped much of what had previously been an inhospitable coast.
-
Willie Soon and Steven H.Yaskell
en
1816 Year Without a Summer
A weak solar maximum, a major volcanic eruption, and possibly even the wobbling of the Sun conspired to make the summer of 1816 one of the most miserable ever recorded.
↑ 1816 The Year Without a Summer
-
Watts Up With That? (Antoy Watts)
2009-06-20 en Historic Variation in Arctic Ice
The summer of 1816 was exceptionally cold (the year without a summer- probably due to the eruption of Mount Tambora in Indonesia on 10 April 1815)
The Hudson Bay ships bringing fur to London were actually frozen in during this period, whilst 1817 was an "Enso- el nino year" with the late winter of 1816 and summer of 1817 being warm, matching reports from earlier years that the ice was periodically melting, with a great deal of open water, and as reported by the Hudson bay co, and by others, as having an 'unprecedented break up' in 1815 and 1816.
In 1817 Scoresby contacted Banks about the melting,
In 1820 Scoresby found the ice around Greenland was melting and in 1822 mapped much of what had previously been an inhospitable coast.
-
Willie Soon and Steven H.Yaskell
en
1816 Year Without a Summer
A weak solar maximum, a major volcanic eruption, and possibly even the wobbling of the Sun conspired to make the summer of 1816 one of the most miserable ever recorded.
Du climat Lorrain 1312-1998
-
Skyfall / Changement Climatique
2007-06-25 fr Du climat Lorrain
Source:
-
TOUTE LA LORRAINE
fr Du climat Lorrain
L'histoire du climat en Lorraine de 1312 à nos jours : inondation à Metz et Nancy, canicule, température en hivers, crue de la Moselle et de la Meurthe et hauteur d'eau, tremblement de terre, intemperies.
↑ Kleine Eiszeit war global und extremste Kältephasen ereigneten sich zu Zeiten schwacher Sonnenaktivität
-
Die kalte Sonne (Fritz Vahrenholt & Sebastian Lüning)
2014-12-12 de Studie der University of Gloucestershire: Kleine Eiszeit war global und extremste Kältephasen ereigneten sich zu Zeiten schwacher Sonnenaktivität
↑
a Die Kleine Eiszeit als weltweite Kältephase: Welche Rolle spielten
die Vulkane?
en From Schmidt 2005 to Miller 2012: the
"not needed" excuse for omitted variable fraud
-
Die kalte Sonne (Fritz Vahrenholt & Sebastian Lüning)
2012-05-19 de Die Kleine Eiszeit als weltweite Kältephase: Welche Rolle spielten die Vulkane?Noch vor einigen Jahren gab es doch wirklich Wissenschaftler, die die Kleine Eiszeit und Mittelalterliche Wärmeperiode als lokales nordatlantisches Phänomen kleinreden wollten.
Was heute im Rückblick unvorstellbar erscheint, wurde erschreckenderweise von einigen Forschern jahrelang als angeblicher "Konsens" in der Öffentlichkeit verbreitet.
Es war die Zeit als die Welt noch von der Hockey Stick Kurve genarrt wurde.
Der frischgebackene Doktor Michael Mann hatte die Kleine Eiszeit und die Mittelalterliche Wärmeperiode mithilfe statistisch fragwürdiger Methoden und fehlerhafter Daten kurzerhand zu einem klimatisch ereignislosen Strich ausgebügelt.
Auch in Deutschland gab es prominente Unterstützung für diese heute nicht mehr nachvollziehbare Denkweise.
So spielte Stefan Rahmstorf vom Potsdam-Institut für Klimafolgenforschung (PIK) 2007 die zahlreichen weltweiten Hinweise auf die Mittelalterliche Wärmeperiode und die Kleine Eiszeit in einem FAZ-Beitrag mit den Worten herunter:
"Dass lokal und regional wesentlich größere Klimaschwankungen auftreten als in der globalen Mitteltemperatur, ist für jeden Klimatologen klar [...]. Diese mitteln sich jedoch global heraus [...]."
Die Hockey Stick Kurve ist heute Geschichte, die beiden lange bekannten, natürlichen Klimaschwankungen der letzten 1000 Jahre wieder rehabilitiert.
In seinem faszinierenden Buch "The Hockey Stick Illusion" schildert Andrew Montford wie die Hockey Stick Kurve enttarnt wurde, die noch im 2001er IPCC Bericht sowie in Al Gores Klimafilm eine tragende Rolle gespielt hatte.
In den letzten Monaten haben weitere wissenschaftliche Arbeiten den globalen Charakter der Kleinen Eiszeit eindrucksvoll belegen können.
Das angebliche "nordatlantische Phänomen" wurde nun gleich von drei Wissenschaftlergruppen in der Antarktis nachgewiesen.
So untersuchte ein Forscherteam der Scripps Institution of Oceanography der University of California in San Diego um Anais Orsi die Temperaturdaten eines 300 m tiefen Bohrlochs im West Antarktischen Eisschild.
In der im Mai 2012 in den Geophysical Research Letters erschienenen Studie konnten die Wissenschaftler zeigen, dass die Temperaturen im Untersuchungsgebiet von 1400 bis 1800 etwa ein halbes Grad unter dem Temperaturdurchschnitt der vergangenen 100 Jahre lag.
Die kalifornischen Forscher bestätigten damit den globalen Charakter der Kleinen Eiszeit.
Das frühere Modell einer reinen Wärmeumverteilung auf der Erde, also einem energetischen Nullsummenspiel, halten Anais Orsi und seine Kollegen aufgrund ihrer neuen Ergebnisse für abwegig.
Die auch von Rahmstorf einst propagierte Klimaschaukel, bei der die Kälte in einem Gebiet durch Wärme in einem anderen Gebiet ausgeglichen würde, hat sich letztendlich nicht bestätigt.
Im Januar 2012 war bereits eine neue Studie vom antarktischen Ross Schelfeis im Fachmagazin Climate oft he Past Discussions erschienen.
Ein Forscherteam um Rachel Rhodes vom Antarctic Research Centre im neuseeländischen Wellington konnte auch für das Rossmeer die Kleine Eiszeit in eindrucksvoller Weise nachweisen. Während der Kleinen Eiszeit lagen die Temperaturen in der Region etwa 1,75°C unter denen von heute.
Welche Rolle spielen die Vulkane?
Da der Weltklimarat die Bedeutung dieser Studien jedoch noch immer eisern kleinredet und die Sonne in den IPCC-Klimamodellen eine nur zu vernachlässigende Klimawirkung besitzt, brauchte der der IPCC dringend Ersatz für die kollabierte Hockey Stick-Argumentation.
Eine nichtsolare Alternative musste dringend her, die die benötigte Kühlung verursacht haben soll.
Bei der Suche nach einer neuen klimatisch dämpfenden Wunderwaffe fiel die Wahl auf kühlende Asche von Vulkanen.
Ein weiterer wichtiger Gesichtspunkt ist, dass es bereits eine ganze Reihe von "Kleinen Eiszeiten" in den letzten 10.000 Jahren gegeben hat.
Immer wenn die Sonne im Verlauf ihres 1000-Jahreszyklus einen Tiefpunkt erreichte, gingen die Temperaturen zurück und es brach eine neue "Kleine Eiszeit" an.
Spinnt man die Vulkan-Idee zurück in der Zeit, müssten auch in all diesen Fällen "zufällig" immer Vulkane ausgebrochen sein, um dann die Kälteperiode zu erklären.
Könnte man das Absacken der Sonnenaktivität während der Kleinen Eiszeit im letzten Jahrtausend vielleicht gerade noch als Zufall durchgehen lassen, ist jedoch eine Vervielfachung dieses blöden Zufalls in den davorliegenden Jahrtausenden aus wissenschaftlicher Sicht vollkommen auszuschließen.
Das jahrtausendealte Muster spricht daher ganz eindeutig für einen solaren und weniger für einen vulkanischen Auslöser der Kleinen Eiszeit.
...
Die Kleine Eiszeit in Spanien, der Schweiz und Taiwan
...
-
Watts Up With That? (Antony Watts)
2012-04-29 en From Schmidt 2005 to Miller 2012: the "not needed" excuse for omitted variable fraudMiller et al. 2012 recently provided some pretty strong evidence for a solar driver of climate. "This is the first time anyone has clearly identified the specific onset of the cold times marking the start of the Little Ice Age," said lead author Gifford Miller in January. And the dates?
LIA summer cold and ice growth began abruptly between 1275 and 1300 AD, followed by a substantial intensification 1430-1455 AD.
As you can see in the graphic above (from Usoskin 2003) these dates correspond pretty much with the midpoints of the Wolf and Spörer solar minima.
(Usoskin 2007 centers Wolf at 1305 with a duration of 70 years and Spörer at 1470 with a duration of 160 years.)
Yet Miller never noted this coincidence.
In fact, he tried to hide it, claiming that the onset of snow and ice growth coincided with periods of especially high volcanism (debunked both by Willis and by Wired), while dismissing the solar explanation with a misleading reference to the Maunder Minimum:
...
↑ Videos
"All Things Cold"
-
9th International Conference on Climate Change 2014
2014-07-11 en
Panel "All Things Cold" (2014 ICCC)
Sonnenflecken und steigende Weizenpreise
en Sunspots and Rising Grain Prices
-
Watts Up With That? (Antony Watts)
David DuByne
2014-11-03 en
100 Year Snow Records broken across the South Eastern US on October
31st and November 01st
2014-10-02 en
2015-2035 Mini Ice Age
(
Source)
1 Sunspots and Rising Grain Prices
2 Snow and Record Cold 2014
3 Nine Arctic Seas Gain Ice 2014
4 Agricultural Losses 2014 from Cold Temperatures
Das neue solare Minimum hat begonnen. Kommt jetzt eine neue Kleine Eiszeit? Das folgende Video diskutiert, wie Chinas Landwirtschaftsstrategie aussehen könnte:
2015-03-23 en
![]() China's Food Production Strategy for the New Grand Solar Minimum
China's Food Production Strategy for the New Grand Solar Minimum
China's Food Production Strategy for the New Grand Solar Minimum.
What is their Knowledge of Solar Minimums and Climate Change since trading for 2000+ years to faraway destinations?
Do they know what the climate in Africa will change to this solar minimum and is why they are investing so heavily in N.Africa for future food production areas?
Land Grabbing
-
Wikipedia
de
Land Grabbing
en Land grabbing
fr Accaparement des terres
-
Basler Zeitung
2016-03-10 de Hier machte es bei Markus Ritter klickWissen Sie, was «Land Grabbing» bedeutet?
Für den obersten Schweizer Bauern war dies der Start für die Ernährungs-Initiative - wegen eines hohen Besuchs aus China.
Für den Bauernverbandspräsidenten ist klar, dass für die Versorgung der Schweizer Bevölkerung mit einheimischen Produkten viel Land gebraucht wird.
Die Schweiz sei jetzt nur noch zu 50 Prozent selbstversorgend, und es werde immer weniger.
Das chinesische Land Grabbing als Inspiration für die Initiative
Ritter vergleicht die Reduzierung von Kulturland in der Schweiz in seiner Argumentation mit dem Land Grabbing: dem grossflächigen Aufkaufen von Land in Schwellen- und Drittweltländern durch finanziell starke Staaten, vor allem in Afrika und in Asien.
«Das Land Grabbing zeigt, dass sich viele Staaten auf der ganzen Welt bewusst sind, dass die Versorgung ihrer Bevölkerung mittel- und langfristig mit dem eigenen Kulturland nicht gesichert ist», sagt Ritter.
In den kommenden 20 Jahren würde es in weiten Teilen der Erde zu einem «Engpass in der Ernährungssicherheit» kommen.
Es sei wichtig, dass die Versorgung der Schweizer Bevölkerung für die Zukunft gesichert werde: «Das geht nur, wenn der Verlust von Kulturland deutlich reduziert wird.
Andernfalls ist in 200 Jahren die ganze Schweiz vom Bodensee bis zum Genfersee verbaut.»
Besonders bekannt für das Land Grabbing sind die Chinesen. Schon seit mehreren Jahren kauft sich das Land systematisch in afrikanische Farmen, beispielsweise in Moçambique, ein und bringt zur Bewirtschaftung nicht selten gleich noch chinesische Bauern mit.
Es sind denn auch die Chinesen, die Ritter und die anderen Initianten für diese Initiative inspiriert haben.
Während eines Besuchs des chinesischen Ministerpräsidenten Li Keqiang, unter anderem auf einem Hof eines Mitglieds des Bauernverbands, sei die Idee entstanden, sagt Ritter.
Über 220 Millionen Hektaren wurden in Drittweltländern gekauft
Land Grabbing wird mittlerweile von vielen Staaten oder auch privaten Investoren getätigt. Japan, Südkorea und China bezwecken damit vor allem, sicherstellen zu können, ihre Bevölkerung ausreichend zu ernähren.
Golfstaaten wie Katar oder Saudiarabien haben das gleiche Ziel vor Augen, doch verschiedene Bedingungen.
Wegen der Wüstenlandschaften ist der landwirtschaftliche Anbau in ihren Ländern schwierig.
Durch den Ankauf von Land in fruchtbareren Regionen wollen sie vor allem unabhängiger werden.
Shocking Truth:Global Cooling, The Little Ice Age Begins in 2014
Little ICE Age - Big CHILL
-
en
Little ICE Age - Big CHILL
Little Ice Age: Big Chill reveals all traits of the Little Ice Age - its scientific properties, its natural causes, the people it affected and specific examples of areas it decimated.
-
Artikel über dieses Video
The History Channel presents:
en
Little Ice Age: Big Chill
Zurück in die Eiszeit
In Search Of The Coming Ice Age
Original broadcast: May 1978.
de Die drohende Eiszeit der 1970er Jahre und die Klimahysterie der modernen Zeit.
en The coming ice age of the 1970s and the climte hysteria of modern times.
Global Cooling - The Coming Ice Age
-
2013-03-02 en
The Coming Ice Age - 1978
-
2011-02-09 en
1988 Documentary about the upcoming Ice Age
-
2013-10-29 en
New Little Ice Age Coming
Mike Lockwood about the prospects of a new LIA.
-
2013-05-19 en
Ice Age of the dimming Sun in 30 years
-
2009-10-25 en
Professor George Kukla
⇧
G9 Klimawandel seit der Kleinen Eiszeit
en
Climate change since the Little Ice Age
fr
Changement climatique depuis le petit âge glaciaire
Mit folgenden Links wird von anderen Webseiten auf diese Seite verwiesen:
| de | en | fr |
|---|---|---|
|
Klima Geschichte Klimawandel seit der Kleinen Eiszeit |
Climate History Climate change since the Little Ice Age |
Histoire du climat Changement climatique depuis le petit âge glaciaire |
de Verzeichnis en Contents fr Sommaire
- G9 a de
Globale Durchschittstemperatur
en Global average temperature
fr Température moyenne globale - G9 b de Vergleich verschiedener Temperaturverläufe
- G9 c de
Die letzten 50 Jahre
en The last 50 Years - G9 d en We Can't Think of Anything Else It Could Be
- G9 e de
Jahresmitteltemperaturen Deutschland in den letzten 25 Jahren,
nach DWD
- G9 2013
- de
Klimawandel seit der Kleinen Eiszeit
Fakten zum Klimawandel seit der Kleinen Eiszeit
de Text en Text fr Texte
↑
G9 a Globale Durchschnittstemperaturen
en Global average temperatures
fr Températures moyenne globales
![]()
![]() UK Met Office's - Hadley Centre - Climate Research Unit
UK Met Office's - Hadley Centre - Climate Research Unit
Annual Global Average Land and Ocean Temperature Anomaly

![]()
![]() NASA's Goddard Institute for Space Studies (GISS)
NASA's Goddard Institute for Space Studies (GISS)
Global Monthly Mean Surface Temperature Anomaly

![]()
![]() NOAA's - National Climate Data Center
NOAA's - National Climate Data Center
Annual Global Land and Ocean Temperature Anomalies
![]()
![]() UK Met Office - Hadley Center - Climate Research Unit (CRU)
UK Met Office - Hadley Center - Climate Research Unit (CRU)
Monthly Global Average Land Temperature

![]()
![]() CRU HadCRUT4
CRU HadCRUT4
Northern and Southern Hemispheric Temperature Anomalies

![]()
![]() University of Alabama - Hunstville (UAH)
University of Alabama - Hunstville (UAH)
Satellite-Based Temperature of the Global Lower Atmosphere

![]()
![]() UAH University of Alabama Huntsville
UAH University of Alabama Huntsville
Lower Troposphere Temperature
Satellite-based microwave sounding unit temperatures (red line)
Blue line shows a loess smooth, span=0.4.

↑ G9 b Vergleich verschiedener Temperaturverläufe
![]()
![]() IPCC predicted Globak Warming Trend
IPCC predicted Globak Warming Trend
versus
Surface Temperatures
and
Satellite Temperatures

- archive.org Vergleich verschiedener Temperaturverläufe
↑
G9 c Die letzten 50 Jahre
en The last 50 Years
- Erdoberflächentemperatur
- Global Mean Temperature - Disputed Data
- U.S. Historical Climatology Network (USHCN) Data Set
↑ Erdoberflächentemperatur
- Betrachtet man die Entwicklung der Erdoberflächentemperatur über einen längeren (geologische jedoch minimalen) Zeitraum ist bemerkenswert, dass sowohl Satellitenmessungen und zuverlässige Bodenmessungen ohne Wärmeinseleffekt übereinstimmen und praktisch keine Temperaturerhöhung zeigen.
- Wasserplanet: Erdoberflächentemperatur
↑ Global Mean Temperature - Disputed Data
Diagramm 1 wird in Frage gestellt
- Es wird vermutet, die letzten Werte seien nicht korrekt gemessen worden, da der Wärmeeffekt in bewohnten Gebieten die Daten verfälscht hätten.

Diagramm 2 wird als richtig und representativer betrachtet
- Es wird angenommen, diese Messungen seien representativer für den Verlauf der Temperaturen.

-
john-daly en
Global Mean Temperature - Disputed Data
↑ U.S. Historical Climatology Network (USHCN) Data Set
Aussagen:
- In this section of our web site, we invite you to analyze temperature and precipitation trends across the conterminous United States, to see for yourself whether or not our claim that "There Has Been No Global Warming for the Past 70 Years" is indeed correct, at least as far as the United States is concerned.
- We believe that it is, and that for the vast majority of stations, you will see that there has been no net warming since 1930. To further illustrate this point, we have created a "Temperature Record of the Week" page, where we highlight the temperature trend since 1930 at a given USHCN station each and every week.
- CO2science.org en U.S. Historical Climatology Network (USHCN) Data Set
↑ G9 d We Can't Think of Anything Else It Could Be
PDO = Pacific Decadal Oscillation
![]()
![]()

![]()
![]()

-
Climate Skeptic
2008-09-18 en We Can't Think of Anything Else It Could Be
G9 2007 Coldest in this century
Figure 1:
- Nine hottest years on record as shown by the RSS MSU calculations, from the hottest year 1998 to the coolest year 2007
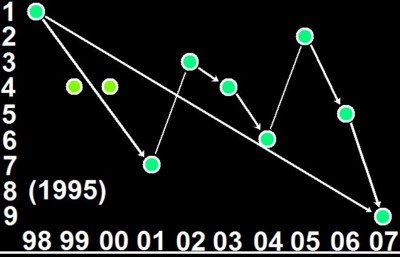
Figure 2: Global cooling 2005-2007
- The trend is over 15 °C of cooling per century. ;-)
- Also, the trend is accelerating: for the 12 months of 2007, a similar linear regression gives about 35 °C of cooling per century. :-)

-
motls.blogspot.com
en 2007 Coldest in this century
↑ G9 e Jahresmitteltemperaturen Deutschland in den letzten 25 Jahren, nach DWD
![]()
![]()
![]() Jahresmitteltemperaturen Deutschland in den letzten 25 Jahren, nach DWD
Jahresmitteltemperaturen Deutschland in den letzten 25 Jahren, nach DWD

⇧ 2013
↑ Klimawandel seit der kleinen Eiszeit
-
Die kalte Sonne (Fritz Vahrenholt & Sebastian Lüning)
Horst Malberg Univ. Prof. (A.D.) für Meteorologie und Klimatologie
2013-05-12 de Klimawandel seit der Kleinen Eiszeit: Die Wirkung der Sonne wurde unterschätztEinleitung
Die über den Klimawandel und seine primäre Ursache aussagekräftigsten Klima-/ Temperaturreihen finden sich in West- und Mitteleuropa.
Dabei reichen die Beobachtungsdaten der Central England Temperatures (CET) bis ins 17. Jahrhundert, die der Mitteleuropareihe (Klimamittel aus Berlin, Basel, Prag, Wien) bis 1701 zurück.
Bei der nachfolgenden Analyse ab 1671 wurden für die drei Dekaden 1671-1700 die Mitteleuropatemperaturen aus den CET-Daten abgeleitet (Reduktionsfaktor -0,5°C).
Zur Berliner Wetterkarte
In den Beiträgen zur Berliner Wetterkarte (BWK) SO 29/09 bzw. SO 37/09 war der Zusammenhang zwischen Sonnenaktivität und Klimawandel in Mittel- bzw. Westeuropa getrennt untersucht worden.
Im ersten Fall konnte dadurch die Auswirkung des integralen solaren Effekts auf einen primär kontinental geprägten, im zweiten auf einen ozeanischen Klimabereich erfasst werden.
In Analogie zur Betrachtung des globalen Klimawandels, d.h. des Mittels aus primär ozeanischer Südhemisphäre und stark kontinental geprägter Nordhemisphäre, wird bei der vorliegenden Analyse eine Europa-Temperaturreihe als Mittel aus Central-England-Reihe und Mitteleuropareihe gebildet.
Auf diese Weise wird eine repräsentative empirische Aussage über die integralen (direkten und indirekten) Auswirkungen solarer Aktivitätsänderungen auf den Klimawandel seit der Kleinen Eiszeit möglich.
...
Schlussbetrachtungen
Die durchgeführte Klimaanalyse belegt auf der Grundlage zuverlässiger Beobachtungsdaten mit hoher statistischer Sicherheit den dominierenden Einfluss der Sonne auf den Klimawandel.
Jede langfristige Änderung des solaren Klimaantriebs führte in den vergangenen Jahrhunderten zu einer Veränderung des Klimas in Europa.
Sonnenaktivität und Klimaverhalten weisen unverkennbar eine synchrone, rund 200-jährige Schwingung auf (De-Vries-Zyklus).
Im Gegensatz zum solaren Effekt vermag das CO2 diesen sinusartigen Klimaverlauf seit 1670 nicht zu erklären.
Zwischen 1670 und 1850 lag der CO2-Gehalt der Luft konstant bei 280 ppm, d.h. sein Einfluss auf den Klimawandel war in diesem Zeitraum gleich Null.
Kleine Eiszeit, die nachfolgende Erwärmung im 18. Jahrhundert und der Temperatursturz zu Beginn des 19. Jahrhunderts vollzogen sich bei konstantem CO2-Gehalt allein als Folge natürlicher, primär solar angetriebener Klimaprozesse.
Warum der integrale solare Klimaeffekt nach 1850 nur noch eine unbedeutende Rolle beim Klimawandel spielen soll,
wie es das IPCC und seine Anhänger behaupten, entbehrt jeder Logik und muss nach den obigen Ergebnissen als nicht haltbar angesehen werden.
Jede Stagnation und jeder Rückgang der Temperatur ist ein elementarer Widerspruch zur angeblichen Dominanz des CO2-Effekts, denn nach der Hypothese vom dominierenden anthropogenen CO2-Klimaeffekt dürfte es nur noch Erwärmungen geben.
Die Varianz des Temperaturverhaltens kann daher durch den CO2-Effekt nicht erklärt werden.
Wenn aber Stagnation und Abkühlungen "naturbedingt" sind, sollte die Natur auch heute in der Lage sein, bei Erwärmungen die wesentliche Rolle zu spielen.
Alles andere wäre paradox.
Alle Korrelationen zwischen Sonnenaktivität und Klimawandel
sind nicht nur für die Zeit vor 1850, sondern auch für die Erwärmung im 20. Jahrhundert auf hohem Niveau statistisch signifikant.
Es ist daher nicht nachvollziehbar, wenn von CO2-Anhängern behauptet wird, der integrale solare Effekt betrüge nur 10%, obwohl er 80% der klimarelevanten Temperaturvarianz der Erwärmung (regional wie global) hochsignifikant erklärt.
Der Einwand, Europa spiegele nicht den globalen Klimawandel wider, ist nicht stichhaltig.
Aber selbst, wenn dem so wäre, wenn also die Änderungen der Sonnenaktivität nur in Europa klimabestimmend wären, käme dem solaren Effekt eine grundlegende Bedeutung für die hier lebenden Menschen, die Natur im allgemeinen und die Landwirtschaft im speziellen zu.
Doch ist der Einwand vor allem deswegen nicht stichhaltig, weil die Klimaerwärmung in Europa nach 1850 synchron zum globalen Temperaturanstieg verlaufen ist, d.h. der Klimawandel in Europa ist Teil des globalen/nordhemisphärischen Klimaverhaltens.
So liegt die Korrelation zwischen dekadischem globalen
Temperaturverhalten und dem Temperaturverlauf in Europa über +0,90, d.h. das Klima in Europa ist über die allgemeine atmosphärische und ozeanische Zirkulation in alle wesentlichen Veränderungen des globalen Klimas eingebunden.
Ausblick:
Die Sonne ist derzeit am Beginn einer ruhigen Aktivitätsphase und wird voraussichtlich im aktuellen Zyklus bereits den kritischen Mittelwert von 50 Sonnenflecken erreichen bzw. unterschreiten, also den Grenzwert zwischen einer Wärme- und einer Kälteperiode.
Analog zu den Klimabedingungen zur Zeit des Dalton-Minimums vor 200 Jahren gilt es daher, sich auf eine Klimaabkühlung in den kommenden
Jahrzehnten einzustellen.
Allein die "launige" Sonne wird über das grundsätzliche Ausmaß der zu erwartenden Abkühlung entscheiden und auch darüber, wann es mit der Temperatur allmählich wieder aufwärts geht.
Letzteres ist voraussichtlich im Verlauf der 2. Hälfte des 21. Jahrhunderts zu erwarten, wenn die Sonne wieder in eine aktivere Phase wechselt.
Sowohl der 200-jährige De-Vries-Zyklus als auch der 80-90-jährige Gleißberg-Zyklus der Sonnenaktivität deuten auf die bevorstehende Talfahrt der Sonnenaktivität hin
mit allen Folgen für das globale Klima und die Welternährung.
Zum gleichen Ergebnis kommt auch I. Abdussamatov vom russischen Hauptobservatorium Pulkovo bei St.Petersburg.
Auch nach seinen Ergebnissen wird das solare Minimum - und entsprechend der Höhepunkt der Abkühlung - während der Sonnenfleckenzyklen um 2055 zu erwarten sein.
Das CO2 wird nach den obigen Auswertungen weder Europa noch den Globus vor der kommenden Abkühlung bewahren.
Es kann den Temperaturrückgang höchstens etwas abmildern.
Seit 15 Jahren ist es global nicht mehr wärmer geworden.
Die Globaltemperatur stagniert bzw. weist in jüngster Zeit eine fallende Tendenz auf, und zwar trotz jährlich kräftig weiter steigender CO2-Emissionen.
(Warum wird die Öffentlichkeit von den Medien darüber nicht informiert?).
Für den politisch motivierten "Weltklimarat" (IPCC) und seine Anhänger ist es an der Zeit, das Dogma vom dominierenden CO2-Klimaeffekt aufzugeben
und mit der Ausgrenzung bis Verketzerung der Klima-Querdenker aufzuhören.
Nicht weil man dem mainstream angehört, hat man in der Wissenschaft automatisch die besseren Erkenntnisse.
Globale Erwärmungen von 4°C nebst apokalyptischen Folgen bis 2100 mittels CO2-dominierter Klimamodelle "vorherzusagen", (Weltbank, PIK), sind reine Hypothesen.
Wird der solare Effekt mit all seinen Wechselwirkungen unter- und der CO2-Effekt überschätzt, kann man keine realistischen Klimaaussagen erwarten.
Wie die früheren Klimaanalysen so lässt auch die vorliegende nur einen Schluss zu:
Im Vergleich zum integralen solaren Klimaeffekt mit all seinen komplexen, nicht-linearen Wirkungsmechanismen (Ozean, Wolken, Albedo, Biosphäre, kosmische Strahlung,...) ist der anthropogene Treibhaus-/CO2-Effekt nur von untergeordneter Bedeutung.
Auch der medienwirksame Versuch, singuläre Extremwetterereignisse auf einen anthropogenen Klimaeinfluss zurückzuführen, entbehrt jeden Beweises.
Orkane, tropische Wirbelstürme, Tornados, Dürren, Überschwemmungen hat es, wie die Chroniken belegen, in allen Jahrhunderten infolge außergewöhnlicher synoptischer Konstellationen mal mehr und mal weniger gegeben. Allerdings werden durch das anhaltende Bevölkerungswachstum auf bald 7 Mrd. immer mehr Menschen sowie ihre Güter von den Naturkatastrophen betroffen.
An die Stelle eines überschätzten, ineffektiven Klimaschutzes sollten sich alle Anstrengungen auf einen weltweiten Umweltschutz konzentrieren:
Saubere Luft, sauberes Wasser, unbelastete Böden und ein intaktes Ökosystem zählen zu den Grundrechten des Menschen.
Auch sind wegen der Begrenztheit der fossilen Ressourcen und der Umweltbelastungen durch Verbrennungsprozesse Maßnahmen zur CO2-Reduzierung gut zu begründen.
Der sog. Klimaschutz ist dagegen die ineffektivste aller Maßnahmen.
Ein stabiles Klima hat es in der Klimageschichte nie gegeben, und wird es auch in Zukunft nicht geben.
-
Prof. Horst Malberg
2011-04-06 de
Klimawandel seit der kleinen Eiszeit
Vortrag über den Klimawandel seit der kleinen Eiszeit von Prof. Horst Malberg, ehemals Leiter des Instituts für Meteorologie an der Freien Universität Berlin, auf der Konferenz der Bürgerrechtsbewegung Solidarität in Bad Salzuflen, 20. März 2010.
![]()
![]() Abb. 3 Mittlere Sonnenfleckenzahl je Sonnenfleckenzyklus 1672-1999
Abb. 3 Mittlere Sonnenfleckenzahl je Sonnenfleckenzyklus 1672-1999

![]()
![]() Abb.4 Mitteltemperaturen in Europa 1672-1999
Abb.4 Mitteltemperaturen in Europa 1672-1999

In Abb.3 ist die Änderung der solaren Aktivität für den Zeitraum 1672-1999 wiedergegeben,
in Abb.4 ist die Temperatur-/Klimaentwicklung im gleichen Zeitraum dargestellt.
Unschwer zu erkennen ist zum einen, dass Klimawandel ein permanenter Prozess ist und nicht erst ein Phänomen des Industriezeitalters.
Auch vor 1850 mussten die Menschen mit nachhaltigen Erwärmungen und Abkühlungen leben.
Besonders bemerkenswert ist, dass die Klimaerwärmung von der Kleinen Eiszeit bis zum Ende des 18. Jahrhunderts mit rund 1°C genau so groß war wie die aktuelle seit 1850.
Die natürlichen Klimaprozesse sind somit auch ohne anthropogene "CO2-Hilfe" jederzeit in der Lage, nachhaltige Erwärmungen zu verursachen.
Unverkennbar zeigt der Vergleich der beiden Abbildungen zum anderen das grundsätzlich synchrone Verhalten von solarer Aktivität und Temperatur/Klima.
Der "ruhigen" Sonne zur Zeit des Maunder- sowie des Dalton-Minimums entsprechen die beiden Kälteperioden.
Der "aktiven" Sonne im 18. und 20.Jahrhundert entsprechen die beiden Erwärmungsperioden.
![]()
![]()
-
EIKE Europäisches Institut für Klima und Energie
Prof. Dr. Horst Malberg
2013-02-13 de Abkühlung kommt? Fakten zum Klimawandel seit der Kleinen EiszeitDie UN-Klimakonferenz 2012 in Katar ist Geschichte. Wieder wurde im Vorfeld eine globale Katastrophen-Erwärmung nebst drastischen Folgen verkündet, wurden durch die Medien unkritisch Horrormeldungen verbreitet. Diesen CO2-basierten apokalyptischen Klima-Szenarien sollen die Klimafakten, soll die Klimarealität gegenüber gestellt werden.
Die über den Klimawandel und seine primäre Ursache aussagekräftigsten Klima-/ Temperaturreihen finden sich in West- und Mitteleuropa.
Dabei reichen die Beobachtungsdaten der Central England Temperatures (CET) bis ins 17. Jahrhundert,
die der Mitteleuropareihe (Klimamittel aus Berlin, Basel, Prag, Wien) bis 1701 zurück.
Bei der nachfolgenden Analyse ab 1671 wurden für die drei Dekaden 1671-1700 die Mitteleuropatemperaturen aus den CET-Daten abgeleitet (Reduktionsfaktor -0,5°C).
-
Beiträge zur Berliner Wetterkarte
Herausgegeben vom Verein BERLINER WETTERKARTE e.V.
c/o Institut für Meteorologie der Freien Universität Berlin
Horst Malberg, Univ.Prof. (A.D.) für Meteorologie und Klimatologie
2013-01-08 de
Fakten zum Klimawandel seit der Kleinen Eiszeit
|
|
Fakten zum Klimawandel seit der Kleinen Eiszeit Klima-Beobachtungen: Sonnenaktivität Sonnenaktivität: Schwankungen der Sonnenaktivität steuern das Klima Klimawandel-Wissenschaft: Klima-Zyklen |
⇧
H Klima heute
en The climate today
fr Le climat aujourd'hui
Mit folgenden Links wird von anderen Webseiten auf diese Seite verwiesen:
▶Klima heute| de | en | fr |
|---|---|---|
|
Klima Geschichte Klima heute |
Climate History The climate today |
Histoire du climat Le climat aujourd'hui |
de Allgemein en General fr Générale
|
|
Klima heute / The climate today / Le climat aujourd'hui |
| ►Der Wasserplanet (Ernst-Georg Beck) | de ▷Klimänderung heute (Wayback ohne Bilder) |
| Wikipedia |
de
Klima en Climate fr Climat |
| Vademecum |
▶Klima heute
▶Welt-Info |
| de | en | fr |
|---|---|---|
|
Klima: Wandel Klima-Beobachtungen Korrelationen mit der Sonne |
Climate: Change Climate Observations Correlations with the Sun |
Climat: Changement Observations sur le climat Corrélations avec le soleil |
| de | en | fr |
|---|---|---|
| Neuste Informationen über den Klimawandel | News on Climate Change | Nouvelles informations sur le changement climatique |
| Die Erwärmungspause | The Hiatus | La pause du réchauffement climatique |
de Verzeichnis en Contents fr Sommaire
- 2008
- de
Die Abkühlungsphase seit 2001 in Zusammenhang mit dem
Sonnenfleckenzyklus
en Cooling related to sunspot cycles
fr Refroidissement due aux cycles solaires - de
Temperaturen und CO2 1997-2008
en Temperatures and CO2 1997-2008
fr Températures et CO2 1997-2008 - de
Land- und Ozean Oberflächen Temperaturen 2008-04
en Surface Land- and Ocean Temperatures 2008-04
fr Températures des surfaces de la terre et des océans 2008-04 - de
Satellitenmessungen 2008-05
en Satellite measurements 2008-0
fr Mesurages par satellites 2008-05 - de Klimawandel seit 1988 in Deutschland
- en Global cooling decade 2001-2008
- de
Das CO2 steigt und Temperaturen fallen
en CO2 is rising and the temperature are falling
fr Le CO2 monte et les températures baissent - de Ist auch der Trend des stetig steigenden CO2 am Ende?
- de Der Juli 2004 war im globalen Durchschnitt der kälteste Juli seit 12 Jahren
de Text en Text fr Texte
⇧ 2008
↑
Die Abkühlungsphase seit 2001 in Zusammenhang mit dem
Sonnenfleckenzyklus
en Cooling related to sunspot cycles
fr Refroidissement due aux cycles solaires
- Lower Troposhphere Global Temperature: 1979-2008
- Oberflächentemperatur ab 1970
- Mean global surface temperature anomalies (°C), 2001-2008
↑ Lower Troposhphere Global Temperature: 1979-2008
![]()
![]()
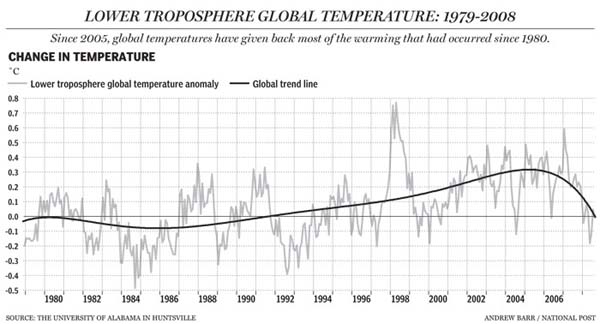
-
Watts Up With That? (Antony Watts)
2008-10-20 en National Post: Thirty years of warmer temperatures go poof
-
National Post
2008-10-20 en Lorne Gunter: Thirty years of warmer temperatures go poof
↑ Oberflächentemperatur ab 1970
↑ Mean global surface temperature anomalies (°C), 2001-2008
![]()

- de Nachdem schon 1975 bei einer Abkühlung eine Klimakatastrohpe vorausgesagt wurde, kann nun angenommen werden, dass nach einigen Jahren Katastrophenalarm mit der Erwärmung von gewissen Kreisen nun Angst vor einer neuen Abkühlung gemacht wird, immer natürlich "vom Mensch verursacht".
-
en
Al Gore says global warming is a planetary emergency. It is difficult
to see how this can be so when record low temperatures are
being set all over the world. In 2007, hundreds of people died,
not from global warming, but from cold weather hazards.
Since the mid-19th century, the mean global temperature has increased by 0.7 degrees Celsius. This slight warming is not unusual, and lies well within the range of natural variation. Carbon dioxide continues to build in the atmosphere, but the mean planetary temperature hasn't increased significantly for nearly nine years. Antarctica is getting colder. Neither the intensity nor the frequency of hurricanes has increased. The 2007 season was the third-quietest since 1966. In 2006 not a single hurricane made landfall in the U.S.
South America this year experienced one of its coldest winters in decades...
Unexpected bitter cold swept the entire Southern Hemisphere ...
Last January, $1.42 billion worth of California produce was lost ...
In April, a killing freeze destroyed 95 percent of South Carolina's ...
Recent weeks have seen the return of unusually cold conditions ...
Extreme cold weather is occurring worldwide ...
- fr Dès lors, il est naturel d'extrapoler les courbes de températures suivant la même tendance après l'année 2000. Comme on le voir sur leur courbe comme une série de traits verticaux (indiquant les marges d'erreur), cette étude nous indique que la planète va connaître une période de refroidissement succédant à la période de réchauffement que nous avons connue de puis 1975. A noter que cette étude a été réalisée avec le support de l'US National Research Council lors d'un stage aux Etats Unis. Connaissant les tendances de cette agence, ils n'ont pas dus être très contents des résultats!
- Wasserplanet de Klimänderung heute
-
Christopher Monckton of Brenchley
APS Physics en Climate Sensitivity Reconsidered
-
AOL Video en
1975 (!) - Global Cooling: The Coming Ice Age
-
Global warming quiz by Dr. Richard Keen, University of Colorado, Boulder
Skyfal fr QCM sur le réchauffement climatique
en Global warming quiz (Flash player)
en Global warming quiz (Powerpoint presentation ppt, 4,2MB)
- Pensée unique fr Préparons nous au refroidissement!
↑
Temperaturen und CO2 1997-2008
en
Temperatures and CO2 1997-2008
fr
Températures et CO2 1997-2008
- de Die Temperaturen steigen nicht - Tendenz leicht fallend.
- en The temperatures don't rise - tendancy to fall.
- fr Les températures ne montent pas - tendance plutôt baisse.
![]()
![]()

- de Die CO2-Konzentration der Atmosphäre steigt - Tendenz weiter steigend.
- en The CO2 concentration of the atmosphere rises - tendancy to continue to rise.
- fr La concentration du CO2 dans l'atmosphère monte - tendance de continuer à monter.

-
Watts Up With That? (Anthony Watts)
2008-06-20 en Warming On 11 Year Hiatus
↑
Land- und Ozean Oberflächen Temperaturen 2008-04
en
Surface Land- and Ocean Temperatures 2008-04
fr
Températures des surfaces de la terre et des océans 2008-04

-
Watts Up With That? (Antony Watts)
en Temperature Stock Report
↑
Satellitenmessungen 2008-05
en
Satellite measurements 2008-0
fr
Mesurages par satellites 2008-05

-
de
Seit dem Peak im Jänner 2007 ist die "Globaltemperatur"
um 0,774°C zurückgegangen.
Somit war der Mai 2008 global betrachtet der
unterdurchschnittlichste Monat seit dem Jänner 2000
und der kälteste Mai seit 1993.
Nach den Rekordschneemengen auf der Nordhalbkugel des letzten Winters, zeigen sich die unterdurchschnittlichen Temperaturen insbesondere auf der Südhalbkugel und in den Tropen. Nebenbei erwähnt haben wir derzeit in der Antarktis auch neue Rekordmengen an Meereis.
Die Globale Erwärmung setzt ihren Winterschlaf also unbeirrt fort- wenn man es genau betrachtet, hat es in den letzten zehn Jahren keine "globale Erwärmung" gegeben (eigentlich gab es in den letzten 30 Jahren keine "globale Erwärmung", aber das ist eine andere Geschichte).
- Öekologismus de Zieht Euch warrrm an!
-
en
Confirming what many of us have already noted from the
anecdotal evidence coming in of a much cooler than normal May,
such as late spring snows as far south as Arizona, extended
skiing in Colorado, and delays in snow cover melting,
the University of Alabama, Huntsville (UAH) published their
satellite derived Advanced Microwave Sounder Unit data set
of the Lower Troposphere for May 2008.
It is significantly colder globally, colder even than the significant drop to -0.046°C seen in January 2008.
The global ?T from April to May 2008 was -.195°C
-
Watts Up With That? (Antony Watts)
en UAH: Global Temperature Dives in May
-
fr
Le refroidissement très net, amorcé en janvier 2008 se poursuit.
Le mois de Mai 2008 bat des records de froid
Tout d'abord faisons le point sur les relevés de température moyenne du globe donnés par le RSS (Remote Sensing System; satellites, la plus fiable (avec UAH) source ici et ici ). L'abscisse est graduée en mois. Le mois de Mai 2008 a rattrapé toute la baisse observée en Janvier, février et mars de cette année. Suivant les données de l'UAH l'anomalie est de -0,17°C. C'est la température la plus froide depuis Janvier 2007 et c'est la troisième plus froide température depuis Septembre 1993....
-
Pensée unique (Jean Martin)
fr Préparons nous au refroidissement!
↑ Klimawandel seit 1988 in Deutschland
Faszit (auch in Deutschland):
- Als Ergebnis der hier gezeigten Gegenüberstellungen muss gefolgert werden, dass die Erhöhung der bodennahen Temperatur ab 1989, also der sogenannte Klimawandel der Neuzeit, ein natürlicher klimatischer Effekt war, der durch eine besondere Sonnenaktivität und nicht durch den Menschen verursacht wurde.

-
Dr. Horst Borchert/schmanck.de
2008-02-18 de Klimawandel und Sonnenaktivität
↑ en Global cooling decade 2001-2008
- Since late 2001, the trend of global surface temperatures has been downward. "Global warming" stopped in 1998; and, though it may resume in future years, the rate of warming is self-evidently less than that which the IPCC had expected, and is very likely to be harmless.

-
Climate Science
2008-04-08 en The trend that caught the IPCC by surprise
↑
Das CO2 steigt und Temperaturen fallen
en
CO2 is rising and the temperature are falling
fr
Le CO2 monte et les températures baissent
- a de
Das CO2 steigt und die Temperaturen
fallen
en CO2 is rising and the temperatures are falling
fr Le CO2 monte et les températures baissent - b de
Die Abkühlung zeigt den IPCC-Irrtum: Es ist nicht das
CO2!
en The cooling shows the IPCC eror: It is not the CO2!
fr Le refroisissemen montre l'erreur du GIEC: Ce n'est pas le CO2! - c de
IPCC-Report 2007: Zeigt keine Abkühlung
en IPCC-Report 2007: Does not show the cooling
fr Rapport GIEC 2007: Ne montre pas le refroidissement - d de CO2-Ausstoß erreicht Rekordwerte während die Globaltemperatur fällt
- e de
Brief an Dr. Pachauri, IPCC (2008-04-14)
en Letter to Dr. Pachauri, IPCC
| de | en | fr |
|---|---|---|
| Neuste Informationen über den Klimawandel | News on Climate Change | Nouvelles informations sur le changement climatique |
| Die Erwärmungspause | The Hiatus | La pause du réchauffement climatique |
↑
a Das CO2 steigt und die Temperaturen fallen
en
CO2 is rising and the temperatures are falling
fr
Le CO2 monte et les températures baissent
|
|
|
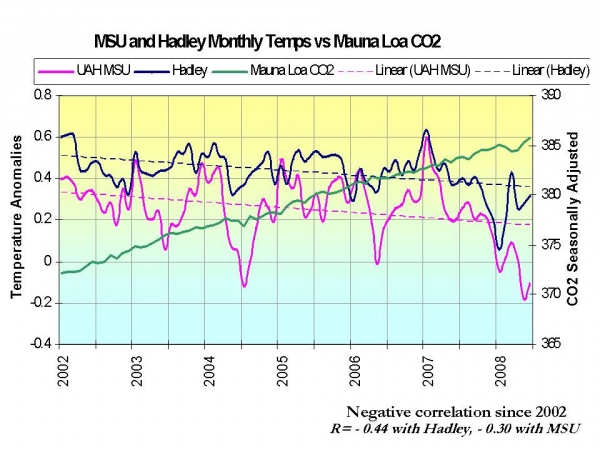
|
de Das CO₂ steigt und die Temperaturen fallen.
Wenn das CO₂ die Erwärmung erklärt,
muss es auch die Abkühlung erklären ...
oder es muss eine andere Erklärung
gefunden werden, en CO₂ is rising and the temperatures are falling.
If the CO₂ explains the warming,
it must also explain the cooling ...
or another explanation must be found fr Le CO₂ monte et les températures baissent.
Si le CO₂ explique le réchauffement,
il doit aussi expliquer le refroidissement ...
ou bien une autre explication doit être trouvée, |
|
7 years' global cooling at 2°C/century 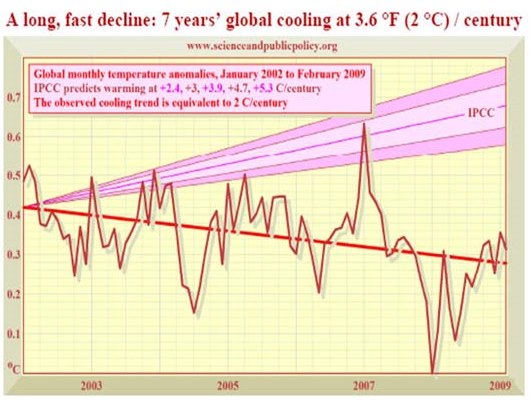
|
Who would like to bet the following outcomes on the models being correct.
|
|
de Zwei Fragen:
en Two questions:
fr Deux questions:
|
↑
b Die Abkühlung zeigt den IPCC-Irrtum: Es ist nicht das
CO2!
en
The cooling shows the IPCC eror: It is not the
CO2!
fr
Le refroisissemen montre l'erreur du GIEC:
Ce n'est pas le CO2!
![]()
![]() World Temperatures Falling Whist CO2 Keeps Rising
World Temperatures Falling Whist CO2 Keeps Rising
-
EIKE Europäisches Komitee Für Klima und Energie Jena
2009-03-17 de Was man uns nicht erzählt! Die Warnungen von Experten vor einer unmittelbar bevorstehenden Klimakatastrophe sind ausschließlich das Produkt von Computermodellen
-
Research Review / Hans Labohm
2009-03 en
What we are not being told
-
CO2 Science COM
2008-10-28 en World Temperatures Falling Whist CO2 Keeps Rising
| de | Wenn das CO2 die Erwärmung erklärt, muss es auch die Abkühlung erklären ... oder es muss eine andere Erklärung gefunden werden, dass nebeneinander liegende kalte und warme Zonen - gleichzeitig - verschiedene Ursachen haben. |
| en | If the CO2 explains the warming, it must also explain the cooling ... or another explanation must be found how neighbor cold and warm sectors may - simultaneously - obey to different causes. |
| fr | Si le CO2 explique le réchauffement, il doit aussi expliquer le refroidissement ... ou bien une autre explication doit être trouvée, signifiant alors que des secteurs voisins, chauds et froids, peuvent - simultanément - obéir à des causes différentes. |
|
Marcel Leroux *1938-08-27 †2008-08-12 |
Professeur de climatologie PhD, Professor Emeritus of Climatology, University Jean Moulin of Lyon, France; former director of Laboratory of Climatology, Risks and Environment, CNRS ▶Marcel Leroux: Who is who (Skeptiker) ▶Marcel Leroux: Video (Präsentationen) ▶Marcel Leroux: Sites web (français) ▶Marcel Leroux: Wikipedia (Opfer von Wikipedia) |
![]()
![]() Temperature: HadCRUT3 (negative→positiv→negative),
CO2: Mauna Loa (positive)
Temperature: HadCRUT3 (negative→positiv→negative),
CO2: Mauna Loa (positive)
1939-2008

![]()
-
Global warming quiz by Dr. Richard Keen, University of Colorado, Boulder
Skyfall fr QCM sur le réchauffement climatique
↑
c IPCC-Report 2007: Zeigt keine Abkühlung
en
IPCC-Report 2007: Does not show the cooling
fr
Rapport GIEC 2007: Ne montre pas le refroidissement
-
de
Temperaturkurven - CRU 2007:
Die Abkühlung nach 2000 wird auf den Kurven des IPCC nicht gezeigt!
en Temperatures - CRU 2007:
The Cooling after 2000 is not showed on the IPCC diagrams!
fr Températures - CRU 2007:
Le refroidissement après 2000 n'est pas montré sur les diagrammes du GIEC!
-
de
Deutliche Abkühlung nach 2000.
Diese Abkühlung kann mit dem CO2-Treibhauseffekt nicht erklärt werden.
en Visible cooling after 2000.
This cooling cannot be caused by the CO2 Greenhouse Effect.
fr Refroidissement apparente après 2000.
Ce refroidissement ne peut pas être expliqué avec l'effet de serre.
Quelle: / Source:
-
CRU - Climate Research Unit
UEA - School of Environmental Sciences University of East Anglia
en Home
en Temperature
en Global Temperature Record
-
de
Deutliche Abkühlung nach 2000.
-
de
IPCC Bericht 2007 zeigt keine Abkühlung nach 2000
en IPCC Report 2007 doesn't show the cooling after 2000
fr Rapport 2007 du GIEC ne montre pas le refroidissement après 2000

-
de
Temperaturkurven - IPCC Rapport 2007:
Abkühlung nach 2000 wird nicht gezeigt!
Das IPCC kann diese Abkühlung nicht erklären.
Das IPCC irrt sich mit seiner Politik.
en Temperatures - IPCC Report 2007:
Cooling after 2000 is not showed!
IPCC cannot explain this cooling.
IPCC has to change his policy.
fr Températures - rapport GIEC 2007:
Le refroidissement après 2000 n'est pas montré!
Le GIEC n'a pas d'explication pour ce refroidissement.
Le GIEC doit modifier sa politique.
-
de
Temperaturkurven - IPCC Rapport 2007:
-
de
IPCC Temperatur Prognosen
en IPCC Temperature Prognnostics
fr Prévisions des températures du GIEC


- Source: IPCC/WG 1 Fig. 10.4
-
de
Die Prognosen sind nicht realistisch
Falsche Prognosen - Falsche Politik
en The prognostics are not realistic
Wrong prognostics - Wrong Politics
fr Le prognostiques ne sont pas réalistes
Fausses prognostiques - fausses politiques
↑ d CO2-Ausstoß erreicht Rekordwerte während die Globaltemperatur fällt
|
|
|
↑
e Brief an Dr. Pachauri, IPCC (2008-04-14)
en Letter to Dr. Pachauri, IPCC
fr Lettre adressée à Dr. Pachauri, GIEC
Dear Dr. Pachauri and others associated with IPCC
We are writing to you and others associated with the IPCC position
- that man's CO2 is a driver of global warming and climate change
- to ask that you now in view of the evidence retract support from the current IPCC position
and admit that there is no observational evidence in measured data going back 22,000 years or even millions of years that CO2 levels
(whether from man or nature) have driven or are driving world temperatures
or climate change.
...
|
|
|
|
|
de Das CO₂ steigt und die Temperaturen fallen.
Wenn das CO₂ die Erwärmung erklärt,
muss es auch die Abkühlung erklären ...
oder es muss eine andere Erklärung
gefunden werden, en CO₂ is rising and the temperatures are falling.
If the CO₂ explains the warming,
it must also explain the cooling ...
or another explanation must be found fr Le CO₂ monte et les températures baissent.
Si le CO₂ explique le réchauffement,
il doit aussi expliquer le refroidissement ...
ou bien une autre explication doit être trouvée, |
de Wissenschaftler fordern IPCC zu Kurswechsel auf
-
In einem offenen Brief fordern Wissenschaftler und ein Friedensnobelpreisträger den Vorsitzenden des IPCC auf, die aktuellen Meßergebnisse zu akzeptieren, die auf eine Abkühlung während der letzten 10 Jahre hindeuten, oder aber Belege vorzulegen für die immer noch vom IPCC und anderen Vertretern der Treibhaushypothese vertretene Ansicht, es gebe eine Erwärmung und diese stehe mit dem CO2-Anteil der Atmosphäre in ursächlichem Zusammenhang.
Der Brief enthält auch Verweise auf öffentlich zugängliches Datenmaterial, das der CO2-Treibhaushypothese widerspricht.
en UN asked to admit climate change errors
- A group of four scientists has sent a letter to the UN's IPCC.
-
The Climate Scam
2008-04-14 de / en Wissenschaftler fordern IPCC zu Kurswechsel auf
-
The Climate Scam
2008-04-14 en UN asked to admit climate change errors
-
I love my carbondioxide
2008-04-14 en
Dear Dr. Pachauri and others associated with IPCC
↑ Ist auch der Trend des stetig steigenden CO2 am Ende?
Aussagen:
- Es scheint, daß in den nächsten Jahren dieser Wendepunkt erreicht sein wird.
- Als Konsequenz meiner Analyse haben wir einen weiteren CO2 Wendepunkt vor uns, der 4. große seit 200 Jahren.
- Das paßt hervorragend zur Meldung des Alfred-Wenger-Instituts (AWI), daß die Ozeane wieder beginnen kühler zu werden.
- Werden wir jetzt Zeugen einer Trendumkehr: erst beginnt die Temperatur zu fallen, dann der Methananstieg; dann die CO2 Konzentration? Wir dürfen gespannt bleiben.

-
EIKE Europäisches Institut für Klima und Energie
2008-04-21 de Ist auch der Trend des stetig steigenden CO2 am Ende?
-
Ernst-Georg Beck
2008-04 de CO2 2008 - Anzeichen für einen Wendepunkt! (Word-doc)
-
Alfred-Wenger-Institut (AWI)
2008-04-21 de Die Tiefsee der Antarktis wird kälter
- earthobservatory.nasa.gov en Antarctic Temperature Trend 1982-2004
↑ Der Juli 2004 war im globalen Durchschnitt der kälteste Juli seit 12 Jahren
Aussage von John Christy: "Dies war der kälteste Juli seit 1992 als der Ausbruch des Pinatubo die Erdatmosphäre durch seine Staubwolken abkühlte"
- climate.uah.edu: Treibhausgas-Emissionen
⇧
I Zukunft
en Climate in the future
fr Climat dans le futur
Mit folgenden Links wird von anderen Webseiten auf diese Seite verwiesen:
| de | en | fr |
|---|---|---|
|
Klima Geschichte Klima in der Zukunft |
Climate History Climate in the future |
Histoire du climat Climat dans le futur |
⇧ de Verzeichnis en Contents fr Sommaire
- Ia de
Eine neue Kälteperiode hat begonnen
en A new cold climate has begun
fr Le temps se mettra au froid - Ib de
Voraussagen
en Predictions
fr Prévisions - Ic de
Forschungsergebnisse und Hypothesen
en Research and Hypotheses
fr Recherches et hypothèses
![]()
![]() What's going on in the future?
What's going on in the future?
350 years ago we experienced the Little Ice Age (LIA).
Rivers throughout Europe froze, the Baltic Sea froze during
several months and harvests were bad.
Heaven forbid!
No sunspots were to be seen at any time.
Today we have not observed any sunspots
since December 2006
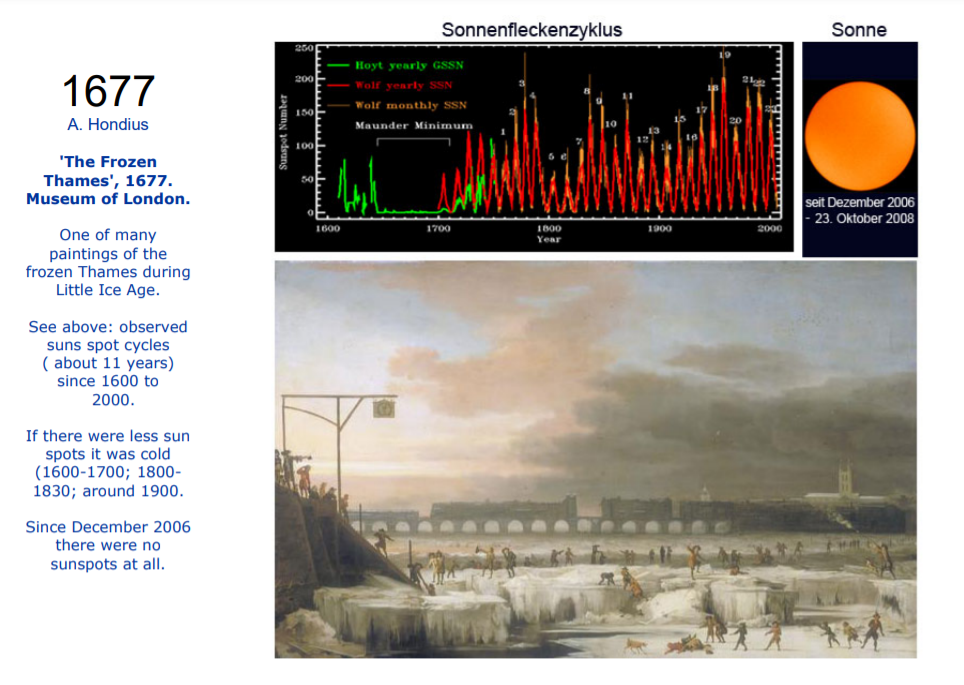
↑
Ia Eine neue Kälteperiode hat begonnen
en A new cold climate has begun
fr Le temps se mettra au froid
![]()

![]()
-
en Die Periode der Globalen Erwärmung ist beendet - eine neue Kälteperiode hat begonnen
-
en Global Warming has ended - The Next Climate Change to a pronounced Cold Era has begun
It is time that the world community acknowledges that the Earth has begun its next climate change.
The Space and Science Research Center (SSRC), today declares that the world's climate warming of the past decades has now come to an end.
A new climate era has already started that is bringing predominantly colder global temperatures for many years into the future.
In some years this new climate will create dangerously cold weather with significant ill-effects world wide.
Global warming is over - a new cold climate has begun.
- fr Le réchauffement climatique est terminé - Le temps se mettra au froid
-
Space and Science Research Center - Press Releases
2008-07-01 en Global Warming Has Ended - The Next Climate Change to A Pronounced Cold Era Has Begun
-
Watts Up With That? (Antony Watts)
2008-07-12 en Global Warming Out, Global Cooling In
-
CFP Canada Free Presss/Dr. Tim Ball
2008-07-22 en Gore getting desperate proof public cooling on GW hoax
- Pensée unique (Jean Martin) fr Préparons nous au refroidissement!
-
Skyfall / Changement Climatique
2007-06-03 fr Le refroidissement global est en cours !
↑
Ib Voraussagen
en Predictions
fr Prévisions
- de
Kälte bis mindestens 2040
en Cold until at least 2040
fr Froid jusqu'à au moins 2040 - en Coldest Weather in 100 Years to Strike by 2012
| de | en | fr |
|---|---|---|
|
Neue Kälteperiode Kaltzeit |
New Cold Period Cold Period |
Nouvelle periode froide Periode froide |
| Voraussagen | Predictions | Prédictions |
| Kälte: Warnungen | Cooling: Warnings | Refroidissement: Avertissements |
| Erwärmung: Entwarnung | Warming: All-Clear | Réchauffement: Fin de l'alerte |
| Eiszeiten | Ice Ages | Glaciations |
↑
Kälte bis mindestens 2040
en Cold until at least 2040
fr Froid jusqu'à au moins 2040
![]()
![]()

-
What's Up With That?
2008-12-29 en Don Easterbrook's AGU paper on potential global cooling
PDO = Pacific Decadal Oscillation
AGU = American Geophysical Union
UPDATE! Professor Easterbrook adds in comments:
"The projected warming from ~2040 to ~2070 is NOT driven by CO2, it's merely a continuation of warm/cool cycles over the past 500 years, long before man-made CO2 could have been a factor.
We've been warming up from the Little Ice Age at rate of about 1 degree or so per century and the 2040-70 projection is simply a continuation of non-AGW cycles.
An interesting question is the similarity between what we are seeing now with sun spots and global temperature and the drop into the Little Ice Age from the Medieval Warm Period.
Could we be about to repeat that? - Only time will tell
We might see a more pronounced cool period like the 1880 to 1910 cool cycle (when many temp records were set) or a milder cooling like the 1945-1977 cool cycle.
In any case, the setting up of the cool phase of the PDO seems to suggest cooler times ahead, not the catastrophic warming predicted by IPCC and Al Gore."
-
Watts Up With That?
2008-04-29 en More on the PDO shift cited by NASA
←
en
Coldest Weather in 100 Years to Strike by 2012
Warning to the American people and their leadership in Washington
en SSRC - Space & Science Research, Orlando, Florida:
-
According to Center Director John Casey, "The climate change predictions which I started to pass out to our government and media in early 2007 based upon the 'RC Theory' have now come to pass, exactly as forecast.
Global warming has ended, conclusively, as predicted.
The Earth's average temperature has begun its steep decline within the time frame I said it would. And last but not least, the Sun has entered a state of 'hibernation' when I said it would.
This new solar period is one of the most amazing events in the history of science.
During solar hibernations, the Sun makes significant reductions in output which always, always, brings long cold climates to the Earth.
Unbelievably, this historic phenomena is still largely and intentionally unreported by the media and our leaders and therefore unknown by the American people. The new cold climate will usher in global travail that will be amplified specifically because of the catastrophic climate change policies of the administration of President Barack Obama that will leave most citizens unprepared."
-
My most recent calculations, just completed, indicate that global temperatures approaching 100 year cold weather records will begin to set in any year now but certainly between 2012 and 2017.
The lower troposphere temperature anomaly range during this time frame will be between -0.2C and -0.75C.
-
Further, between 2020 and 2025, if not before, we will begin to see 200 year cold temperature records routinely being broken with a temperature anomaly range between -0.75C and -1.20C.
-
The coldest and most destructive years will be during the decade of the 2030's with temperature ranges between -1.0C and -1.5C.
These global temperature changes are keyed to the mean global temperature for the past one hundred years and while they may not seem like much, they translate to potentially massive agricultural losses world wide especially in the decades of the 2020's and 2030s.
-
... This implies some of the worst cold could arrive well before the predicted coldest years (i.e., the 2020's and later).
... These early cold shocks will cause significant crop damage and then rebound to relative warmth within a year or two before diving once again even deeper into the cold era.
We will of course continue to see hot, possibly record setting summer temperatures over the years.
The noticeable change will be in winters that start sooner, are much colder and last longer, with the power to cause post-planting spring crop damage and early fall pre-harvest crop losses.
Release of this detailed sequence of climate activity still includes the previous assertion that the pronounced cold of the next climate change will have devastating consequences for our primary wheat, corn, and other grain crops in Canada, and the United States.
-
CFP Canada Free Press / SSRC Space & Science Research, Orlando, Florida
2009-06-17 en Coldest Weather in 100 Years to Strike by 2012
(Space and Science Research Center (SSRC) is the leading science and engineering research company internationally, that specializes in the analysis of and planning for climate changes based upon the "Theory of Relational Cycles of Solar Activity," also called the RC Theory.)
... continuation:
-
The last solar hibernation the Earth experienced was the so-called Dalton Minimum. Canada and the United States were at that time (1793-1830) still largely unsurveyed, undeveloped, and uncultivated and the great wheat and corn growing states and horizon-to-horizon agricultural regions we take for granted today that feed the world, simply did not exist. However, even crops back then were wiped out in New England, many people died, and thousands moved out to get away from the bitter cold that settled in along the Great Lakes and in the northeastern states. Pennsylvania, for example had ice on lakes and rivers in July. Historian John D. Post said of this period that it was " ... the last great subsistence crisis." Of course, this new forecast does not include any major volcanic activity as happened during the Dalton Minimum which would accentuate the solar hibernation cold weather effects already in place."
-
Unfortunately, while the cold climate advances quickly and the Sun cuts back on output, the Obama administration continues its political campaign to stop global warming, a climate period that has already ended.
Our government has willfully not told the American people about the now unstoppable solar hibernation which continues to deepen with each passing month.
This is without a doubt one of the darkest periods in US history for freedom of speech and integrity in the scientific community.
In addition, this administration is planning to add $646 billion in new taxes to combat CO2 and other industrial greenhouse gas effects that have at most only a minor role in climate change.
All the while, the US government is not devoting one penny in preparing our country for the rapidly approaching cold weather and attendant crop failures.
There is now little doubt that this new cold climate era, in conjunction with the disastrous climate change policies of President Obama, has set the stage for what has the potential to be the worst subsistence crisis in recorded human history."
-
As to why the general public should take such unusual and dramatic forecasts seriously, Casey responded, "First of all, the SSRC and I have been sending out this vital message of a coming cold climate era consistently for over two years. In addition, a former Chairman of the House of Representatives Science Committee says I should be taken seriously as have other top scientists around the world who have come to the same conclusion about the next cold climate period. World leaders are growing more skeptical of what they have been force fed about climate change. The President of the European Union Vaclav Klaus has said the CO2 induced man made climate concept is a "bad ... valueless theory." Also, the Space and Science Research Center is now the most quoted reference on the web regarding climate change to the next cold era. But even if we did not have this support, what I and the SSRC have already accomplished should say something about the credibility of the SSRC. We have been the only independent science research organization in America to correctly and publicly predict in advance, three of the most important climate change events in history; the end of global warming, the Sun going into 'hibernation' and the long term decline in the Earth's temperatures. This contrasts with our government's science agencies and the United Nations all of whom have completely missed or otherwise keep quiet about these events.
-
The bottom line is this: I believe these new predictions will be just as accurate as our previous announcements and given their nature, I urge everyone to give them genuine and immediate consideration. The SSRC and I, along with other scientists world wide have been doing our best using every venue to spread the word about getting prepared for the next climate change. What is different about this press release is that the schedule for the rough times ahead is now clearer, the first crop damaging cold will arrive earlier than thought, and thanks to the UN and the Obama administration, it will catch most people on this planet totally off guard. Therefore, the people deserve repeated updates and when possible, long range climate warnings such as this."
de Klima- Katastrophenpause
-
Seit Erschaffung der Erde macht das Wetter was es will.
Und was es vor hat, lässt sich nicht errechnen, nur vermuten.
Als das IFM-Geomar mit einer Pressemitteilung vom 2. Mai 2008 zugeben musste, dass "die globale Erwärmung eine kurze Atempause" einlege, war das ein erstes Eingeständnis der unsinnigen Behauptung, "menschengemachtes" Kohlendioxid (CO2) würde die Erde in ein Treibhaus, in eine lebensfeindliche Gluthölle verwandeln.
Angeblich hätten die Computer errechnet, dass eine Erwärmung der Erde in den nächsten zehn Jahren nicht stattfindet. Dahinter steht die Drohung: Wenn ihr Menschen uns nicht gehorcht und die Verbrennung fossiler Energieträger nicht einstellt, wird die Erdtemperatur nach zehn Jahren erneut in die Höhe schießen. Die alte Zigeunerin oder der geübte Kaffeesatzleser können mit Sicherheit bessere Prognosen erstellen als das IPCC (Intergovernmental Panel on Climate Change) und seine Sprachrohre, die der echten Wissenschaft schon längst den Rücken gekehrt haben.
Die Erde hat in den vergangenen Jahrzehnten eine erfreuliche Warmzeit erlebt, wie sie sich in der Geschichte unzählige Male wiederholte. Leider scheinen wir nun den Zenit überschritten zu haben, denn seit zehn Jahren wurde es nicht mehr wärmer. Der wachsende Eisschild über der Antarktis und die Abkühlung des antarktischen Meerwassers weisen unmissverständlich darauf hin, dass es mit der Temperatur auf der Erde abwärts geht. Die milden Winter in Europa der vergangenen Jahre waren ein Glücksfall und nicht etwa ein Zeichen dafür, dass die Erde verglüht.
Angesichts sinkender Temperaturen fordern die Väter des "Manifest von Heiligenroth" die Politiker auf, die ideologische Zwangsjacke um die Energieversorgung zu beseitigen und zur Realität zurück zu kehren. Sonst droht Deutschland eine katastrophale Energiekrise. Ohne auch nur den Anschein von Verantwortungsbewusstsein haben die Politiker genau das Gegenteil dessen getan, was getan werden muß, nämlich die Menschen auf eine Kaltzeit vorzubereiten.
Die "erneuerbaren" allein ideologisch motivierten, hochsubventionierten Energien sind nicht in der Lage, einen nennenswerten Anteil der Energieversorgung zu übernehmen. Wird es kälter, können nur Kernenergie und Kohle dafür sorgen, dass die Lichter in Deutschland nicht ausgehen.
-
EIKE Europäisches Institut für Klima und Energie
2008-04-21 de Klima- Katastrophenpause
en Global warming may 'stop'
-
en
Researchers studying long-term changes in sea temperatures
said they now expect a "lull" for up to a decade while natural
ariations in climate cancel out the increases caused by
man-made greenhouse gas emissions.
The average temperature of the sea around Europe and North America is expected to cool slightly over the decade while the tropical Pacific remains unchanged.
This would mean that the 0.3°C global average temperature rise which has been predicted for the next decade by the UN's Intergovernmental Panel on Climate Change may not happen, according to the paper published in the scientific journal Nature.
Comments:- I do not believe in Global Warming. I have kept data for 15 years and the mean temperature for 2007 was the lowest for 10 years. Scientists jumped on the band wagon only to receive grant money. Because 2007 was cooler they have now call global warming as climate change. I think the changes are a natural happening.
-
It seems very coincidental that as soon as we have a year
when global temperatures drop more than any other year on
record global warming supporting scientists come up with a
reason why it is "temporarily" getting cooler, but the theory
of CO2 caused global warming still holds.
These scientists would have had more credibility if they forecasted the actually cooling temperatures a few years ago, instead of saying a year ago, as many did, this year would be the hottest on record. It looks like the temperature data disconfirmed their hypothesis of CO2 induced warming and rather than question their theory they invented a way to try to convince people their theory still holds even though the data no longer support it.
More on target are the scientists who subscribe to the theory that solar activity strongly affects climate change - they have been predicting an end to the warming phase and the onset of a cooling climate for some time now.
-
telegraph.co.uk
2008-04-30 en Global warming may 'stop', scientists predict
en Predicting 21st Century Global Warming with the 1,500-year Climate Cycle
-
Dennis T. Avery
2009-03-08/10 en
Predicting 21st Century Global Warming with the 1,500-year Climate Cycle
fr Préparons nous au refroidissement!
-
Pensée unique fr
Préparons nous au refroidissement!
↑
Ic Forschungsergebnisse und Hypothesen
en Research results and Hypotheses
fr Résultat des recherches et hypothèses
- a de
100 Jahre Kälte - Ein neues Maunder Minimum
en Sun may be headed for a Maunder minimum
fr Un nouveau Minimum de Maunder - b de
Zweihundertjährige Abnahme der Solarstrahlung führt zu einer
Kleinen Eiszeit
en Bicentennial Decrease of the Total Solar Irradiance Leads to the Little Ice Age - c de
Russische Forschungsergebnisse und Hypothesen
en Russian researches and hypotheses
fr Recherches et hypothèses russes - d de
Eddy-Zyklus: 1000-Jahres-Klimazyklus
en Eddy Cycle: 1000 Year Climate Cycle
fr Cycle Eddy: Cycle climatique de 1000 ans
| de | en | fr |
|---|---|---|
|
Neue Kälteperiode Kaltzeit |
New Cold Period Cold Period |
Nouvelle periode froide Periode froide |
| Voraussagen | Predictions | Prédictions |
| Kälte: Warnungen | Cooling: Warnings | Refroidissement: Avertissements |
| Erwärmung: Entwarnung | Warming: All-Clear | Réchauffement: Fin de l'alerte |
| Eiszeiten | Ice Ages | Glaciations |
| de | en | fr |
|---|---|---|
|
Die Sonne Sonnenzyklen |
The Sun Sunspot cycles |
Le soleil Cycles solaires |
| de | en | fr |
|---|---|---|
|
Klimawandel: Wissenschaft Ozeanzyklen & Ozeanische Oszillationen |
Climate change: Science Ocean Cycles & Ocean Oscillations |
Changement climatique: Science Cycles et oscillations océaniques |
| Ozeanzyklen steuern das Klima / El Niño (der Knabe/warm) & La Niña (das Mädchen/kalt) / ENSO: El Niño-Southern Oscillation / AMO: Atlantic Multidecadal Oscillation / NAO: North Atlantic Oscillation / AO: Arctic Oscillation / IOD: Indischer Ozean Dipol / PDO: Pacific decada oscillation | ||
↑
a 100 Jahre Kälte - Ein neues Maunder Minimum
en Sun may be headed for a Maunder minimum
fr Un nouveau minimum de Maunder
Mit folgenden Links wird von anderen Webseiten auf diese Seite verwiesen:
| de | en | fr |
|---|---|---|
|
Neue Kälteperiode: Forschungsergebnisse und Hypothesen 100 Jahre Kälte - Ein neues Maunder Minimum |
New Cold Period: Research and Hypotheses Sun may be headed for a Maunder minimum |
Nouvelle periode froide: Recherches et hypothèses Un nouveau minimum de Maunder |
|
|
EIKE Russische Wissenschaftler haben das zyklische Verhalten der Sonne analysiert und sie sagen nun 100 Jahre Abkühlung voraus. Die Wissenschaftler sind nicht irgendwer. Quelle / Source: |
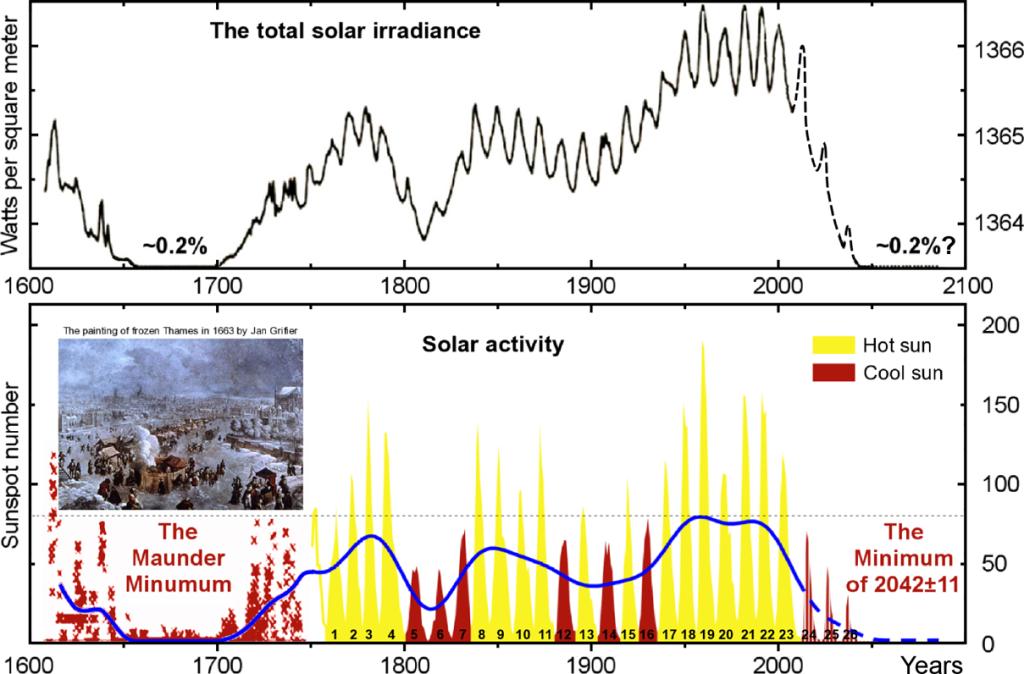
Kommentar von Raimund Leistenschneider:
Vollkommen richtig, die russischen Wissenschaftler haben den im Mittel 208-jährigen de Vries-Suess-Zyklus der Sonne sozusagen wieder entdeckt, wie er aus der Fourieranalyse der Wolfszahl ermittelt werden kann.
Dies ist der Hauptsonnenzyklus, was die Fourieranalyse bestätigt.
Er hatte in 2003 sein Maximum und verläuft damit exakt parallel zum leichten Temperaturanstieg im ausgehenden 20. Jahrhundert.
Sein Maximum in 2003 bedeutet, dass er für die nächsten 100 Jahre fällt und daher zurückgehende Temperaturen eintreten.
Wie z.B. die arktische Eisbedeckung diesem Zyluss folgt,
hat der renommierte Meeresforscher Axel Mörner beschrieben.
(Abbildung 2
![]() Keine Gefahr eines globalen Meeresspiegelanstiegs)
Keine Gefahr eines globalen Meeresspiegelanstiegs)
Anhand der Daten der United States Geological
Survey fallen nach jedem Hauptsonnenzyklus die Temperaturen deutlich.
(Abbildung 183
Teil 8: Zukünftige Temperaturentwicklung und deren Schwankungen)
Der De Vries Suess-Zyklus seinerseits wird von dem übergeordneten Hallstattzyklus (Zykluslänge ca. 2.300 Jahre) bestimmt.
Dieser steigt nach Daten des MPS (Prof. Solanki) bis ca.
2.200 an (sowohl das römische Klimaoptimum, als auch das sog.
Holozänklimaoptimum, sowie alle Temperaturzyklen im Holozän
fallen sowohl mit dem Hallstatt-Zyklus, als auch mit dem de
Vries-Suess-Zyklus zusammen
(Abb. 193-196
Teil 8: Zukünftige Temperaturentwicklung und deren Schwankungen
und Abb. 157
Teil 6: Der Einfluss der Sonne auf unser Wetter/Klima),
dann fällt auch dieser Sonnenzyklus.
Alle diese Zyklen sind, wie der Name dies ausdrückt, zyklisch und
hängen von internen Veränderungen der Sonne ab, die teilweise durch
die Planeten des Sonnensystems bestimmt werden.
(Planetenbahnen: Dr. Theodor Landscheidt)
siehe auch: Abbildung 33
Teil 3: Sonnenflecken und ihre Ursachen
EIKE / Raimund Leistenschneider:
Dynamisches Sonnensystem - Die tatsächlichen Hintergründe des Klimawandels
| Teil 1 | Die Sonne bestimmt den Temperaturgang |
| Teil 2 |
Die Sonne, der faszinierende Stern |
| Teil 3 | Sonnenflecken und ihre Ursachen |
| Teil 4a | Die Sonnenatmosphäre, Korona, Heliosphärische Stromschicht, interplanetares Magnetfeld |
| Teil 4b | Die Sonnenatmosphäre, Korona, Heliosphärische Stromschicht, interplanetares Magnetfeld |
| Teil 5 | Die variable Sonne |
| Teil 6 | Der Einfluss der Sonne auf unser Wetter/Klima |
| Teil 7 | Der Einfluss der Sonne auf die Wolkenbedeckung über Svensmark hinaus |
| Teil 8 | Zukünftige Temperaturentwicklung und deren Schwankungen |
| Raimund Leistenschneider |
Physiker
▶Raimund Leistenschneider: Who is who (Skeptiker) |
↑
b Zweihundertjährige Abnahme der Solarstrahlung führt zu einem
Ungleichgewicht des thermischen Budgets der Erde und zu einer Kleinen
Eiszeit
en Bicentennial Decrease of the Total Solar Irradiance Leads to
Unbalanced Thermal Budget of the Earth and the Little Ice Age
-
EIKE Europäisches Institut für Klima und Energie
2012-11-18 de Zweihundertjährige Abnahme der Solarstrahlung führt zu einem Ungleichgewicht des thermischen Budgets der Erde und zu einer Kleinen Eiszeit
-
Applied Physics Research
Habibullo I. Abdussamatov, Pulkovo Observatory of the RAS
2012-02-01 en Bicentennial Decrease of the Total Solar Irradiance Leads to Unbalanced Thermal Budget of the Earth and the Little Ice Age
2012-02-01 en
Bicentennial Decrease of the Total Solar Irradiance Leads to
Unbalanced Thermal Budget of the Earth and the Little Ice Age
↑
c Russische Forschungsergebnisse und Hypothesen
en Russian researches and hypotheses
fr Recherches et hypothèses russes
Chabibullo Abdussamatow
Neue Forschungsergebnisse und Hypothesen für die Zukunft
Neue Russische Forschungsergebnisse und Hypothesen für die Zukunft von Chabibullo Abdussamatow, Leiter des Laboratoriums für Weltraumforschung des Pulkovo-Observatoriums (bei St. Petersburg)
-
Die globale Klimaerwärmung, die in letzter Zeit beobachtet wird, führte der Experte nicht auf die CO2-Emissionen, sondern auf die extrem hohe Intensität der Sonnenenergie zurück, die im Laufe des 20. Jahrhunderts registriert wurde.
-
Seine Hypothese untermauerte Abdussamatow mit Analysen von Eisproben, die in einer Tiefe von mehr als 3000 Metern in der Antarktis und auf Grönland genommen wurden. "Es stellte sich heraus, dass es noch vor der Industrieepoche, bei fehlenden Industrieaktivitäten der Menschheit, beachtliche Schwankungen des CO2-Gehalts in der Atmosphäre wie auch Perioden mit einer Klimaerwärmung gab", sagte der Wissenschaftler.
-
"Dabei wurde festgestellt, dass selbst eine beachtliche Erhöhung des CO2-Gehalts in der Atmosphäre nie vor einer Klimaerwärmung eintrat, sondern immer einer Erhöhung der Temperatur auf der Erde folgte. Das heisst, dass sich selbst eine starke Anhäufung von Kohlendioxid in der Atmosphäre praktisch nicht auf den Anstieg der Temperatur auf der Erde auswirkt."
-
Die jetzt registrierte höhere Konzentration von Kohlendioxid in der Atmosphäre sei grundsätzlich eine Folge der höheren Temperatur des Weltmeeres, was seinerseits auf die höhere Aktivität der Sonne zurückgeführt werden könne, fuhr der Experte fort.
-
Abdussamatow widerlegte auch die Behauptung, dass Kohlendioxid für den so genannten Treibhauseffekt in der Atmosphäre sorge: Die CO2-Schicht lasse die Sonnenstrahlung zur Erde durch und keine Infrarotstrahlen von der Erde in den erdnahen Raum zurück. Die These, dass die Erdatmosphäre Treibhaus-Eigenschaften haben könnte, sei daher wissenschaftlich nicht fundiert.
-
Der Experte machte darauf aufmerksam, dass die oberen Schichten des Weltmeeres unerwartet für die Klimatologen jetzt eine immer niedrigere Temperatur aufweisen. Das zeuge davon, dass das globale Temperaturmaximum auf der Erde bereits seinen Höhepunkt hinter sich habe.
-
"Die Menschen sind nicht in der Lage, einen beachtlichen Beitrag zur globalen Klimaerwärmung zu leisten. Nach der Klimaerwärmung kommt unweigerlich eine Periode der Klimaabkühlung." "Die Energiemenge, die die Erde von der Sonne erhält, geht seit Mitte der 1990er Jahre konsequent zurück."
-
Laut Abdussamatows Prognose wird 2012-2015 statt der vorhergesagten globalen Erwärmung ein schrittweises Absinken der Temperaturen auf der Erde beginnen.
Ein Minimum an Sonnenenergie sei gegen 2040 zu erwarten. Darauf trete voraussichtlich 2055-2060 ein Temperaturminimum auf der Erde ein.
-
Dieser Klimawandel könnte mit dem Temperaturrückgang in den Jahren 1645 bis 1715 in ganz Europa, Nordamerika und auf Grönland verglichen werden.
Damals waren alle Kanäle in den Niederlanden zugefroren. Die Menschen hatten sich gezwungen gesehen, mehrere Siedlungen auf Grönland wegen der Vereisung zu verlassen. In London war sogar die Themse und in Paris die Seine zugefroren.
-
"Dieser Zustand dürfte etwa 50 Jahre dauern. Erst zu Beginn des 22. Jahrhunderts wird sich die Temperatur auf der Erde wieder erhöhen."
"Deshalb ist das Kyoto-Klimaschutzabkommen jetzt fehl am Platze.
Sein Inkrafttreten hätte um mindestens 100 Jahre verschoben werden müssen, weil die Erdtemperatur auch ohne Einschränkung der Treibhausgas-Emissionen durch die Industrieländer zurückgehen wird", betonte der Wissenschaftler.
-
russland.RU 2007-01-16:
de Experte aus Russland sieht Sonne als Ursache für globale Klimaerwärmung
-
Schweizmagazin.ch 2008-03-12:
de Nur noch 50 Jahre bis zur nächsten Eiszeit?
-
russland.RU 2007-01-16:
de Experte aus Russland sieht Sonne als Ursache für globale Klimaerwärmung
-
Schweizmagazin.ch 2008-03-12:
de Nur noch 50 Jahre bis zur nächsten Eiszeit?
| Khabibullo Abdusamatov |
de
Leiter des Labors für Weltraumforschungen des astronomischen
Hauptobservatoriums Pulkowo, bei Sankt Petersburg en Head of the St. Petersburg's Pulkovskaya Astronomical Observatory of the Russian Academy of Sciences ▶Khabibullo Abdusamatov: Who is who (Skeptiker) |
Russlands Wissenschaftler wollen These der anthropogenen Klimaerwärmung widerlegen
200-jährige zyklische Wandlung der Strahlungsintensität der Sonne
-
Unser Planet erlebt seit den letzten zwölf Jahren einen Mangel an Sonnenenergie, der im Durchschnitt mit der Gesamtkapazität von 18 Millionen Atomkraftwerken verglichen werden kann.
Die Sonne ist ein veränderlicher Stern, dessen Strahlungsintensität in einem 200-Jahreszyklus und immanent in einem kürzeren Elfjahreszyklus ständig wechselt.
-
Der auf die Erde kommende integrale Sonnenenergiestrom weist seit Anfang 1990er Jahre eine stetige sinkende Tendenz auf.
Während des jetzigen 23. kurzen Sonnenzyklus, der nun schon zwölf Jahre dauert, erhalte jeder Quadratmeter der oberen Schichten der Erdatmosphäre durchschnittlich um 0,16 Watt pro Quadratmeter weniger Sonnenenergie, als im vorangegangenen "kurzen" Sonnenzyklus. Das Defizit von Sonnenergie beläuft sich somit auf fünf Millionen Watt pro Quadratkilometer im Jahr.
-
Laut Prognose wird der Sonnenenergiestrom im gegenwärtigen 200-jährigen Zyklus etwa um das Jahr 2041 sein Minimum erreichen.
"Dieser Wechsel eines 200-jährigen Zyklus erfolgt zum ersten Mal für unsere Generation", sagte Abdussamatow.
Das 200-jährige Absinken der Strahlungsintensität der Sonne wird laut Abdussamatow ein weiteres globales Klimaminimum auslösen, das aufgrund der thermischen Insertion der Weltmeere mit einer Verspätung von 15 bis 20 Jahre eintreten wird.
-
Im Zeitraum von 2055 bis 2060 wird die Temperatur laut Prognose des Wissenschaftlers den niedrigsten Punkt erreichen.
Im Rahmen des Experimentes "Astrometrie" im russischen Segment der Internationalen Weltraumstation werden die Mitarbeiter des Observatoriums Pulkowo ab Anfang 2010 innerhalb von sechs Jahren zeitweilige Variationen der Form und des Durchmessers der Sonne während des nächsten Elfjahreszyklus messen, der im zweiten Halbjahr 2008 beginnt.
-
Die an dem Experiment beteiligten russischen Wissenschaftler wollen auf der Grundlage der kosmischen Sonnenbeobachtung die Theorie über die anthropogene globale Klimaerwärmung widerlegen.
Abdussamatow stimmt mit der Meinung einiger Wissenschaftler nicht überein, wonach der anthropogene Treibhauseffekt die globale Temperatur der Erde wesentlich beeinflusse.
-
Nach seiner Ansicht ist die zunehmende Konzentration von CO2 in der Atmosphäre nur die Folge und nicht die Ursache der globalen Erwärmung.
Nach Ansicht des Forschers wird die kommende Abkühlung, die durch Absinken der Sonnenaktivität bedingt ist, unter anderem zu einer wesentlichen Vergrößerung der Eis- und Schneefläche führen.
-
Laut Abdussamatow wird sich das Klima der Erde zyklisch alle 200 Jahre wandeln.
"Schuld daran ist nicht der Mensch, sondern die 200-jährige zyklische Wandlung der Strahlungsintensität unseres Gestirns namens Sonne", sagte der Wissenschaftler.
-
rian.ru/Abdussamatow
2008-06-25 de Russlands Wissenschaftler wollen These der anthropogenen Klimaerwärmung widerlegen
Neue Kältewelle wird die Erwärmung bald ersetzen
en A cold spell soon to replace global warming
fr Une nouvelle vague de froide remplacera le réchauffement climatique
-
rian.ru/Oleg Sorokhtin
2008-01-03 en A cold spell soon to replace global warming
↑
d Eddy-Zyklus: 1000-Jahres-Klimazyklus
en Eddy Cycle: 1000 Year Climate Cycle
fr Cycle Eddy: Cycle climatique de 1000 ans
- de Neue norwegische Studien
-
de
Bestätigung des natürlichen 1000-Jahres-Klimazyklus in aktueller
Atlantik-Studie
en New Study Shows A Clear Millennial Solar Impact Throughout Holocene
← Neue norwegische Studien
-
Die kalte Sonne (Fritz Vahrenholt Sebastian Lüning)
2012-03-05 de Neue norwegische Studien: Ein erheblicher Teil der Klimaerwärmung der letzten 150 Jahre ist durch die Sonne verursachtIn einer parallelen Studie untersuchte das Trio die Temperaturgeschichte der letzten 4000 Jahre im grönländischen GISS-Eiskern.
Die Forscher fanden hier einen charakteristischen Temperaturzyklus mit einer Periode von etwa 1000 Jahren.
In der Temperaturkurve aus Grönland sind deutlich zu erkennen:
-
Minoische Wärmephase (1000 v. Chr.),
-
Römische Wärmephase (Jahr 0),
-
Mittelalterliche Wärmephase (1000 n. Chr.)
-
und die Moderne Wärmephase (heute).
Dazwischen ereigneten sich jeweils Kaltzeiten, in denen die Temperatur um mehr als 1°C absank.
Die logische Fortschreibung dieses natürlichen Zyklus in die Heutezeit ergibt laut Humlum et al. (2011), dass ein großer Teil der Erwärmung des 20. Jahrhunderts auf natürliche Klimamechanismen (vermutlich vor allem die Sonne) zurückgehen muss.
-
←
Bestätigung des natürlichen 1000-Jahres-Klimazyklus in aktueller
Atlantik-Studie
en
New Study Shows A Clear Millennial Solar Impact Throughout Holocene
|
|
de ... Sie fanden, dass die Temperaturen in den vergangenen 10.000 Jahren rhythmisch um einige Grad Celsius im Takte eines deutlich erkennbaren 1000-Jahres-Zyklus schwankten. Der Vergleich mit der Sonnenaktivitätsentwicklung im gleichen Zeitraum ergab eine beeindruckende Synchronität zwischen den beiden Größen. Der solare 1000-Jahres-Zyklus ist ein Grundzyklus der schwankenden Sonnenaktivität und wurde von Abreu et al. (2010) "Eddy-Zyklus" benannt. en Wavelet transform analysis revealed a 1000-year period pacing the d18O signal over the early Holocene. This 1000-year frequency band is significantly coherent with the 1000-year frequency band of Total Solar Irradiance (TSI) between 9.5 ka and 7 ka and both signals are in phase over the rest of the studied period. |
|
de Sicher nicht ganz zufällig gehörten die letzten Jahrzehnte zu den solar aktivsten Zeiten der vergangenen 10.000 Jahre. |
en It is not a mere coincidence that the last decades have been the most solar active of the last 10,000 years. |
|
de Die derzeit vom Weltklimarat verwendeten Klimamodelle können diese Millenniums-Zyklen nicht reproduzieren, da sie der Sonne nur eine sehr geringe Klimawirksamkeit zubilligen.
Auch das kürzlich vom Hamburger Max-Planck-Institut vorgestellte
neue Klimamodell unterliegt dieser Fehleinschätzung, so dass die
Modellierungsergebnisse zwangsläufig unrealistisch werden |
en The climate models used by the IPCC are not able to reproduce these millennial cycles because they assign only a very small climate impact to the sun. Also the recently introduced new climate model from the Max Planck Institute in Hamburg suffers from the same deficiency, and thus the results of that model are essentially unrealistic. |

-
Die kalte Sonne (Fritz Vahrenholt Sebastian Lüning)
2012-03-02 de Bestätigung des natürlichen 1000-Jahres-Klimazyklus in aktueller Atlantik-StudieDie vom Weltklimarat weitgehend ignorierten natürlichen Klimaschwankungen haben sich mit einem lauten Trompetenstoß wieder in Erinnerung gerufen.
Ein Forscherteam aus den USA, Frankreich und den Niederlanden veröffentlichte jetzt in der angesehenen und begutachteten Fachzeitschrift Paleoceanography Ergebnisse zu einem Bohrkern, den sie vor der Küste von Cape Hatteras in North Carolina in einer Wassertiefe von 620 m aus dem Meeresboden zogen.
Der untersuchte geologische Schichtenstapel wurde während der letzten 10.000 Jahre abgelagert.
Anhand von Isotopenstudien an Schalen von Einzellern (sogenannten Foraminiferen) konnten die Wissenschaftler um Caroline Cléroux vom Lamont-Doherty Earth Observatory der Columbia University in Palisades, New York, die Temperaturgeschichte vor Cape Hatteras detailliert rekonstruieren.
Bereits vor etlichen Jahren wies der Heidelberger Geowissenschaftler Augusto Mangini auf die Bedeutung des 1000-Jahreszyklus für die Diskussion des aktuellen Klimawandels hin.
-
Watts Up With That? (Antony Watts)
2012-03-04 en New Study Shows A Clear Millennial Solar Impact Throughout HoloceneDr. Sebastian Lüning writes at the Die kalte Sonne site:
The new findings once again clearly underscore that the last several thousands of years are characterized by natural temperature cycles that are controlled by fluctuations in solar activity (see p. 68-75 in 'Die kalte Sonne').
The logical continuation of these natural cycles through today shows that an important part of the warming of the last 150 years has to be attributed to the increase in solar activity.
Quelle / Source:
-
Paleoceanography
2012-02-09 en High-resolution sea surface reconstructions off Cape Hatteras over the last 10 ka
| de | en | fr |
|---|---|---|
|
Die Sonne Sonnenzyklen |
The Sun Sunspot cycles |
Le soleil Cycles solaires |
⇧
27 Klima-Zyklen und ihre Extrapolation in die Zukunft
en
Climate cycles and their extrapolation into the future
fr
Cycles climatiques et leur extrapolation dans le futur
Mit folgenden Links wird von anderen Webseiten auf diese Seite verwiesen:
| de | en | fr |
|---|---|---|
|
Klima Geschichte Klima-Zyklen und ihre Extrapolation in die Zukunft |
Climate History Climate cycles and their extrapolation into the future |
Histoire du climat Cycles climatiques et leur extrapolation dans le futur |
-
Die kalte Sonne (Fritz Vahrenholt & Sebastian Lüning)
Dr. Dietrich E.Koelle
2015-01-29 de Klima-Zyklen und ihre Extrapolation in die Zukunft
de Verzeichnis en Contents fr Sommaire
- E 0 Die 60 Jahre Ozean-Zyklus Sinus Kurve - Die Falle der Klimaalarmisten
Einleitung
Wie die Rekonstruktionen des Klimaverlaufs der Vergangenheit durch Proxy-Daten zeigt, gibt es eine Reihe von Temperatur-Zyklen, die offenbar weithin unbekannt sind, beziehungsweise von vielen Klimaforschern auch ignoriert werden.
Dazu zählen der große Klima-Zyklus von 150 bis 180 Millionen Jahren
E 1 Der komplette Abkühlungsprozess bis vor etwa 2.2 Milliarden Jahren
E 2 Der große Klima-Zyklus seit 900 Millionen Jahren
aber auch die kürzeren und für uns aktuell wahrnehmbaren Zyklen von
| E 3 |
1000 Jahren (900-1100) 230 Jahren (230-250) |
Suess-Zyklus deVries-Zyklus |
mit +/- 0,65 °C mit +/- 0,30 °C |
| E 4 |
230 Jahren (230-250) 65 Jahren (60-65) |
deVries-Zyklus Ozean-Zyklus |
mit +/- 0,30 °C mit +/- 0,25 °C |
| E 5 |
1000 Jahre Suess-Zyklus & 230Jahre deVries-Zyklus Extrapolation der 1000- und 230-Jahreszyklen über die nächsten 700 Jahre |
||
| E 6 | Schlussbemerkungen und Hinweis der Kalte-Sonne-Redaktion | ||
In dieser Analyse wird versucht, wie die Temperaturentwicklung der kommenden 700 Jahre aussehen könnte,
wenn man annimmt, dass die erwähnten Klimazyklen der Vergangenheit sich auch in der Zukunft fortsetzen.
Dies sollte nicht als eine Vorhersage der Klima-Entwicklung (miss)verstanden werden.
Bisher gibt es nur die IPCC-Vorhersage,
dass bis zum Jahr 2100 die Globaltemperatur um 2 bis 5 °C zunehmen soll, nur auf der Basis des erwarteten CO2-Anstieges.
Diese Theorie hat jedoch in den vergangenen 18 Jahren nicht funktioniert,
da die verschiedenen natürlichen Klima-Einflüsse und Zyklen nicht berücksichtigt wurden,
bzw. in Klimamodellen nicht berücksichtigt werden können.
Entscheidend für Temperatur-Entwicklung
Dies sind unter anderem
die Variation der mittleren globalen Wolkenbedeckung (und damit des Erd-Albedos)
und der daraus resultierenden effektiven solaren Insolation (Watt pro m2) am Erdboden, bzw. der Meeresoberfläche,
die entscheidend für die daraus resultierende Temperatur-Entwicklung ist.
de Text en Text fr Texte
↑ E 0
Die 60 Jahre Ozean-Zyklus Sinus Kurve - Die Falle der Klimaalarmisten
![]()
![]() Die Falle der Klimaalarmisten
Die Falle der Klimaalarmisten
de
Der 60 Jahre Ozean-Zyklus
(1885 - 2005 ... 2095)
en
The 60 Year Ocean Cycle
(Sine wave with a ;60-year frequency)
The models are out of phase with reality
The models align with a naturally occurring upswing in surface
temperatures
The modelers have failed to consider the future multidecadal
variations
in their projections caused by the natural enhancement and suppression
of global warming
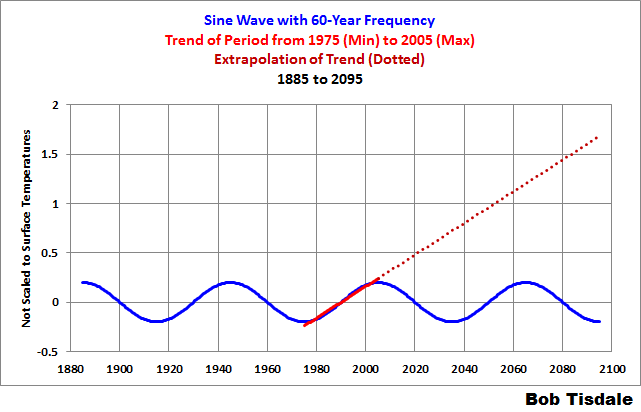
Diese Zyklen haben im Prinzip einen sinusförmigen Verlauf
Bob Tisdale hat hier auch gezeigt, wie der Temperatur-Anstieg des 65-Jahreszyklus in den Jahren 1975 bis 1998 zu der Annahme führte,
dass dies auf den parallelen Zuwachs an CO2-Emissionen zurückzuführen sei.
Das wurde dann naiv linear bis zum Jahr 2100 verlängert
und bildete die Basis der Klimamodelle
und der Erfindung der sogenannten "Klimakatastrophe".
↑ E 1
Der komplette Abkühlungsprozess bis vor etwa 2,2 Milliarden Jahre
![]()
![]() Der komplette Abkühlungsprozess der Erde dauerte ca.
3 Milliarden Jahre
Der komplette Abkühlungsprozess der Erde dauerte ca.
3 Milliarden Jahre

Der absolute Tiefpunkt der Abkühlung wurde vor etwa 2.200 Millionen Jahren erreicht.
Seither geht es durch die zunehmende Energieabstrahlung der Sonne langsam, aber stetig aufwärts, wie in Bild 1 dargestellt.
Dies bedeutet für die Zukunft weniger tiefe Temperaturen bei den großen Eiszeiten, andererseits aber auch höhere Temperaturen bei den Warmzeiten.
Es gibt also tatsächlich eine "globale Erwärmung", aber das im Milliarden-Jahre-Maßstab.
-
Die kalte Sonne (Fritz Vahrenholt & Sebastian Lüning)
Dr. Dietrich E.Koelle
2014-12-27 de Klimazyklen
↑ E 2
![]()
![]() Der große Klima-Zyklus mit einer Periode von 150 bis 180
Millionen Jahren
Der große Klima-Zyklus mit einer Periode von 150 bis 180
Millionen Jahren
Die Eiszeiten waren so charakteristisch, dass sie jeweils eigene Namen
erhielten.
Alle etwa 200 Millionen Jahre
In der Vergangenheit dauerten etwa alle 200 Millionen Jahre
Warmzeiten
die Warmzeiten jeweils 30 bis 50 Millionen Jahre
Jede Warmperiode führte zu einer weiteren Entwicklungs-Stufe des Lebens auf der Erde.
Eiszeiten
Dazwischen lagen schwere und lange Eiszeiten von jeweils 50 bis 100 Millionen Jahren Dauer
mit Temperaturen unter 12°C.
-
Die kalte Sonne (Fritz Vahrenholt & Sebastian Lüning)
Dr. Dietrich E. Koelle
2015-01-01 de Der große Klima-Zyklus: Wir leben in einer tiefen Kaltzeitphase - und niemand merkt es
↑ E 3
Globaltemperatur der letzten 3200 Jahre
Mit folgendem Link wird von anderen Webseiten auf diese Seite verwiesen.
▶Globaltemperatur der letzten 3200 Jahre
|
|
1000-Jahre: Suess-Zyklus |
| 230-Jahre: deVries-Zyklus |

Zunächst sind in diesem Bild
der 1000-Jahreszyklus
und der 230-Jahreszyklus dargestellt,
wie er durch die historischen Proxy-Daten rekonstruiert werden konnte.
Es handelt sich um eine Kombination der Ergebnisse der verschiedenen Veröffentlichungen in den letzten Jahren auf dem Gebiet der Paläo-Klimatologie.
Das Diagramm der letzten 3200 Jahre zeigt deutlich
einen 1000-Jahreszyklus, der für die letzten 2000 Jahre auch durch historische Dokumente belegt ist.
Tatsächlich gibt es diesen Zyklus schon seit dem Ende der letzten Eiszeit, d.h. seit 9000 Jahren, auch wenn der Grund dafür immer noch unbekannt ist.
Die jetzige Warmzeit ist kein "anthropogenes Produkt" sondern eine natürliche Erscheinung im Rahmen der 1000-Jahreszyklen der Vergangenheit.
Dabei erreicht sie aber nicht die Temperaturen der vorangegangenen Warmzeiten, die um 1 bis 2°C höher lagen.
Ferner ist bemerkenswert, dass bei den beiden vorangegangenen Temperatur-Maxima vor 1000 und 2000 Jahren CO2-Werte von nur 280 ppm herrschten [gemäss IPCC], während sie heute bei 400 ppm liegen.
Das weist darauf hin, dass die wärmeren Perioden wahrscheinlich auf der natürlichen Schwankung der Sonnenaktivität beruhen, und nicht auf einem CO2-Anstieg, den es bei den früheren Warmphasen nicht gab.
Historisch bedeutsam
ist auch die durch die Menschheitsgeschichte belegte Tatsache, dass die Warmzeiten immer wirtschaftliche und kulturelle Blütezeiten waren.
Die dazwischen liegenden kühlen Perioden führten jedoch stets zu ernsten Problemen führten, die Hungersnöte und Völkerwanderungen in Europa auslösten.
Spätestens hier wird auch klar, dass die alarmistische Behauptungen von Politikern wie von Al Gore "die Erde hat Fieber", ausgesprochener Unsinn sind.
↑ E 4
Der 230-Jahreszyklus in den letzten 165 Jahren überlagert von einem 65-Jahreszyklus
Mit folgendem Link wird von anderen Webseiten auf diese Seite verwiesen.
▶230 Jahre deVries-Zyklus & 65 Jahre: Ozean Zyklus
|
|
230 Jahre: deVries-Zyklus |
| 65 Jahre: Ozean Zyklus | |
| Temperatur: °C |
Der 230-Jahreszyklus in den letzten 165 Jahren wird überlagert von einem 65-Jahreszyklus sowie weiteren Effekten wie der unregelmäßigen ENSO-Erscheinungen und größeren Vulkanausbrüchen
Der "ideale" 1000-Jahreszyklus wird variiert durch
den 230-Jahreszyklus, und dieser wiederum durch
den 65-Jahreszyklus der Ozeane, der im Maßstab von Bild 1 nicht dargestellt werden kann,
genauso wenig wie die verschiedenen nicht-zyklischen Erscheinungen wie der ENSO-Einfluss, Vulkanausbrüche, etc.
Bild 3 zeigt den Temperaturverlauf der letzten 165 Jahre mit dem 230-Jahreszyklus mit dem Einfluss des 65-Jahreszyklus.
Die aktuellen jährlichen Temperaturwerte schwanken um plus/minus 0,2°C durch die ENSO- Einfluss, die Sonnenflecken-Aktivität, Vulkanausbrüche, etc.
Der Temperaturanstieg im Zeitraum 1975-1998 um 0,6°C, der die aktuelle Klima-Hysterie auslöste, war genauso hoch wie der vorangegangene Anstieg im Zeitraum 1910 bis 1940 - und keineswegs durch einen CO₂-Effekt, da damals der Gehalt in der Atmosphäre nur um 10 ppm anstieg (von 297 auf 308 ppm).
Auch die Temperaturerhöhung von 1,5°C in den letzen 150 bis 250 Jahren ist keineswegs "außergewöhnlich" oder "gefährlich", wie uns oft in den Medien erzählt wurde, sondern die natürliche Erholung von der letzten Kaltzeit im Zeitraum von 1400 bis 1750, die nicht zur zu einer vereisten Themse und Ostsee geführt hatte, sondern auch zu Hungersnöten in Europa mit der Auswanderungswelle nach Amerika.
↑ E 5
1000 Jahre Suess-Zyklus & 230Jahre deVries-Zyklus
Mit folgendem Link wird von anderen Webseiten auf diese Seite verwiesen.
▶1000 Jahre Suess-Zyklus & 230Jahre deVries-Zyklus
Temperatur der letzten 1000 Jahre und die theoretische Fortsetzung in den nächsten 700 Jahren.
|
|
1000-Jahre: Suess-Zyklus |
| 230-Jahre: deVries-Zyklus | |
| Theoretische Fortsetzung |
Mittelfristig bis in 350 Jahren
Dies ist keine Vorhersage, sondern der mögliche Verlauf des wesentlichen Temperaturtrends,
der mittelfristig in den nächsten 100 Jahren zu einem Abfall um ca. 0,3°C
und in 350 Jahren zu einer ca. 2°C geringerer Globaltemperatur führen kann, genauso wie im LIA ("Little Ice Age") in den Jahren 1450 bis 1700.
In etwa 1000 Jahren
In etwa 1000 Jahren ist dann entsprechend dem 1000-Jahreszyklus wieder mit dem heutigen Temperaturniveau oder etwas weniger zu rechnen.
Folgerung für die nächsten 50 Jahre
In den nächsten 50 Jahren wäre demnach kein Temperatur-Anstieg, sondern eher ein geringer Temperaturabfall zu erwarten.
In den Dekaden vor und nach dem Jahr 2300 könnte eine stärkere Temperaturreduktion auftreten, da sich sowohl der 230-Jahreszyklus als auch der 1000-Jahreszyklus parallel im relativ steilen Abwärtstrend befinden.
↑ E 6 Schlussbemerkungen und Hinweis der Kalte-Sonne-Redaktion
Was die Diagramme zeigen
Die Diagramme zeigen auch, dass alle drei der hier dargestellten Klima-Zyklen fast gleichzeitig ihr Maximum kurz nach letzten Jahrtausendwende hatten;
insofern hätte man eigentlich höhere Temperaturen erwarten können als bei den früheren Warmzeiten.
Vielleicht spielt aber hier die Tatsache eine Rolle, dass die Global-Temperatur seit dem Holozän-Maximum einen negativen Trend hat, d.h. sie hat um in den letzten 8000 Jahren um fast 2°C abgenommen.
Fortsetzung in der Zukunft
Auf der Basis dieser historischen Klimafakten lässt sich auch die mögliche Fortsetzung in der Zukunft darstellen.
Bild 4 zeigt diese Extrapolation der 1000- und 230-Jahres-Zyklen mit den im Wesentlichen zu erwartenden Trends.
Hinzu kommen die Schwankungen des 60/65-Jahreszyklus,
sowie die Einflüsse von ENSO-Erscheinungen, Sonnenflecken-Zyklen und Vulkanausbrüchen,
die - wie auch in der Vergangenheit - zusätzliche Schwankungen um wenige Zehntel Grad nach oben oder unten bewirken können.
Hinweis der Kalte-Sonne-Redaktion
Der Schwerpunkt des Beitrags liegt auf der Analyse natürlicher Zyklen und ihrer Fortschreibung in die Zukunft.
Unberücksichtigt bleibt bei der Prognose in Abbildung 4 die Klimawirkung des CO2, über deren quantitative Rolle derzeit heftig in der Fachwelt diskutiert wird.
In unserem Buch "Die kalte Sonne" stellten wir zwei Szenarien mit CO2-Klimasensitivitäten von 1,0 und 1,5 Grad Celsius pro CO2-Verdopplung vor.
Aktuelle Studien haben den ursprünglichen IPCC-Wert von 3 Grad bereits stark nach unten korrigiert
siehe unseren Beitrag:
Studien aus 2014 geben Hoffnung:
Erwärmungswirkung des CO2 wohl doch
deutlich überschätzt. Offizielle Korrektur steht bevor
▶Die Klimasensitivität von CO₂
Man darf gespannt sein, wie sich die Forschung zur Klimasensitivität in den kommenden Jahren weiterentwickeln wird.
⇧
28 Neue Eiszeit
en New Ice Age
fr Nouvelle période glaciaire
Mit folgenden Links wird von anderen Webseiten auf diese Seite verwiesen:
| de | en | fr |
|---|---|---|
|
Klima Geschichte Neue Eiszeit |
Climate History New Ice Age |
Histoire du climat Nouvelle période glaciaire |
-
Wikipedia
de
Eiszeitalter
en Ice age
fr Glaciation
-
Focus Online
2014-12-25 de Mini-Eiszeit ab 2030? Forscher prognostizieren eiskalte Winter wie im Mittelalter
-
NoTricksZone (Pierre L. Gosselin)
2014-12-29 en Now It's Global Cooling! German Weekly Warns Scientists See "Mini Ice Age Coming In Just A Few Years"