4.2.1 Manipulationen I
en Manipulations I
fr Manipulations I
| ⇨ | Manipulation: | Manipulation I | Manipulation II | Manipulation III | Kritik an IPCC‑Daten |
|---|
Mit folgenden Links wird von anderen Webseiten auf diese Seite verwiesen:
| de | en | fr |
|---|---|---|
|
Klima-Skandal Manipulationen I |
Climate Scandal Manipulations I |
Scandale climatique Manipulations I |
|
|
|


- a de
Lügen, Statistiken und Grafiken
en Lies, statistics, graphs
fr Mensonges, statistiques, graphiques - b de
Wie wird eine Erwärmungs-Panik erzeugt?
en How do you create a Global Warming panic - c de
Der gefälschte Eisbär
en 'ManBearPig is real!' declare top climate scientists.
'And to prove it here's a photo-shopped image
we found on the internet of a polar bear on a melting ice floe.'
- a de
Wie der Wärmeinsel-Effekt zur Aufrechterhaltung der Großen Lüge
benutzt wird
en Using UHI To Create The Big Lie
-
a de
Die wunderbare Welt der Temperaturdaten-Korrekturen:
Und plötzlich hatte sich der Trend ins Gegenteil verkehrt...
en New paper blames about half of global warming on weather station data
homogenization -
b de
Neue Studie enthüllt:
NOAA setzt die Erwärmung der letzten 30 Jahre doppelt so hoch an wie gemessen!
en New study shows half of the global warming in the USA is artificial
- a Hide the Decline I
- b Hide the Decline II
- c de
Gefälschte Erwärmung in den CRU-Temperaturdaten
en Spurious warming demonstrated in CRU surface data - d de
Phil Jones räumt ein, Daten versteckt zu haben, weil es "üblich" war
en Head of 'Climategate' research unit admits sending 'pretty awful emails' to hide data - e de
1940 wärmer als 1998? - Ja!
en 1940 warmer than 1998? - Yes!
fr 1940 plus chaud que 1998? - Oui! - f de
CRU: Das Verschwinden der Abkühlung (1935 und 1975)
en CRU: Rewriting the decline (1935 und 1975) - g de
Auf der Schwarzen Liste der Klimaforscher!
en Circling the Bandwagons: My Adventures Correcting the IPCC - h de
Datenmanipulation: HadCrut wird wärmer
en HadCrut Is Hotting Up - adjustments over a few months - i en Phil Jones: the Secret Agent in Hawaii
- j de
Hat das Hadley Centre die Meeresoberflächentemperatur wirklich unterschätzt?
en Does Hadley Centre Sea Surface Temperature Data (HADSST2)
Underestimate Recent Warming? - k de
CRU Jones gibt zu: Nur 10 bis 20 % der Weltfläche zeigten Erwärmung!
en Even with the instrumental record, the early and late 20th century warming
periods are only significant locally at between 10-20% of grid boxes. - l de
Die CRU-Daten werden andauernd geändert
en CRU Monthly Temperature is Constantly Changing - m de
Gegen den Baum gefahren:
Keith Briffa's fragwürdige Temperaturrekonstruktionen in Sibirien
en Climategate Continues
-
a de
NOAA und NASA/GISS: Daten-Manipulation mit und von Wetterstationen
en NOAA and NASA/GISS: Data-Manipulation with and of Weather Stations
By 1990, NOAA had deleted from its datasets all but 1,500 of the 6,000
thermometersin service around the globe. - b de
NOAA will verfälschte Temperaturmessungen verschleiern
en A Remarkable Lie, from Your Taxpayer-Funded NOAA - c de
Teamwork: Zuerst USHCN und dann GISS
en Teamwork: First USHCN and then GISS
Contribution of USHCN and GISS bias in long-term temperature records
for a well-sited rural weather station - d de
Die angebliche Arktis-Erwärmung bei GHCN und GISS -
Ein Produkt der Datenmanipulation
en GHCN Temperature Adjustments Affect 40% Of The Arctic - e en Extreme UHI Fraud At NOAA
- a de
US Regierung in Erwärmungs Skandal verwickelt - NOAA Blamiert
en US Government in Massive New Global Warming Scandal - NOAA Disgraced - b de
Globaltemperatur zu hoch? NOAA (amerik. Wetterbehörde) bestätigt:
Globale Erwärmung der Dekade wg. defektem Satelliten zweifelhaft
en Leading US Physicist Labels Satellitegate Scandal a 'Catastrophe'
- a de
Wärmegehalt der Ozeane ist geringer als bisher gedacht
en Ocean Heat Content Adjustments: Follow-up and More Missing Heat - b de
NOAA in Not: Erwärmungspause der letzten 15 Jahre lässt sich nicht
so einfach wegtricksen
en NOAA erases 'pause' in warming - b en Black Swan Climate Theory
- c de
NOAA versteckt die Rohdaten hinter einem Viertel-Millionen-Dollar
Schutzwall
en NOAA demands $262,000 fee for looking at their 'public' data - e en Robust Evidence NOAA Temperature Data Hopelessly Corrupted By Warming Bias, Manipulation
- f de
NOAA-Datenmanipulation um 1,4°C:
"Schlimmer kann Wissenschaft nicht degenerieren"
en NOAA 2.5 Degrees F Data Tampering - 'Science Doesn't Get Any Worse Than This'
- a de
Manipulierte GISS-Statistiken
en Manipulated GISS Temperature statistics - b de
GISS streicht polare Meeresoberflächentemperaturen
en GISS Deletes Arctic And Southern Ocean Sea Surface Temperature Data - c de
Drei Jahrzehnte Anpassung
en Three decades of adjustments - d en Why NOAA and NASA proclamations should be ignored
- e de
Die NASA Daten: U.S. Klimawissenschaft so korrupt wie die CRU
en The NASA Files: U.S. Climate Science as Corrupt as CRU - f de
Roh-Daten von GISS: Vor- und Nachher
en GISS "raw" station data - before and after - g de
Die Wandlung der NASA-"Fakten"
en NASA's (Changing) FACTS - h en And now, the most influential station in the GISS record is ...
- i de
GISS-Trend für die Arktis weicht von HadCrut und von Satellitendaten ab
en GISS: Visualizing Arctic Coverage
GISS claims of better 2005 Arctic coverage in their recent paper are not justified. - j de GISS: Ein typischer Fall von Temperatur Daten-Manipulation
- k de
US Thinktank CEI verklagt NASA (GISS) wegen Datenblockade zum Klimawandel!
en NASA accused of 'Climategate' stalling - l de
Was, wenn die Löcher in den GISS-Daten pink wären?
en What if GISS Holes were Pink? - m de
Sind Hansens Temperaturen glaubhaft?
en Is Hansen's Recent Temperature Data Consistent? - n de
GISS strickt weiter an der Legende des Rekordjahres 2010
en GISS Shaping Up To Claim 2010 as #1 - o en GISStimating 1998
- p de
Die Temperaturen fallen - aber GISS präsentiert weiter eine "Erwärmung"
en The Arctic Is The Root Of All Evil
HadCRUT temps have been declining since the start of the current millennium,
but Hansen continues to show an increase. - q de
NASA/GISS manipuliert Temperaturdaten der USA
en Corruption Of The US Temperature Record - r de
Neuer Versuch des GISS, durch Datenverfälschung
eine Arktis-Erwärmung herbeizumanipulieren
en New GISS Data Set Heating Up The Arctic - s de
GISS manipuliert auch Temperaturdaten aus Dublin
en Doing The Dirty Deed In Dublin - t en Building The Hockey Stick Ahead Of Paris
- u en
 2017: Temperaturdatenmanipulation von GISS (NASA) erneut nachgewiesen
- a de
Modellberechnungen und Manipulationen statt Meßdaten -
Wie die Verlangsamung des Meeresspiegelanstiegs geleugnet wird
en More hiding the decline - The University of Colorado has done it again!
- a de
In Erwartung eines US-amerikanischen "Temperatur-Gate"
en A new paper comparing NCDC rural and urban US surface temperature data - b de
Das US National Climatic Data Center NCDC wurde bei der künstlichen
Abkühlung der Vergangenheit ertappt
en NOAA's National Climatic Data Center caught cooling the past -
modern processed records don't match paper records
- a de
NODC verändert die Daten des Ozean-Wärmegehalts: Jetzt abnehmend
en NODC revises ocean heat content data - it's now dropping slightly
- a de
Noch mehr Propaganda mit Zahlen: Über den Rückgang des arktischen Meereises
en The Sea Ice Monster: it's a scaly thing
- a Die Himalaya-Gletscher-Lüge von "Klimapapst" Schellnhuber am 30.10.2009
- b Wie Professor Schellnhuber vom Potsdam Institut für Klimafolgenforschung (PIK) das 2-Grad Ziel erklärt
- c Widersprüchliche Behauptungen des PIK Potsdam-Institut für Klimafolgenforschung
- d
Desinformationstraining für Journalisten; Intendant der DW verneint
Desinformationsabsicht entgegen offizieller Bekundungen! - e de GISS manipuliert auch Potsdamer Temperaturdaten
- f de Mit welchen Tricks deutsche Universitäten abweichende Meinungen niederhalten
- g de Akademiker 'lügen regelmäßig, um Forschungsgelder zu ergattern'
- a de
Schwedische Daten wurden von der CRU "processed"
Schweden bezichtigen Phil Jones der Falschaussage
en Swedish data have been "processed" by CRU
Climate scientist delivers false statement in parliament enquiry
- a de
GISS hat australische Temperaturmessungen manipuliert
en GISS manipulates climate data in Australia - b en Australia: Darvin Airport
- c Australian "homogenisation" of Data
- d Temperature data missing for Australia
- e Major new analysis by Aussies show IPCC manipulated data
- f de
Die australische Temperaturgeschichte - ein Gesamtüerblick
en The Australian Temperature Record- The Big Picture - g de
Massenweise Fehler in den GHCN-Daten für Australien
en "Gross" Data Errors in GHCN V2. for Australia
- a de
Klimadatenfälschung in Neuseeland
en The NIWA New Zealand data adjustment story - b en Now KiwiGate: New Zealand climatologists destroy nation's raw temperature data
- c de
Die Erwärmung, die es nicht gab
en NIWA's Kiwi Kaper - Crisis in New Zealand climatology: The warming that wasn't - d de
Neuseeländisches Institut wegen Temperatur-Datenmanipulation verklagt
en New Zealand's NIWA sued over climate data adjustments - e de
Neuseelands Wetterbehörde zieht Verantwortung für historische
Temperaturangaben zurück
en Observations on NIWA's Statement of Defence
| ⇨ | Manipulation: | Manipulation I | Manipulation II | Manipulation III | Kritik an IPCC‑Daten |
|---|
| de | en | fr |
|---|---|---|
| Wissenschaft, Wirtschaft, Forschung und Entwicklung |
Science, Economy, Research and Development |
Science, économie, recherche et développement |
| Wissenschaftlicher Betrug | Science Fraud | Fraude de la science |
⇧ 1 Wo ist das Problem / Where is the problem? / Où est le problème?
- a de
Lügen, Statistiken und Grafiken
en Lies, statistics, graphs
fr Mensonges, statistiques, graphiques - b de
Wie wird eine Erwärmungs-Panik erzeugt?
en How do you create a Global Warming panic - c de
Der gefälschte Eisbär
en 'ManBearPig is real!' declare top climate scientists.
'And to prove it here's a photo-shopped image
we found on the internet of a polar bear on a melting ice floe.'
↑
a Lügen, Statistiken und Grafiken
en Lies, statistics, graphs
fr Mensonges, statistiques, graphiques
|
|
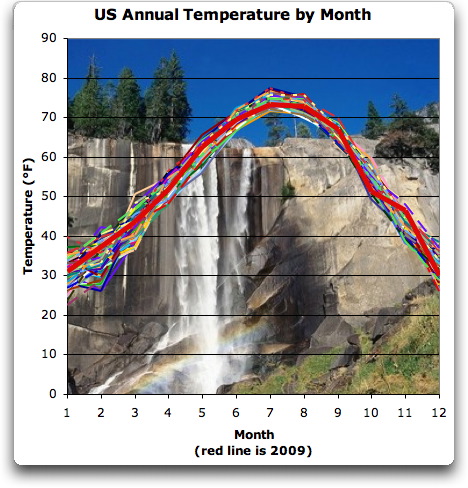
de Üblicherweise werden uns Graphiken zum Temperaturtrend wie in dieser Abbildung präsentiert, die beispielhaft die Entwicklung der Jahrestemperaturen in den USA während der letzten gut 100 Jahre zeigt. Die Darstellung zeigt offenbar einen deutlichen und beängstigenden Anstieg, der sich in der Steigung der roten Trendgeraden niederschlägt. Das schreit doch nach sofortigem Handeln. en
I got to thinking about how the information about temperatures is
presented. Whoa, this is obviously a huge and scary change, look at the slope of that trend line, this must be something that calls for immediate action. "Well, it's changed about one degree Fahrenheit, call it half a degree C, that's not even enough to feel the difference." |
|
de Daten mit unseren eigenen Erfahrungen vergleichen Abbildung 2 ist eine Möglichkeit dafür. Es zeigt die Temperaturen in den USA, Monat für Monat, für jedes Jahr seit 1895. Um das weiter zu untersuchen, zeigt Abbildung 3 die Veränderung der Durchschnittswerte von Jahrzehnt zu Jahrzehnt in der gleichen Darstellungsweise. Für die meisten Monate des Jahreslaufs sind die Unterschiede von einem Jahrzehnt zum anderen so gering, daß man die Linien kaum unterscheiden kann. Meine Schlußfolgerung: Weitergehen, Leute, hier gibt es nichts zu sehen ... |
en Compare temperatures to our actual experience So I decided to look for a way to present exactly the same information so that it would make more sense, a way that we can compare to our actual experience. Fig. 2 is one way to do that. It shows the US temperature, month by month, for each year since 1895. To investigate further, Fig. 3 looks at the decadal average changes in the same way. Presented in this fashion, we are reminded that the annual variation in temperature is much, much larger than the ~ 1°F change in US temperatures over the last century. My conclusion? Move along, folks, nothing to see here ... |


↑
b Wie wird eine Erwärmungs-Panik erzeugt?
en How do you create a Global Warming panic
fr Comment créer une panique
-
LifeSiteNews
2009-12-18 en How do you create a Global Warming panic when the weather isn't cooperating?
↑
c Der gefälschte Eisbär
en 'ManBearPig is real!' declare top climate scientists. 'And to prove it here's a photo-shopped image we found on the internet of a polar bear on a melting ice floe.'
-
Klimaskeptiker Info (Andreas Kreuzmann)
2010-05-11 de Der gefälschte EisbärIm Magazin Science wurde ein von 250 großteils fachfremden Akademikern unterzeichneter Brief veröffentlicht, in dem diese ihrer Verstörung über die massive Kritik an der "Klimaforschung" nach den ClimateGate- und GlacierGate-Skandalen Ausdruck verliehen.
Den Brief garnierte Science mit einem Foto, das einen Eisbären auf einer kleinen Eisscholle zeigte.
Dieses Bild ist gefälscht.
-
Telegraph UK
2010-05-10 en 'ManBearPig is real!' declare top climate scientists. 'And to prove it here's a photo-shopped image we found on the internet of a polar bear on a melting ice floe.'Did you ever see a more moving picture? (Well, apart from all the other moving pictures involving polar bears). What particularly moves me is how wafer thin that ice is and how oh-so-far it is from land. Weep, oh readers, weep for the terrible plight of poor Ursus maritimus, the bear we all helped kill because of our selfish refusal to change our lifestyles! (Hat tip: Philippe Monthoux)
Well, anyway that's what 255 members of America's National Academy of Sciences want you to believe. The floating Polie was used to illustrate a letter they've just had printed in Science magazine in which they whinge about the McCarthy-esque persecution they've been suffering at the hands of those evil truth-seeking types who so unfairly think it's wrong of scientists to lie and embezzle grant money and fake data and exaggerate risks and hide evidence and bully rival scientists into silence.
We are deeply disturbed by the recent escalation of political assaults on scientists in general and on climate scientists in particular. All citizens should understand some basic scientific facts. There is always some uncertainty associated with scientific conclusions; science never absolutely proves anything. When someone says that society should wait until scientists are absolutely certain before taking any action, it is the same as saying society should never take action. For a problem as potentially catastrophic as climate change, taking no action poses a dangerous risk for our planet.
I wonder if they approach their scientific research with the same rigour and integrity which went into their picture research. The polar bear photo can be found at Istockphoto. Here is the description:
A polar bear managed to get on one of the last ice floes floating in the Arctic sea. Due to global warming the natural environment of the polar bear in the Arctic has changed a lot. The Arctic sea has much less ice than it had some years ago. (This images is a photoshop design. Polarbear, ice floe, ocean and sky are real, they were just not together in the way they are now)
⇧ 2 Wärme-Insel Trick / Urban Heat Island Trick
- a de
Wie der Wärmeinsel-Effekt zur Aufrechterhaltung der Großen Lüge
benutzt wird
en Using UHI To Create The Big Lie
↑
a Wie der Wärmeinsel-Effekt zur Aufrechterhaltung der Großen Lüge benutzt wird
en Using UHI To Create The Big Lie
fr Utilisation des îots de chaleur urbain pour tricher
|
|
|
-
Klimaskeptiker Info (Andreas Kreuzmann)
2012-02-17 de Wie der Wärmeinsel-Effekt zur Aufrechterhaltung der Großen Lüge benutzt wirdIn der wirklichen Welt gibt es seit etwa 15 Jahren keine Erwärmung mehr, gleichzeitig steigt die Konzentration des CO2 in der Atmosphäre weiter ungebremst an.
Dies ist der stärkste empirische Hinweis darauf, daß die Behauptung, die globalen Temperaturen kaum von den vielgescholtenen "Treibhausgasen" beeinflußt werden.
In alarmistischen Blogs liest man freilich das geneua Gegenteil.
| de | en | fr |
|---|---|---|
| Temperatur | Temperature | Température |
| Wärme-Inseln | Urban Heat Islands | Îlots de chaleur urbain |
⇧ 3 Gefälschte Temperaturdaten / Temperature Data Fraud
-
a de
Die wunderbare Welt der Temperaturdaten-Korrekturen:
Und plötzlich hatte sich der Trend ins Gegenteil verkehrt...
en New paper blames about half of global warming on weather station data
homogenization -
b de
Neue Studie enthüllt:
NOAA setzt die Erwärmung der letzten 30 Jahre doppelt so hoch an wie gemessen!
en New study shows half of the global warming in the USA is artificial
↑
a Die wunderbare Welt der Temperaturdaten-Korrekturen: Und plötzlich
hatte sich der Trend ins Gegenteil verkehrt...
en New paper blames about half of global warming on weather station data
homogenization
|
|
↑
b Neue Studie enthüllt: US Wetterbehörde NOAA setzt die Erwärmung der
letzten 30 Jahre doppelt so hoch an wie gemessen!
en New study shows half of the global warming
in the USA is artificial
|
|
|
|
⇧ 4 Hadley/CRU (Climategate 1a)
- a Hide the Decline I
- b Hide the Decline II
- c de
Gefälschte Erwärmung in den CRU-Temperaturdaten
en Spurious warming demonstrated in CRU surface data - d de
Phil Jones räumt ein, Daten versteckt zu haben, weil es "üblich" war
en Head of 'Climategate' research unit admits sending 'pretty awful emails' to hide data - e de
1940 wärmer als 1998? - Ja!
en 1940 warmer than 1998? - Yes!
fr 1940 plus chaud que 1998? - Oui! - f de
CRU: Das Verschwinden der Abkühlung (1935 und 1975)
en CRU: Rewriting the decline (1935 und 1975) - g de
Auf der Schwarzen Liste der Klimaforscher!
en Circling the Bandwagons: My Adventures Correcting the IPCC - h de
Datenmanipulation: HadCrut wird wärmer
en HadCrut Is Hotting Up - adjustments over a few months - i en Phil Jones: the Secret Agent in Hawaii
- j de
Hat das Hadley Centre die Meeresoberflächentemperatur wirklich unterschätzt?
en Does Hadley Centre Sea Surface Temperature Data (HADSST2)
Underestimate Recent Warming? - k de
CRU Jones gibt zu: Nur 10 bis 20 % der Weltfläche zeigten Erwärmung!
en Even with the instrumental record, the early and late 20th century warming
periods are only significant locally at between 10-20% of grid boxes. - l de
Die CRU-Daten werden andauernd geändert
en CRU Monthly Temperature is Constantly Changing - m de
Gegen den Baum gefahren:
Keith Briffa's fragwürdige Temperaturrekonstruktionen in Sibirien
en Climategate Continues
![]()
![]()

↑ a en Hide the Decline I
en
![]() Hide The Decline I
Hide The Decline I
en
![]() Hide The Decline II
Hide The Decline II
|
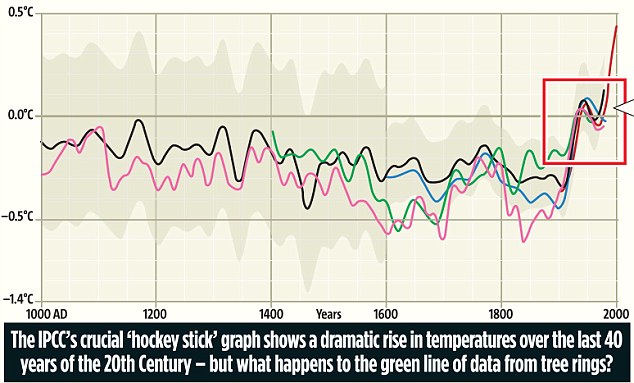
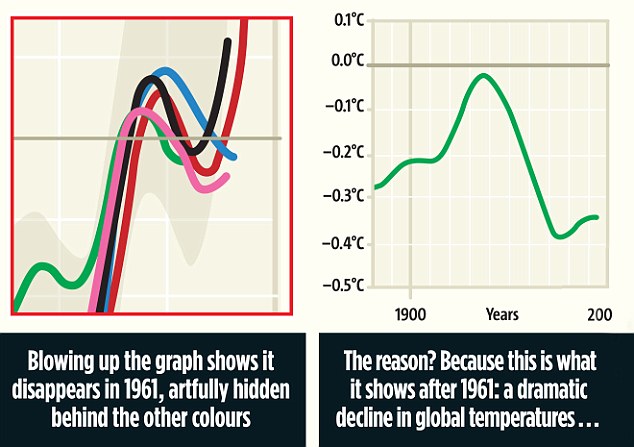
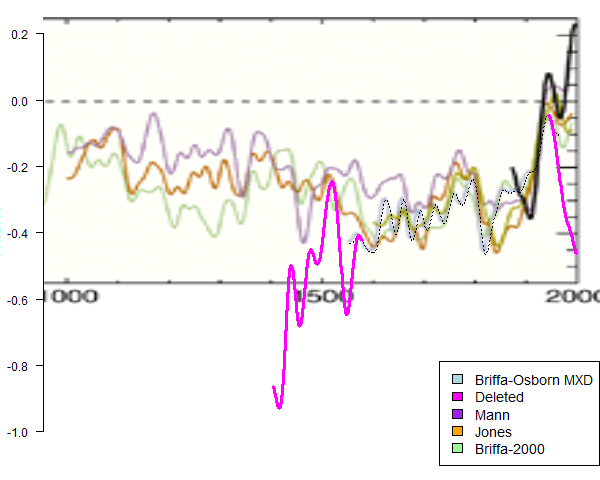
de Hide the Decline" - zwei Bilder sagen mehr als 2000 Worte Ab dem Punkt, an dem die Baumring-Rekonstruktion keinen Anstieg mehr zeigt, sind ganz einfach die mit dem thermometer gemessenen Werte auf die rekonstruktion aufgepfropft worden. Das ist "Mike's Nature trick to hide the decline". Es wurden ganz einfach und unkommentiert zwei völlig verschiedene Datenreihen kombiniert, um eine bestimmte Aussage zu erzielen. Das allein reicht schon, um den Vorwurf vorsätzlicher Manipulation unter Verletzung grundlegender wissenschaftlicher Prinzipien zu rechtfertigen. |
en Hide the Decline - 2 pictures for 2000 comments
Video:
|


Update:
-
E-mail
1999-11-16 en From: Phil Jones To: "Michael E. Mannen I've just completed Mike's Nature trick of adding in the real temps to each series for the last 20 years (ie from 1981 onwards) amd from 1961 for Keith's to hide the decline.
fr "Je viens juste de terminer l'utilisation de l'astuce de Mike dans Nature qui consiste à ajouter les données réelles de température pour chacune des séries des 20 dernières années (c'est à dire de 1981 à maintenant) et depuis 1961 avec celles de Keith (NDT: Briffa), pour cacher le déclin."
-
E-mail
2008-10-26 en From: Mick Kelly To: Phil Jonesen Yeah, it wasn't so much 1998 and all that that I was concerned about, used to dealing with that, but the possibility that we might be going through a longer - 10 year - period of relatively stable temperatures beyond what you might expect from La Nina etc.
Speculation, but if I see this as a possibility then others might also.
Anyway, I'll maybe cut the last few points off the filtered curve before I give the talk again as that's trending down as a result of the end effects and the recent cold-ish years.
fr "Ouais, c'est pas tellement 1998 et tout ça qui me tracasse, j'ai l'habitude d'y répondre, mais la possibilité que nous puissions passer par une période plus longue -- 10 ans -- de températures relativement stables au-delà de ce qu'on pourrait s'attendre avec La Niña etc.
Spéculation, mais si je vois cela comme une possibilité, d'autres pourraient également s'en apercevoir.
Bref, je vais peut-être ôter les dernières valeurs de ma courbe filtrée avant de présenter à nouveau mon exposé parce que la tendance est à la baisse à la suite des effets d'extrémité et des dernières années relativement froides"
|
|
|

|
|
Here's what UEA appears to have done in the diagram. While they've used the actual Briffa reconstruction after 1960 in making their smooth, even now, they deleted values after 1960 so that the full measure of the decline of the Briffa reconstruction is hidden. Deleted values are shown in magenta. |
|
|
|
- EIKE Europäisches Institut für Klima und Energie
-
American Thinker
2009-12-06 en Understanding Climategate's Hidden Decline
Close followers of the Climategate controversy know that much of the mêlée surrounds an e-mail in which Climate Research Unit (CRU) chief Phil Jones wrote about using "Mike's Nature Trick" (MNT) to "hide the decline."
And yet, seventeen days and thousands of almost exclusively on-line op-eds into this scandal, it still seems that very few understand exactly which "decline" was being hidden, what "trick" was used to do so, and why Jones's words have become the slogan for the greatest scientific fraud in history.
-
Climate Audit (Steve McIntyre)
2009-11-29 en Still Hiding the Decline
Even in their Nov 24, 2009 statement, the University of East Anglia failed to come clean about the amount of decline that was hidden.
The graphic in their statement continued to "hide the decline" in the Briffa reconstruction by deleting adverse results in the last part of the 20th century.
This is what Gavin Schmidt characterizes as a "good thing to do".
-
2009-11-24 en
Hide The Decline - Climategate
A parody of "Draggin the Line" by Tommy James and the Shondells.
Which I think is where the term "Treehugger" comes from "Huggin a tree when you get near it" was the original lyric which I replaced with "you should have chopped more trees instead of hugging them" than ever.
Coal Creek Canyon, Colorado - Annual Temperatures
|
|
|
-
Watts Up With That? (Antony Watts)
2010-01-04 en Coal Creek Redux
⇒ Google Web
en
![]() hide the decline cimategate
hide the decline cimategate
⇒ Google Video
en
![]()
![]() hide the decline climategate
hide the decline climategate
de Aus der Panik-Küche en From the panic laboratory fr De la marmite des alarmistes
- 2009-12-14 en Climategate question at Copenhagen from Journalist, MET WITH ARMED RESPONSE From U.N. THUG
↑ b en Hide the Decline II
![]()
![]()
"In the graphic below, I've shown (in magenta) not just the
hide-the-decline extension, but the deleted data prior to 1550."
-
Klimaskeptiker Info (Andreas Kreuzmann)
2011-03-23 de Weitere Manipulation in der berüchtigten "Hockeystick"-Rekonstruktion gefundenDas berühmte ClimateGate-Zitat "hide the decline" bezog sich auf einen Trick, den das "Hockeystick"-Team anwenden mußte, um das Konsistenzproblem ihres Temperaturproxys mit den in der wirklichen Welt gemessenen Temperaturen zu verbergen.
Für die Zeit ab etwa 1960 zeigten die gemessenen Temperaturen nämlich einen steigenden Trend, die Baumring-Proxys von Briffa und anderen Hockeyteam-Mitgliedern hätten aber einen Temperaturrückgang gezeigt.
Hätten Briffa und Co. diese Abweichung veröffentlicht, wäre die ihren Propaganda-Zielen dienende Temperaturrekonstruktion der letzten 1000 Jahre aus einigen wenigen Bäumen schon von Anfang an als Unsinn entlarvt worden.
Wenn der Proxy nach 1960 nicht funktioniert, wer hätte dann ernsthaft annehmen können, daß die Ergebnisse vor 1850 akkurat waren?
Denselben Trick hat Steve McIntyre jetzt auch am Anfang von Brifaas Rekonstruktion gefunden.
Während die Rekonstruktion ab 1402 Daten lieferte, wurden erste die Daten ab 1550 in der "offiziellen" Rekonstruktion benutzt, weil die rund 150 Jahre zuvor von anderen Rekonstruktionen deutlich abwichen.
Briffa mußte also wissen und hat daher gewußt, daß seine Hockeystick-Baumring-Rekonstruktion weder am Anfang noch am Ende der Zeitreihe die Wirklichkeit mit angmessener Genauigkeit abbildete.
Anders gesagt:
Briffa wußte, daß seine Beumringdaten nichts als Datenschrott waren.Aber statt die Datengrundlage oder die Methodologie zu verbessern, hat er die "unbequemen" Daten einfach weggelassen und damit das politisch opportune Ergebnis erzeugt.
-
Climate Audit (Steve McIntyre)
2011-03-21 de Hide the Decline - the Other Deletion"In the graphic below, I've shown (in magenta) not just the hide-the-decline extension, but the deleted data prior to 1550."
↑
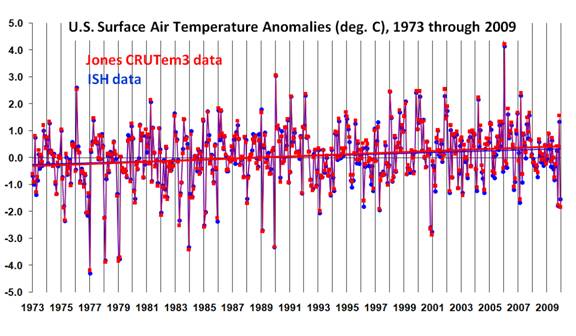
c Gefälschte Erwärmung in den CRU-Temperaturdaten
en Spurious warming demonstrated in CRU surface data
fr Fausse réchauffement dans les températures du CRU
|
U.S. Surface Air Temperature Anomlies |
Difference in U.S. Surface Air Temperature Anomlies |
|
red=Jones CRUTem3 blue=ISH |
Jones CRUTem3 minus ISH |
|

|
-
Watts Up With That? (Antony Watts)
2010-02-27 en Spencer: Spurious warming demonstrated in CRU surface data
Source:
-
Roy Spencer
2010-02-27 en Spurious Warming in the Jones U.S. Temperatures Since 1973In fact, the results for the U.S. I have presented above almost seem to suggest that the Jones CRUTem3 dataset has a UHI adjustment that is in the wrong direction.
It is increasingly apparent that we do not even know how much the world has warmed in recent decades, let alone the reason(s) why.
It seems to me we are back to square one.
↑
d ClimateGate: Phil Jones räumt ein, Daten versteckt zu haben, weil es
"üblich" war
en Head of 'Climategate' research unit admits
sending 'pretty awful emails' to hide data
-
United Kingdom Parliament
2010-03-01 en The disclosure of climate data from the Climatic Research Unit at the University of East Anglia
de
-
Klimaskeptiker Info (Andreas Kreuzmann)
2010-03-01 de ClimateGate: Phil Jones räumt ein, Daten versteckt zu haben, weil es "üblich" warDer Wissenschaftler im Zentrum des ClimateGate-Skandals, Prof. Dr. Phil Jones, hat bei einer Anhörung im Ausschuß des britischen Unterhauses eingeräumt, Daten verborgen zu haben, weil dies "normale Praxis" sei.
Eine unabhägige Untersuchung überprüft die Vorwürfe, die nach der Veröffentlichung der ClimateGate-E-Mails laut wurden, nach denen Wissenschaftler Daten verstecket, manipuliert oder gelöscht haben sollen, um dadurch die Hypothese menschgemachter globaler Erwärmung (AGW) zu stützen.
Prof. Jones sagte heute, es sei nicht "Standardpraxis" in der Klimawissenschaft, Daten und Methoden herauszugeben, damit sie von anderen Wissenschaftlern überprüft und bestritten werden können.
Er sagte auch, daß die wissenschaftlichen Journale, die seine Arbeiten veröffentlicht hätten, nicht danach verlangt hätten [die Daten und Methoden zu erhalten].
Wenn das eine zutreffende Beschreibung der "Klimawissenschaft" der letzten 30 Jahre ist, handelt es sich zum einen nicht um Wissenschaft, zum andern ist es dann kein Wunder, daß IPCC und Al Gore die Welt mit soviel Unsinn belästigt haben.
Die "Klimawissenschaft" ist ganz offenbar in einem beklagenswerten Zustand, wenn irgendwelche (politisch gewollten) Aussagen jahrzehntelang ungeprüft veröffentlicht wurden, während andere (politisch unerwünschte) Ergebnisse ebenso lang systematisch unterdrückt werden konnten.
en
-
Mail Online
2010-03-02 de Head of 'Climategate' research unit admits sending 'pretty awful emails' to hide dataScientists at the heart of the Climategate row were yesterday accused by a leading academic body of undermining science's credibility.
The Institute of Physics said 'worrying implications' had been raised after it was revealed the University of East Anglia had manipulated data on global warming.
The rebuke - the strongest yet from the scientific community - came as Professor Phil Jones, the researcher at the heart of the scandal, told MPs he had written 'some pretty awful emails' - but denied trying to suppress data.
He admitted withholding data about global temperatures but said the information was publicly available from American websites.
And he claimed it was not 'standard practice' to release data and computer models so other scientists could check and challenge research.
-
Watts Up With That? (Antony Watts)
2010-03-01 en Phil Jones on the hot seat - not sharing data is "standard practice"
-
Watts Up With That? (Antony Watts)
2010-03-02 en Video: Dr. Phil Jones Climategate testimony at the British House of CommonsHere's a sampling of what British press has to say.
-
Prof Phil Jones, head of the University of East Anglia's Climatic Research Unit, is accused of withholding raw data behind his research on global warming.
In emails stolen from the university he asks one climate change sceptic: "Why should I give information to you when all you want to do is find something wrong with it?"
In a grilling by MPs, Prof Jones admitted he had withheld data and sent some "pretty awful" emails. But he insisted it was "standard practice" to refuse certain information to other scientists.
-
Also giving evidence alongside Lord Lawson was Dr Benny Peiser, director of the Global Warming Policy Foundation.
He said that sound science was based on "testability, replication, and verification".
Dr Peiser told the committee: "Of course, if you do not have the data sets or methods then you have to trust the word of a scientist."
"You cannot even see if he has done these calculations directly on the basis of solid data, and this is the core of this problem - it is not about the overall science, it is about the process."
-
The integrity of climate change research is in doubt after the disclosure of e-mails that attempt to suppress data, a leading scientific institute has said.
The Institute of Physics said that e-mails sent by Professor Phil Jones, head of the Climatic Research Unit at the University of East Anglia, had broken "honourable scientific traditions" about disclosing raw data and methods and allowing them to be checked by critics.
Update 1:
-
Watts Up With That? (Antony Watts)
2010-03-02 en The Final Straw
Update 2, see:
↑
e 1940 wärmer als 1998? - Ja!
en 1940 warmer than 1998? - Yes!
fr 1940 plus chaud que 1998? - Oui!
- en How To Hide Global Cooling: Delete The "1940's Blip"
- de
Steigen die Arktis-Temperaturen wirklich auf ein Rekordhoch?
en Comments on "Arctic air temperatures climb to record levels - en ETH Zurich: Swiss Glaciers melted in the 1940's faster than today"
↑ en How To Hide Global Cooling: Delete The "1940's Blip"
|
A: Delete The "1940's Blip"
|
B: Warming Contradicted by Satellite Records
|
|
Look at the 1940's blip here, it is nothing. Was it really this low, or did the CRU con men use statistics to cool it way down, only to have to put the 'raw' data back into the later decades to make the temperature appear higher now than in the 1940's and 1950's? |
|
|
|
en Well, thanks to the CRU data dump we have some of their temp runs from 2008 and 2005. Let's look at the CRU Land Temp Data from some selected countries around the globe (and yes, I cherry picked them, but it was not hard since all countries nearby these saw similar patterns). |

-
The Strata-Sphere
2009-11-24 en How To Hide Global Cooling: Delete The "1940's Blip"
As I and others dive into the CRU data dump we learn more and more about how the Global Warming conspiracy was pulled off. We now know all you need to do to pull this off is statistically cover up true data that tells the wrong story with 'bad' data that tells the story you want to have told.
2009-12-03 en Climategate Escalating, Smoking Gun Could Be 1940's 'Blip'
-
E-mail
2009-09-27 en From: Tom Wigley To: Phil Jonesen If you look at the attached plot you will see that the land also shows the 1940s blip (as I'm sure you know).
So, if we could reduce the ocean blip by, say, 0.15 degC, then this would be significant for the global mean -- but we'd still have to explain the land blip.
I've chosen 0.15 here deliberately.This still leaves an ocean blip, and i think one needs to have some form of ocean blip to explain the land blip (via either some common forcing, or ocean forcing land, or vice versa, or all of these). When you look at other blips, the land blips are 1.5 to 2 times (roughly) the ocean blips -- higher sensitivity plus thermal inertia effects. My 0.15 adjustment leaves things consistent with this, so you can see where I am coming from.
Removing ENSO does not affect this.It would be good to remove at least part of the 1940s blip, but we are still left with "why the blip".
fr Quelques spéculations sur comment corriger les mesures des températures de surface des océans (SST) afin d'expliquer en partie la petite hausse des températures dans les années 1940.
Si tu regardes le graphique joint, tu remarqueras que les continents ont également connu cette petite anomalie des années 1940 (comme tu le sais sûrement).
Donc, si nous pouvions réduire l'anomalie océanique par, disons, 0,15° C, cela aurait alors un impact important sur la moyenne planétaire -- mais il faudrait toujours expliquer la petite anomalie continentale.
J'ai choisi 0,15 à dessein.Il restera toujours une petite hausse océanique, et je crois qu'il faut avoir un type de petite pointe océanique pour expliquer la petite anomalie continentale (via soit un type de forçage commun, soit l'océan qui force les continents, ou vice versa, ou tous à la fois). Si tu regardes les autres petites anomalies, les anomalies continentales sont 1,5 à 2 fois (approximativement) plus fortes que les anomalies océaniques -- plus grande sensibilité et effets de l'inertie thermique.
Mon ajustement de 0,15 rentre dans ces paramètres, tu vois donc ce que je veux dire.
Éliminer ENSO n'a pas d'effet sur ceci.Il serait bon d'éliminer au moins une partie de l'anomalie des années quarante, mais la question demeure «pourquoi cette petite anomalie».
| de | en | fr |
|---|---|---|
| Temperatur | Temperature | Température |
| Offizielle, weltweite, amtliche Temperaturbestimmungen | Official worldwide temperature measurement | Mesurages officielles des températures mondiales |
↑
Steigen die Arktis-Temperaturen wirklich auf ein Rekordhoch?
enComments on "Arctic air temperatures climb to record levels"
|
|
|
| de | en | fr |
|---|---|---|
|
Auswirkungen des Klimas Arktis (Nordpol) |
Effects of Climate Change Arctic (North Pole) |
Conséquences climatiques Arctique (Pôle Nord) |
| Temperaturen in der Arktis | Arctic Temperatures | Températures dans l'arctique |
| Meereis in der Arktis | Arctic Sea Ice | Banquise arctique |
↑ en ETH Zurich: Swiss Glaciers melted in the 1940's faster than today
|
|
|

| de | en | fr |
|---|---|---|
|
Auswirkungen des Klimas Gletscher |
Impacts of Climate Change Glaciers |
Impacts du changement climatique Glaciers |
en "They are not sure how to model one of the most fundamental influences on northern hemisphere climate"
NAO = North Atlantic Oscillation
-
Black's Whitewash
2010-01-04 en North Atlantic Oscillation - UEA CRU Emails Are Interesting"Looking further ahead, there is the possibility that climate change may induce a change in the state or behaviour of the NAO.
Unfortunately, the global climate models that are used to study anthropogenic climate change do not yet give unequivocal predictions for the future of the NAO, linked to the fact that the NAO is related to the tracks of Atlantic storms, and predictions of storminess changes are also currently uncertain."
So basically in laymans terms, they are not sure how to model one of the most fundamental influences on northern hemisphere climate.
Everyone got that?
↑
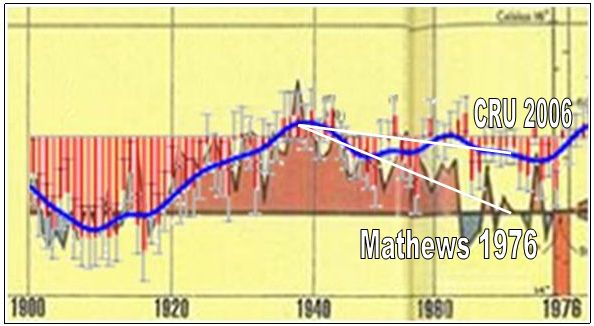
f CRU: Das Verschwinden der Abkühlung (1935 und 1975)
en CRU: Rewriting the decline (1935 und 1975)
![]() de
de
![]() en
en
![]()
Above: The blue line is the adjusted CRU average from 2006,
overlaid on the 1976 National Geographic graph.
-
Klimaskeptiker Info (Andreas Kreuzmann)
2010-03-16 de Das Verschwinden der Abkühlung
2010-03-18 de Wetterballon-Daten beweisen die "verschwundene" Abkühlung
-
Watts Up With That? (Antony Watts)
2010-03-16 en Rewriting the decline
2010-03-18 en Weather balloon data backs up missing decline found in old magazine
2010-03-18 en More on the National Geographic Decline
-
Hide the decline
2010-03-18 en Decline: Temperature decline 1940-78, the cold data-war
↑
g Auf der Schwarzen Liste der Klimaforscher!
en Circling the Bandwagons:
My Adventures Correcting the IPCC
-
E-mail
2004-07-08 en From: Phil Jones To: "Michael E. Mannen I can't see either of these papers being in the next IPCC report.
Kevin and I will keep them out somehow - even if we have to redefine what the peer-review literature is !
de "Ich will keinen dieser Aufsätze im nächsten IPCC-Bericht sehen.
Kevin (Trenberth) und ich werden sie irgendwie heraus halten - auch wenn wir dafür den Review-Prozess neu definieren müssen."
fr "Je ne vois pas comment un seul de ces articles pourrait figurer dans le prochain rapport du GIEC.
Kevin et moi nous l'empêcherons par n'importe quel moyen - même si pour cela nous devons redéfinir ce qu'est la littérature revue par les pairs!"
-
E-mail
2003-04-24 en From: Tom Wigley To: Timothy Carteren Mike's idea to get editorial board members to resign will probably not work -- must get rid of von Storch too, otherwise holes will eventually fill up with people like Legates, Balling, Lindzen, Michaels, Singer, etc.
I have heard that the publishers are not happy with von Storch, so the above approach might remove that hurdle too.
fr "L'idée de Mike (NDT: Mann) d'obtenir la démission de membres du bureau éditorial ne marchera probablement pas -- Nous devons nous débarrasser de von Storch aussi, sinon les trous seront peut-être remplis par des gens comme Legates, Balling, Lindzen, Michaels, Singer etc.
J'ai entendu dire que la maison d'édition n'était pas satisfaite de von Storch, de telle sorte que l'approche suggérée ci-dessus peut nous débarrasser aussi de ce fardeau."
-
Ross McKitrick, Professor of Economics University of Guelph
2010-03 en Circling the Bandwagons: My Adventures Correcting the IPCC
Introduction
-
This is the story of how I spent 2 years trying to publish a paper that refutes an important claim in the 2007 report of the Intergovernmental Panel on Climate Change (IPCC).
The claim in question is not just wrong, but based on fabricated evidence. Showing that the claim is fabricated is easy: it suffices merely to quote the section of the report, since no supporting evidence is given. But unsupported guesses may turn out to be true.
Showing the IPCC claim is also false took some mundane statistical work, but the results were clear.
Once the numbers were crunched and the paper was written up, I began sending it to science journals.
That is when the runaround began.
Having published several against-the-flow papers in climatology journals I did not expect a smooth ride, but the process eventually became surreal.
-
In the end the paper was accepted for publication, but not in a climatology journal.
From my perspective the episode has some comic value, but I can afford to laugh about it since I am an economist, not a climatologist, and my career doesn't depend on getting published in climatology journals.
If I was a young climatologist I would have learned that my career prospects would be much better if I never write papers that question the IPCC.
-
I am taking this story public because of what it reveals about the journal peer review process in the field of climatology.
Whether climatologists like it or not, the general public has taken a large and legitimate interest in how the peer review process for climatology journals works, because they have been told for years that they will have to face lots of new taxes and charges and fees and regulations because of what has been printed in climatology journals. Because of the policy stakes, a bent peer review process is no longer a private matter to be sorted out among academic specialists.
And to the extent the specialists are unable or unwilling to fix the process, they cannot complain that the public credibility of their discipline suffers.
-
EIKE Europäisches Institut für Klima und Energie
2010-04-05 de Auf der Schwarzen Liste der Klimaforscher!Immer wieder wird von Klimaforschern der Erwärmung, wie z.B. denen des PIK, gegenüber abweichenden Ergebnissen von nicht genehmen Klimaforschern der scheinbar wohlwollende Rat erteilt: "Veröffentlicht eure Ergebnisse in renommierten Fachzeitschriften, mit Peer-Rewiew Prozess. Dann stellen wir uns der daraus resultierenden Diskussion".
Steffen Hentrich vom liberalen Institut der Friedrich Naumann Stiftung hat sich einmal die besonderen Praktiken des Peer- Review- Verfahrens bestimmter Klimaforscher angesehen.
Er zeigt am Beispiel von Ross McKittrick, dass Ergebnisse, die anders sind als die politisch Gewollten, nicht publiziert werden dürfen.
Deren Autoren landen auf einer schwarzen Liste.
Diese Liste kontrolliert ein sehr enger Kreise von IPCC Klimaforschern.
Sie bestimmen, wer darauf landet.
Quelle:
-
Denken für die Freiheit
2010-04-02 de Auf der Schwarzen Liste der Klimaforscher
-
Ross McKitrick
en Annotated Index to my Publications and Papers
↑
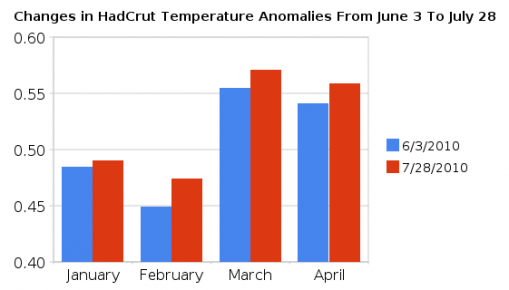
h Datenmanipulation: HadCrut wird wärmer
en HadCrut Is Hotting Up -
adjustments over a few months
|
|
|
-
Klimaskeptiker Info (Andreas Kreuzmann)
2010-07-29 de Datenmanipulation: HadCrut wird wärmer - "Anpassungen" innerhalb weniger WochenZwei große Temperaturdatenreihen, die auf Messungen an der Erdoberfläche basieren, werden von den AGW-Anhängern verwendet und zitiert:
Die Reihe GIStemp des GISS und HadCrut vom Hadley Centre/CRU.Wie zuvor das GISS hat jetzt auch Hadley/CRU damit begonnen, die Daten nachträglich zu manipulieren, um eine "Erwärmung" zu belegen.
-
Watts Up With That? (Antony Watts)
2010-07-28 en HadCrut Is Hotting Up - adjustments over a few monthsHadCrut still shows 1998 hotter than 2010 so far, but they seem to be working on "correcting" that problem.
Why is it that post facto adjustments always seem to be upwards in later years, and downwards in earlier years?
This whole global temperature business looks like a complete joke to me.
↑ i Phil Jones: the Secret Agent in Hawaii
|
|
CRU has increased relative to GHCN by approximately 2 deg C during the 20th century. "I guess that's what the Met Office means by the "value added" product |

-
Climate Audit (Steve McIntyre)
2009-06-21 en Phil Jones: the Secret Agent in Hawaii
↑
j Hat das Hadley Centre die Meeresoberflächentemperatur
wirklich unterschätzt?
en Does Hadley Centre Sea Surface Temperature Data (HADSST2) Underestimate Recent Warming?
![]()
![]()

-
Klimaskeptiker Info (Andreas Kreuzmann)
2010-11-27 de Hat das Hadley Centre die Meeresoberflächentemperatur wirklich unterschätzt?Bob Tisdale weist auf einen wesentlichen Fehler in den Behauptungen des Met Office hin
-
Watts Up With That? (Antony Watts)
2010-11-26 en Does Hadley Centre Sea Surface Temperature Data (HADSST2) Underestimate Recent Warming?
Guest post by Bob Tisdale
Quelle / Source
-
Climate Observations (Bob Tisdale )
2009-12-12 en Met Office Prediction: "Climate could warm to record levels in 2010"
But They Fail To Tell You Why
↑
k CRU Jones gibt zu: Nur 10 bis 20 % der Weltfläche zeigten Erwärmung!
en Even with the instrumental record,
the early and late 20th century warming periods are only significant
locally at between 10-20% of grid boxes.
-
EIKE Europäisches Institut für Klima und Energie
2010-01-03 de CimateGate Update 12, CRU Jones gibt zu: Nur 10 bis 20 % der Weltfläche zeigten Erwärmung!
Quelle / Source:
-
The below is one of a series of alleged emails from the Climate
Research Unit at the University of East Anglia, released on 20
November 2009.
2009-11-20 de East Anglia Confirmed Emails from the Climate Research Unit - 1047390562.txt
↑
l Die CRU-Daten werden andauernd geändert
en CRU Monthly Temperature is Constantly Changing
![]()
![]()

-
Klimaskeptiker Info (Andreas Kreuzmann)
2011-01-31 de Die CRU-Daten werden andauernd geändertWenn man sich mit der Klimadiskussion beschäftigt, stößt man unweigerlich auf die Temperaturdatenreichen, die die gemessenen Temperaturdaten zusammentragen und damit die Grundlage für das Erkennen und die Einschätzung der vermuteten Veränderungen bilden.
Diese Grundlage sollte, so möchte man meinen, konstant bleiben, sobald sie einmal ermittelt ist - schließlich ändern sich die Messungen nicht nachträglich.
Wenn man die Daten der im Zentrum des ClimateGate-Skandals stehenden Climatic research Unit (CRU) annsieht, wird diese Erwartung enttäuscht.
Ebenso wie beim GISS sind nachträgliche Veränderungen der Daten auch bei der CRU an der Tagesordnung.
-
Watts Up With That? (Antony Watts)
2011-01-31 en CRU's shifting sands of global surface temperature
Quelle / Source:
-
The Inconvenient Skeptic
2011-01-31 en CRU Monthly Temperature is Constantly ChangingThe longer I am involved in the global warming debate the more frustrated I am getting with the CRU temperature data.
This is the one of the most commonly cited sources of global temperature data, but the numbers just don't stay put.
Each and every month the past monthly temperatures are revised.
Since I enter the data into a spreadsheet each month I am constantly seeing the shift in the data.
If it was the third significant digit it wouldn't bother me (very much), but it is much more than that.
↑
m Gegen den Baum gefahren: Keith Briffa's fragwürdige
Temperaturrekonstruktionen in Sibirien
en Climategate Continues
-
Die kalte Sonne (Fritz Vahrenholt & Sebastian Lüning)
2012-05-25 de Gegen den Baum gefahren: Keith Briffa's fragwürdige Temperaturrekonstruktionen in Sibirien
-
EIKE Europäisches Institut für Klima und Energie
2012-06-01 de Baumring-Temperaturbestimmung: Die Summe von Yamal ist größer als die EinzelteileKlimagate, die Offenlegung von Fehlverhalten an der Universität von East Anglia war ein schwerer Schlag für den Ruf der Klimawissenschaft und vor allem für die britische und amerikanische Wissenschaft.
Obwohl dieses Thema in den letzten Monaten nicht mehr in den Nachrichten aufgetaucht war, kommen immer neue Beweise ähnlichen wissenschaftlichen Fehlverhaltens an das Tageslicht, zusammen mit einem neuen Skandal, der die Klima-Blogosphäre vor ein paar Tagen erreicht hat.
-
National Review Online
2012-05-24 en Climategate Continues
-
Watts Up With That? (Antony Watts)
2012-05-24 en The sum of Yamal is greater than its parts
⇧ 5 NOAA/NHDC, NOAA/GHCN (Climategate 1b)
-
a de
NOAA und NASA/GISS: Daten-Manipulation mit und von Wetterstationen
en NOAA and NASA/GISS: Data-Manipulation with and of Weather Stations
By 1990, NOAA had deleted from its datasets all but 1,500 of the 6,000
thermometersin service around the globe. - b de
NOAA will verfälschte Temperaturmessungen verschleiern
en A Remarkable Lie, from Your Taxpayer-Funded NOAA - c de
Teamwork: Zuerst USHCN und dann GISS
en Teamwork: First USHCN and then GISS
Contribution of USHCN and GISS bias in long-term temperature records
for a well-sited rural weather station - d de
Die angebliche Arktis-Erwärmung bei GHCN und GISS -
Ein Produkt der Datenmanipulation
en GHCN Temperature Adjustments Affect 40% Of The Arctic - e en Extreme UHI Fraud At NOAA
↑
a NOAA und NASA/GISS: Daten-Manipulation mit und von Wetterstationen
en
NOAA and NASA/GISS: Data-Manipulation with and of Weather Stations
fr
NOAA et NASA/GISS: Manipulation de données avec et de stations
météorologiques
By 1990, NOAA had deleted from its datasets all but 1,500 of the 6,000
thermometers in service around the globe.
NOAA/NCDA = National Oceanic and Atmospheric Administration / National Climate Data Center in Ashville, North Carolina
NASA/GISS = The National Aeronautics and Space Administration / Goddard Institute for Space Studies
|
|
|
|
|
|

ClimateGate: CRU war nur die Spitze des Eisbergs -
Datenmanipulation bei NOAA und GISS
'Kalte' Wetterstationen von
Klimadaten ausgeschlossen
en 'Cold' Weather Stations left out of Climate Data
fr Stations 'froides' exclus des données
de
-
EIKE Europäisches Institut für Klima und Energie
2010-01-25 de Sind auch die Temperaturdaten der USA gefälscht? -
EIKE Europäisches Institut für Klima und Energie
2010-01-15 de 'Kalte' Wetterstationen von Klimadaten ausgeschlossenVon mehr als 800 meteorologischen Bodenstationen sind die gemessenen Thermometerablesungen unangekündigt im Zeitraum von einem Jahr trotz der laufenden Klimastreitigkeiten aus den offiziellen globalen Aufzeichnungen entfernt worden.
Unsere Tatsachenfeststellungen sind in sehr großer Übereinstimmung mit jenen des Moskauer Instituts für Wirtschaftsanalyse (IEA), das vor kurzem die IPCC-Berichte der Wissenschaftler durchgesehen hat. Die Analyse der Russen fand heraus, dass die aus UN-Mitteln bezahlten Klimatologen Daten aus einem Gebiet, das mehr als 40 Prozent von Russland ausmacht, unberücksichtigt gelassen haben.
Jetzt ist aufgedeckt worden, dass ein Aussondern von weltweiten bodennahen Temperaturstationen heimlich zum ersten Mal im Jahre 1990 begann, gerade zwei Jahre nachdem die Zwischenstaatliche Kommission für Klimaänderung (IPCC) von den Vereinten Nationen gebildet worden war.
Bei der Zusammenstellung dieses Artikels sind wir nicht in der Lage gewesen, irgendeine Erklärung seitens der Vereinten Nationen oder der US-Regierung auf die Frage zu finden, warum es notwendig gewesen sei, 1714 Thermometer-Stationen einzumotten. Skeptische Forscher, solche wie Andrew Watts mit seiner Homepage WUWT (Watts Up With That), haben dies als eine Tragödie bezeichnet, welche die reichsten Nation auf dem Planeten in Verruf gebracht hat.
So erfolgreich ist Steve (McIntyre) bei dem Aufdecken solch raffinierter Verfahren gewesen, dass es eine offizielle Revision der US-Temperatur-Aufzeichnungen gab, wodurch gezeigt wurde, dass die 1930er Jahre das wärmste Jahrzehnt des 20. Jahrhunderts war - und nicht die 1990er Jahre wie die NASA (GISS) zu behaupten versuchte.
Jedoch der vierte IPCC-Bericht besteht immer noch darauf, dass die letzte Hälfte des 20. Jahrhunderts die wärmste Periode in den vergangenen 1300 Jahren gewesen sei (IPCC, 2007).
In den vergangenen Wochen hat es ernste Bedenken gegeben, dass auch die Datensätze für andere Länder einschließlich Australien und Neu-Seeland unethisch verbogen worden sind, um wärmere Temperaturen zu zeigen, als tatsächlich existierten,
Es gibt, wenn man die Zahlen von Satelliten und von den Ozeanen eng miteinander vergleicht, eine ständig zunehmende Anomalie im Trend der Bodenstationen, welche die IPCC gern als "homogenisiert" oder "wertberichtigt" bezeichnet, bevor sie den politischen Führungskräften und der Öffentlichkeit übergeben wurden.
Die größte Unstimmigkeit ist der Trend der "Erwärmung", der von den Bodenstationen im Zeitraum 1975 bis 2007 gezeigt wird.
-
Klimaskeptiker Info (Andreas Kreuzmann)
2010-01-22 de ClimateGate: CRU war nur die Spitze des Eisbergs - Datenmanipulation bei NOAA und GISS
de/en
-
KUSI / John Coleman
en/de
Global Warming: The Other Side
Der 4. Teil einer Spezialsendung des US-Wettermanns John Coleman. Erfahren Sie mehr über die zweifelhafte Datenbearbeitung der amerikanischen Klimaforscher von NASA-GISS.
BREAKING NEWS! Climategate comes to the United States!
Meet the two men who have dug through several layers of computer codes zo uncover manipulation of the world temperature data to support the claims of global warming. This is a major climate scandal invorving United States Government agencies.
A computer programmer named E. Michael Smith and a Certified Consulting Meteorologist named Joseph D'Aleo join the program to tell us about their breakthrough investigation into the manipulations of data at the NASA Goddard Science and Space Institute at Columbia University in New York and the NOAA National Climate Data Center in Ashville, North Carolina.
en
-
American Thinker
2010-01-22 en Climategate: CRU Was But the Tip of the IcebergNOAA - Data In / Garbage Out
We think NOAA is complicit, if not the real ground zero for the issue.
And their primary accomplices are the scientists at GISS, who put the altered data through an even more biased regimen of alterations, including intentionally replacing the dropped NOAA readings with those of stations located in much warmer locales.
Perhaps the key point discovered by Smith was that by 1990, NOAA had deleted from its datasets all but 1,500 of the 6,000 thermometers in service around the globe.
It seems that stations placed in historically cooler, rural areas of higher latitude and elevation were scrapped from the data series in favor of more urban locales at lower latitudes and elevations.
Consequently, post-1990 readings have been biased to the warm side not only by selective geographic location, but also by the anthropogenic heating influence of a phenomenon known as the Urban Heat Island Effect (UHI)
For example, Canada's reporting stations dropped from 496 in 1989 to 44 in 1991, with the percentage of stations at lower elevations tripling while the numbers of those at higher elevations dropped to one.
That's right: As Smith wrote in his blog, they left "one thermometer for everything north of LAT 65." And that one resides in a place called Eureka, which has been described as "The Garden Spot of the Arctic" due to its unusually moderate summers.
Smith also discovered that in California, only four stations remain - one in San Francisco and three in Southern L.A. near the beach - and he rightly observed that:
It is certainly impossible to compare it with the past record that had thermometers in the snowy mountains.
So we can have no idea if California is warming or cooling by looking at the USHCN data set or the GHCN data set.That's because the baseline temperatures to which current readings are compared were a true averaging of both warmer and cooler locations.
And comparing these historic true averages to contemporary false averages - which have had the lower end of their numbers intentionally stripped out - will always yield a warming trend, even when temperatures have actually dropped.
Overall, U.S. online stations have dropped from a peak of 1,850 in 1963 to a low of 136 as of 2007.
In his blog, Smith wittily observed that "the Thermometer Langoliers have eaten 9/10 of the thermometers in the USA including all the cold ones in California."
But he was deadly serious after comparing current to previous versions of USHCN data and discovering that this "selection bias" creates a +0.6°C warming in U.S. temperature history.
And no wonder -- imagine the accuracy of campaign tracking polls were Gallup to include only the replies of Democrats in their statistics.
But it gets worse.
Prior to publication, NOAA effects a number of "adjustments" to the cherry-picked stations' data, supposedly to eliminate flagrant outliers, adjust for time of day heat variance, and "homogenize" stations with their neighbors in order to compensate for discontinuities.
This last one, they state, is accomplished by essentially adjusting each to jibe closely with the mean of its five closest "neighbors."
But given the plummeting number of stations, and the likely disregard for the latitude, elevation, or UHI of such neighbors, it's no surprise that such "homogenizing" seems to always result in warmer readings.
GISS - Garbage In / Globaloney Out
The scientists at NASA's GISS are widely considered to be the world's leading researchers into atmospheric and climate changes.
And their Surface Temperature (GISTemp) analysis system is undoubtedly the premiere source for global surface temperature anomaly reports.
In creating its widely disseminated maps and charts, the program merges station readings collected from the Scientific Committee on Antarctic Research (SCAR) with GHCN and USHCN data from NOAA.
It then puts the merged data through a few "adjustments" of its own.
First, it further "homogenizes" stations, supposedly adjusting for UHI by (according to NASA) changing "the long term trend of any non-rural station to match the long term trend of their rural neighbors, while retaining the short term monthly and annual variations."
Of course, the reduced number of stations will have the same effect on GISS's UHI correction as it did on NOAA's discontinuity homogenization - the creation of artificial warming.
Furthermore, in his communications with me, Smith cited boatloads of problems and errors he found in the Fortran code written to accomplish this task, ranging from hot airport stations being mismarked as "rural" to the "correction" having the wrong sign (+/-) and therefore increasing when it meant to decrease or vice-versa.
And according to NASA, "If no such neighbors exist or the overlap of the rural combination and the non-rural record is less than 20 years, the station is completely dropped; if the rural records are shorter, part of the non-rural record is dropped."
However, Smith points out that a dropped record may be "from a location that has existed for 100 years."
For instance, if an aging piece of equipment gets swapped out, thereby changing its identification number, the time horizon reinitializes to zero years.
Even having a large enough temporal gap (e.g., during a world war) might cause the data to "just get tossed out."
But the real chicanery begins in the next phase, wherein the planet is flattened and stretched onto an 8,000-box grid, into which the time series are converted to a series of anomalies (degree variances from the baseline).
Now, you might wonder just how one manages to fill 8,000 boxes using 1,500 stations.
Here's NASA's solution:
For each grid box, the stations within that grid box and also any station within 1200km of the center of that box are combined using the reference station method.
...
-
Joseph D'Aleo
en
Climategate: Leaked Emails Inspired Data Analyses Show Claimed Warming
Greatly Exaggerated and NOAA not CRU is Ground Zero
-
John O Sullivan
2009-12-29 en 'Cold' Weather Stations left out of Climate Data
2009-12-29 en
'Cold' Weather Stations left out of Climate Data
-
Musings from the Chiefio
2009-10-19 en How to Cook a Temperature History
-
An Honest Climate Debate
2009-02-20 en Satellite Data Show No Warming Before 1997. Changes Since Not Related to CO2
-
An Honest Climate Debate
2009-02-20 en Satellite Data Show No Warming Before 1997. Changes Since Not Related to CO2
↑
b NOAA will verfälschte Temperaturmessungen verschleiern
en
A Remarkable Lie, from Your Taxpayer-Funded NOAA
-
Klimaskeptiker Info (Andreas Kreuzmann)
2010-06-13 de NOAA will verfälschte Temperaturmessungen verschleiern
-
Pajamas Media
2010-06-12 en A Remarkable Lie, from Your Taxpayer-Funded NOAA
↑
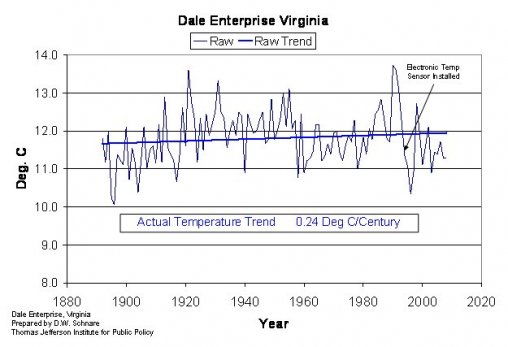
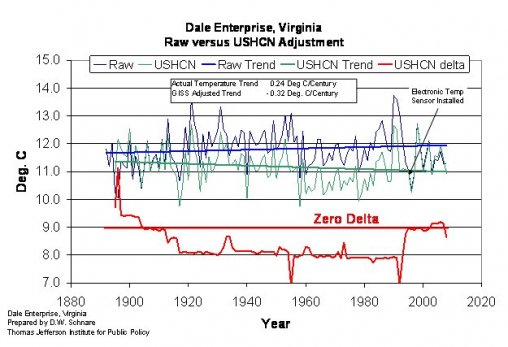
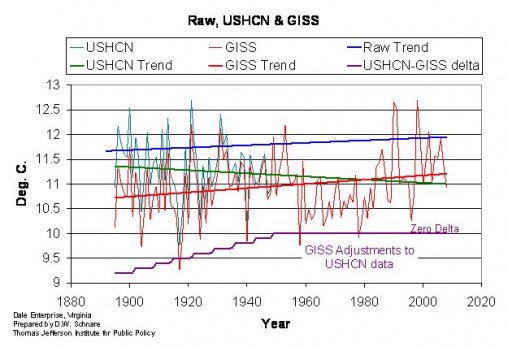
c Teamwork: Zuerst USHCN und dann GISS
en Contribution of USHCN and GISS bias in
long-term temperature records for a well-sited rural weather station
fr D'abord USHCN et après GISS
UNHCN = United States Historical Climatology Network
Long-Term Daily and Monthly Climate Records from Stations Across the Contiguous United States.
The United States Historical Climatology Network (USHCN) is a high quality data set of daily and monthly records of basic meteorological variables from 1218 observing stations across the 48 contiguous United States.
|
1 Raw data from the Dale Enterprise station. |
|
|
2 Changes NCDC made to the original observations |
3 The GISS Adjustment to the USHCN data set |

-
EIKE Europäisches Institut für Klima und Energie
2010-04-26 de Die Beiträge des USHCN und GISS zum Fehler der vieljährigen Temperaturaufzeichnung einer Wetterstation auf dem Lande
-
Watts Up With That? (Antony Watts)
2010-02-26 en Contribution of USHCN and GISS bias in long-term temperature records for a well-sited rural weather station
↑
d Die angebliche Arktis-Erwärmung bei GHCN und GISS -
Ein Produkt der Datenmanipulation
en
GHCN Temperature Adjustments Affect 40% Of The Arctic
NOAA/GHCN = National Oceanic and Atmospheric Administration / National Climatic Data Center
NASA/GISS = National Aeronautics and Space Administration / Goddard Institute for Space Studies
de Die Erwärmung der Arktis stammt also zu einem deutlichen Teil aus den Manipulationen beim GHCN.
Um das Jahr 1940 waren die Temperaturen in der Arktis auf dem gleichen Niveau wie in den letzten Jahren.
Diese historische Tatsache wird durch die GHCN-Anpassungen ("Adjustments") aus den Daten entfernt.
en
By cooling the past, the century scale trend of warming is increased -
making it "worse than we thought"
![]()
![]()

|
|
|
-
Klimaskeptiker Info
2012-03-11 de Die angebliche Arktis-Erwärmung bei GHCN und GISS - Ein Produkt der Datenmanipulation
-
Watts Up With That? (Antony Watts)
2012-03-11 en Another GISS miss: warming in the Arctic - the adjustments are key
Quelle / Source:
-
NOT A LOT OF PEOPLE KNOW THAT (Paul Homewood)
2012-03-11 en GHCN Temperature Adjustments Affect 40% Of The Arctic
↑ en e Extreme UHI Fraud At NOAA
-
Real Science
2016-02-11 en Extreme UHI Fraud At NOAA
⇧ 6 NOAA-Satellitengate / NOAA-Satellitegate
- a de
US Regierung in Erwärmungs Skandal verwickelt - NOAA Blamiert
en US Government in Massive New Global Warming Scandal - NOAA Disgraced - b de
Globaltemperatur zu hoch? NOAA (amerik. Wetterbehörde) bestätigt:
Globale Erwärmung der Dekade wg. defektem Satelliten zweifelhaft
en Leading US Physicist Labels Satellitegate Scandal a 'Catastrophe'
↑
a US Regierung in Erwärmungs Skandal verwickelt - NOAA Blamiert
en US Government in Massive New Global Warming
Scandal - NOAA Disgraced
-
Climate Change Fraud
2010-08-09 en US Government in Massive New Global Warming Scandal - NOAA DisgracedGlobal warming data apparently cooked by U.S. government-funded body shows astounding temperature fraud with increases averaging 10 to 15 degrees Fahrenheit.
The tax-payer funded National Oceanic and Atmospheric Administration (NOAA) has become mired in fresh global warming data scandal involving numbers for the Great Lakes region that substantially ramp up averages.
↑
b Globaltemperatur zu hoch? NOAA (amerik. Wetterbehörde) bestätigt:
Globale Erwärmung der Dekade wg. defektem Satelliten zweifelhaft
en Leading US Physicist Labels Satellitegate Scandal a 'Catastrophe'
-
EIKE Europäisches Institut für Klima und Energie
2010-08-20 de Globaltemperatur zu hoch? NOAA (amerik. Wetterbehörde) bestätigt: Globale Erwärmung der Dekade wg. defektem Satelliten zweifelhaft! Teil IDie US-Regierung bestätigt die "Abschwächung" der vom Satellit gemessenen Temperaturdaten.
In einer Schockreaktion wurden alle Daten offline gesetzt.
Die Temperaturwerte der globalen Erwärmung könnten lokal 5 bis 8 °C zu hoch sein.
2010-08-21 de Teil II
-
Canada Free Press
2010-08-16 en Top Climate Scientists Speak out on the Satellitegate ScandalUS Government admits global warming satellite sensors "degraded" - temperatures may be out by 10-15 degrees.
Now five satellites in controversy. Top scientists speak out.
2010-08-19 en Leading US Physicist Labels Satellitegate Scandal a 'Catastrophe'
Respected American physicist, Dr Charles R. Anderson has waded into the escalating Satellitegate controversy publishing a damning analysis on his blog.
In a fresh week of revelations when NOAA calls in their lawyers to handle the fallout, Anderson adds further fuel to the fire and fumes against NOAA, one of the four agencies charged with responsibility for collating global climate temperatures.
NOAA is now fighting a rearguard legal defense to hold onto some semblance of credibility with growing evidence of systemic global warming data flaws by government climatologists.
NOAA Systemically Excised Data with 'Poor Interpolations'
Anderson, a successful Materials Physicist with his own laboratory, has looked closely at the evidence uncovered on NOAA.
He has been astonished to discover, "Both higher altitudes and higher latitudes have been systematically removed from the measured temperature record with very poor and biased interpolated results taking their place."
This whole global temperature business looks like a complete joke to me.
NOAA Proven to have engaged in Long-term Cover Up
My investigations are increasingly proving that such data was flagged by non-NOAA agencies years ago, but NOAA declined to publish notice of the faults until the problem was publicized loudly and widely in my first 'satellitegate' article, "US Government in Massive New Global Warming Scandal".
Official explanations initially dismissed my findings.
But then NOAA conceded my story was accurate in the face of the evidence.Subsystem Summary Details Censored Between 2005-10
But even more sinister is the fact that the official online summary now only shows events recorded up to 2005.
All subsequent notations, that was on NOAA's web pages last week and showed entries inclusive to summer 2010, have now been removed.Dr. Anderson sums up saying; "It is now perfectly clear that there are no reliable worldwide temperature records and that we have little more than anecdotal information on the temperature history of the Earth."
⇧ 7 NOAA Korrekturen
- a de
Wärmegehalt der Ozeane ist geringer als bisher gedacht
en Ocean Heat Content Adjustments: Follow-up and More Missing Heat - b de
NOAA in Not: Erwärmungspause der letzten 15 Jahre lässt sich nicht
so einfach wegtricksen
en NOAA erases 'pause' in warming - c en Black Swan Climate Theory
- d de
NOAA versteckt die Rohdaten hinter einem Viertel-Millionen-Dollar
Schutzwall
en NOAA demands $262,000 fee for looking at their 'public' data - e en Robust Evidence NOAA Temperature Data Hopelessly Corrupted By Warming Bias, Manipulation
- f de
NOAA-Datenmanipulation um 1,4°C:
"Schlimmer kann Wissenschaft nicht degenerieren"
en NOAA 2.5 Degrees F Data Tampering - 'Science Doesn't Get Any Worse Than This'
↑
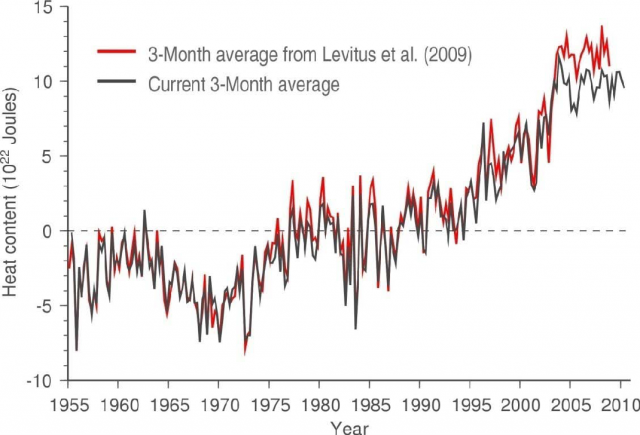
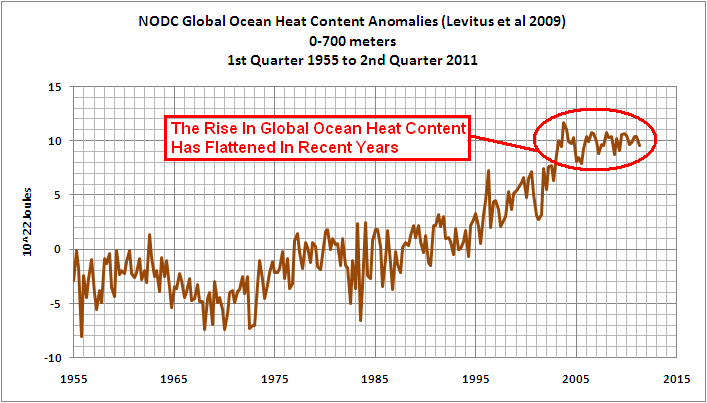
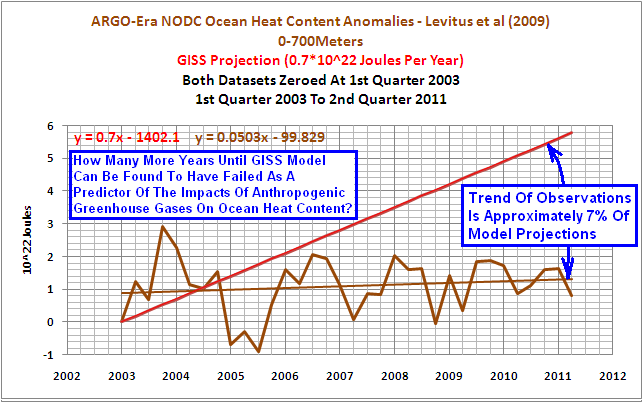
a Wärmegehalt der Ozeane ist geringer als bisher gedacht
en
Ocean Heat Content Adjustments: Follow-up and More Missing Heat
![]()
![]()
-
Klimaskeptiker Info
2011-03-20 de Wärmegehalt der Ozeane ist geringer als bisher gedacht
-
Watts Up With That? (Antony Watts)
2011-03-20 en Ocean Heat Content Adjustments: Follow-up and More Missing Heat
Update
![]()
![]()
![]()
![]()
-
Watts Up With That? (Antony Watts)
2011-09-18 en Trenberth's missing heat? Look to the deep
↑
b NOAA in Not: Erwärmungspause der letzten 15 Jahre lässt sich nicht
so einfach wegtricksen
en NOAA erases 'pause' in warming
2015: NOAA Data Tampering Since Last Year
|
|
|

-
Die kalte Sonne (Fritz Vahrenholt & Sebastian Lüning)
2015-12-09 de IPCC-Autor Gerald Meehl verurteilt fragwürdige Rettungsaktionen von Klimaaktivisten zur Erwärmungspause: Der Hiatus ist real und ist erklärungsbedürftig2015-07-02 de NOAA in Not: Erwärmungspause der letzten 15 Jahre lässt sich nicht so einfach wegtricksen
2015-06-15 de Max Planck Gesellschaft: "Die Temperaturen stagnieren ungefähr seit 1998, wenn auch auf hohem Niveau"
-
Watts Up With That? (Antony Watts)
2015-06-09 en Climate scientists criticize government paper (Karl et al. 2015) that erases 'pause' in warmingUntil last week, government data on climate change indicated that the Earth has warmed over the last century, but that the warming slowed dramatically and even stopped at points over the last 17 years.
National Oceanic and Atmospheric Administration has readjusted the data
But a paper released May 28 by researchers at the National Oceanic and Atmospheric Administration has readjusted the data in a way that makes the reduction in warming disappear, indicating a steady increase in temperature instead.
But the study's readjusted data conflict with many other climate measurements, including data taken by satellites, and some climate scientists aren't buying the new claim.
"While I'm sure this latest analysis from NOAA will be regarded as politically useful for the Obama administration, I don't regard it as a particularly useful contribution to our scientific understanding of what is going on," Judith Curry, a climate science professor at Georgia Tech, wrote in a response to the study.
"The new NOAA dataset disagrees with a UK dataset, which is generally regarded as the gold standard for global sea surface temperature datasets," she said.
"The new dataset also disagrees with ARGO buoys and satellite analyses."
-
EIKE Europäisches Institut für Klima und Energie
2016-01-24 de Die "Karlisierung" der Temperatur der Erde
-
Watts Up With That? (Antony Watts)
2016-01-21 en The 'Karlization' of Earth's Temperature
-
Gerald A. Meehl, National Center for Atmospheric Research
2015 en
Decadal climate variability and the early-2000s hiatus
-
Die kalte Sonne (Fritz Vahrenholt & Sebastian Lüning)
Frank Bosse und Fritz Vahrenholt
2016-02-09 de Die Sonne im Januar 2016, Rekorde und Ozeanströmungen: Der Golfstrom bleibt stabil!Das Rekordjahr 2015 und was dazu beitrug
Das Jahr 2015 endete mit einem Rekordwert: Die Temperaturreihe GISS verzeichnete +0,87 °C Anomalie gegenüber dem Referenzzeitraum 1951-1981.
Dies waren nochmals 0,13°C mehr als im Vorjahr 2014 global festgestellt wurde. Besonders stark stiegen die Ozeantemperaturen an.
Ein Blick zurück auf einen nur wenige Monate älteren Datensatz GISS vom Mai 2015 zeigt, dass die globalen Mitteltemperaturen 2014 damals noch um 0,06°C geringer angezeigt wurden als im Januar 2016.
Wie kann das sein? Im Sommer 2015 wurde eine Korrektur der Meerestemperaturen eingeführt, wir hatten u.a. hier darüber berichtet.
Der Auslöser:
Die Messmethoden zur Erfassung der Oberflächentemperaturen der Meere (SST- Sea Surface Temperature) änderten sich ab 1998.Wurden früher die SST von Schiffen aus bestimmt, oft indem die Wassertemperatur in Eimern oder über das angesaugte Kühlwasser gemessen wurde, ging man später zu präziseren Bojenmessungen über.
Dieser Übergang trug, so die Wissenschaftler um T. Karl von der NOAA, eine negative Verfälschung ein, die man mit Korrekturen (für die offensichtlich zu warmen Messungen der Vergangenheit nach unten, für die präzisen Messungen der Gegenwart nach oben) minimierte.
Diese Maßnahme wurde sehr schnell für die globalen Bodentemperatur-Reihen übernommen.
Es gibt hierfür nicht nur Beifall in der Fachwelt, wie unser Artikel "IPCC-Autor Gerald Meehl verurteilt fragwürdige Rettungsaktionen von Klimaaktivisten zur Erwärmungspause: Der Hiatus ist real und ist erklärungsbedürftig" zeigte.
Es erscheint recht fragwürdig, gute neuere Bojenmessungen nach oben zu verändern, um sie an die schlechten alten Eimermessungen anzupassen.
...
 NOAA in Not: Erwärmungspause der letzten 15 Jahre lässt sich nicht so
einfach wegtricksen
NOAA in Not: Erwärmungspause der letzten 15 Jahre lässt sich nicht so
einfach wegtricksen
Update: University of Alabama in Huntsville (UAH) lehnt fragwürdige Veränderungen am RSS-Satelliten-Temperaturdatensatz abEinfluss des El Nino
Einen deutlich höheren Einfluss auf die weltweiten Temperaturen sehen Sie in Abb. 4 im äquatorialen Pazifik: den bereits im November 2015 voll entwickelten ElNino.
Über die Entstehung und den Verlauf dieser internen Variabilität unseres Klimas hatten wir hier berichtet.
Bereits im Jahre 2014 kündigte er sich an, zumindest bis zum Mai.
Ab Anfang August 2014 war er abgesagt, wie wir hier meldeten.
Nun also kam er mit einiger Wucht in 2015 und bescherte den globalen Temperaturen im Jahr 2015 im Mittel einen Anstieg von ca. 0,09 °C.
Das viele rot in Abb. 4 hinterließ seine Spuren in den Troposphären-und Bodentemperaturen.
Alle genannten Beiträge zum Rekord in Summe belaufen sich auf ca. 0,16°C. Nach GISS hätten wir dann etwa die globalen Temperaturen des Vorjahres.
Der Rekord in 2015 ist also zu ganz großen Teilen auf natürliche Variabilität
und eine umstrittene Korrektur von Messdaten größtenteils der Vergangenheit zurückzuführen,
die die Trends ansteigen ließ, gewissermaßen "on top" auf die klimatische Entwicklung.
Im Übrigen zeigen die Satellitenmessungen der Troposphäre keinen Rekordanstieg : beide Messreihen, sowohl UAH als auch RSS, geben 2015 nur als drittwärmstes Jahr seit 1979 an.
Dass die Troposphärentemperaturen langsamer steigen als die Bodentemperaturen ist ein Sachverhalt, den die Klimamodelle nicht reproduzieren. Sie erwarten es genau anders herum.
...
Was erwarten wir von 2016?
Zunächst werden die Temperaturen weiter hoch bleiben.
Die Wärme des ElNino ist noch vorhanden: Sie schlägt sich in verstärkter Wolkenbildung im Ostpazifik nieder. Diese latente Wärme wird erst später in den Weltraum abgestrahlt.
Der ganze Vorgang sollte noch etwa 4-5 Monate dauern,
dann werden die globalen Temperaturen sinken.
Es kündigt sich dann nämlich eine LaNina an. Dies ist nicht etwa das Gegenteil eines ElNino mit seiner Strömungsumkehr.
Vielmehr sind es "verstärkte Normalbedingungen".
Die Passatwinde wehen heftiger als normal und fördern sehr viel kühles Tiefenwasser vor Südamerika an die Oberfläche.
Dadurch wird ein Teil des erwärmten Wassers eines ElNino wieder in die Tiefe vor Indonesien verfrachtet und in die Oberflächentemperaturen geht eine große Kaltwasserfläche im äquatorialen Teil des Pazifiks ein.
In die globalen Temperaturen wird dieser doch recht heftige Umschwung sehr wahrscheinlich erst in 2017 voll durchschlagen.
Für klimatische Einschätzungen wird es so auch in 2017 noch zu früh sein, denn erst nach der zu erwartenden LaNina wird sich ein "neutrales Niveau" einstellen.
Wo das liegt ist noch unbestimmt.
Entwarnung im Atlantik
Erinnern Sie sich noch an die medial so "ausführlich" ausgeschlachteten Meldungen vom Frühjahr 2015, dass sich der Golfstrom dramatisch abgeschwächt hat durch das Schmelzen des Grönlandeises?
Wir hatten uns hier sehr kritisch mit einer Arbeit (Rahmstorf 2015) von Stefan Rahmstorf vom PIK und Kollegen auseinandergesetzt, die den neuerlichen Hype auslöste.
Die Süddeutsche Zeitung beispielsweise vermied das Wort "Katastrophe", zitierte jedoch die Autoren, die ihrer Besorgnis Ausdruck verliehen, dass stark reduzierte Atlantikströme "massive Folgen" für Mensch und Umwelt haben, ergänzten die Forscher.
Die Ökosysteme in den Meeren könnten gestört werden, was die Fischerei und die Lebensgrundlage vieler Menschen entlang der Küsten treffe.
Auch trügen Veränderungen zu einem regionalen Meeresspiegelanstieg etwa in den US-Städten New York und Boston bei.
Zudem seien auch Wetterveränderungen sowohl in Nordamerika als auch in Europa denkbar."
Im Januar 2015 erschien nun eine Arbeit von Parker & Ollier, die die Schlüsse von Rahmstorf2015 entschieden zurückweist.
Wie wir in unserem Artikel damals schon zeigten hatte Rahmstorf 2015 einen Stellvertreter ("Proxy") für die Stärke der AMOC (Atlantic Meridional Overturning Circulation, der Wärmetransport nach Norden) verwendet, der bei näherer Betrachtung offensichtlich Schwierigkeiten mit der Kausalität hatte: er reagierte auf AMOC- Veränderungen bevor diese eintraten.
Die Autoren der widerlegenden Arbeit um Albert Parker von der James Cook- Universität in Townsville, Australien verwendeten einen vertrauenserweckenden Parameter, der auch kürzere Schwankungen der AMOC gut abbildet.
-
EIKE Europäisches Institut für Klima und Energie
Klaus-Eckart Puls
2016-02-17 de Klima-Fakten 2015/16Das Jahr 2015 wurde von den Klima-Alarmisten in bewährtem engen Schulterschluß mit den deutschen(!) Medien zum "wärmsten Jahr aller Zeiten" und zum "endgültigen Klimasignal" hoch gejubelt. Jedoch - die Nachprüfung zeigt:
Es war ein so genannter "Super-El-Nino",
der die Temperatur trieb - wie zuletzt 1998. Eine nahezu verzweifelte Aktion, um nach 18 Jahren der Temperatur-Stagnation eine angeblich anthropogen verursachte Klima-Katastrophen-Hypothese zu retten, anhand eines einzigen Jahres.
Alle anderen Parameter machen auch nicht mit:
Weder die Stürme, noch die Sturmfluten, noch der Meeres-Anstieg!
EIKE Europäisches Institut für Klima und Energie
Quang M. Nguyen, P.E.
2016-02-16 de Wärmer, noch wärmer, am wärmsten - NOAA und NASA erwischt mit der Manipulation der AufzeichnungenFAZIT
Wie so häufig von den Mainstream-Medien seit April 2015 wiederholt, erklärten NOAA und NASA offiziell, dass 2015 heißer als 2014 war, das alte wärmste Jahr der Aufzeichnungen und "versprechen", dass 2016 heißer als 2015 sein könnte!
Jedoch, unleugbare Beweise zeigen, dass die von NOAA und der NASA berechneten durchschnittlichen globalen Temperaturen ungenau, unzuverlässig und nicht mit den Satellitendaten konsistent erscheinen.
1997 war das heißeste Jahr
Laut Daten der NOAA Website, war 1997 wirklich das heißeste Jahr der Aufzeichnung mit 16,9°C (62.45°F).
Die globale Durchschnittstemperatur im Jahr 2015 betrug 14,8°C (58.62°F) oder 2,12K (3.83F) von unter der Temperatur 1997. [... und unter der "Normal" Temperatur von 15°C gemäß PIK u.ä., der Übersetzer]
Nach den Daten der NOAA Website, haben die Parameter wie beispielsweise die Durchschnittstemperatur des 20. Jahrhunderts und der jährlichen Temperaturanomalien, die konstant sein müssten, unterschiedliche Werte in den jährlichen globalen Analysen.
Korrigierte historische Temperaturdaten
NOAA und NASA korrigierten historische Temperaturdaten und stellten Temperaturdaten in Gebieten ohne Temperaturaufzeichnung systematisch her, weit verbreitet und unidirektional zum "kühlen" der Vergangenheit, in dem Versuch, einen steigenden Temperaturtrend zu beweisen.
NOAA und NASAm diskreditieren ihre eigenen Satellitendaten.
NOAA und der NASA haben Anstrengungen unternommen, um ihre eigenen Satellitendaten zu diskreditieren - die im Einklang mit dem Ballon Daten sind - weil eine globale Erwärmung Pause seit 1998 im Widerspruch mit der von NOAA und der NASA bevorzugten Behauptung steht.
NOAA und NASA weigern sich die angeforderten Daten heraus zugeben
NOAA und NASA haben sich geweigert, die durch das US-Repräsentantenhaus für Wissenschaft, Weltraum und Technologie angeforderten Daten und Informationen heraus zugeben.
Es gibt keinen Grund für sie die Daten und Informationen, die öffentlich zugänglich sind, zurückzuhalten, es sei denn, sie haben etwas zu verbergen.
↑ c en Black Swan Climate Theory
In this five part video series, Engineering Physicist Michael W. Brakey discusses the corrupt data being provided by the National Oceanic and Atmospheric Association in order to promote the theory of Global Warming.
![]()
![]() "Get Out Of Adjusting Business !
"Get Out Of Adjusting Business !
Grün/Green (local source): Lewiston-Auburn area of Maine
Schwarz/Black (NOAA 2013): Maine's overall state
Blau/Blue (NOAA 2014)
(3° Fahrenheit ≅ 1,5° Celsius)
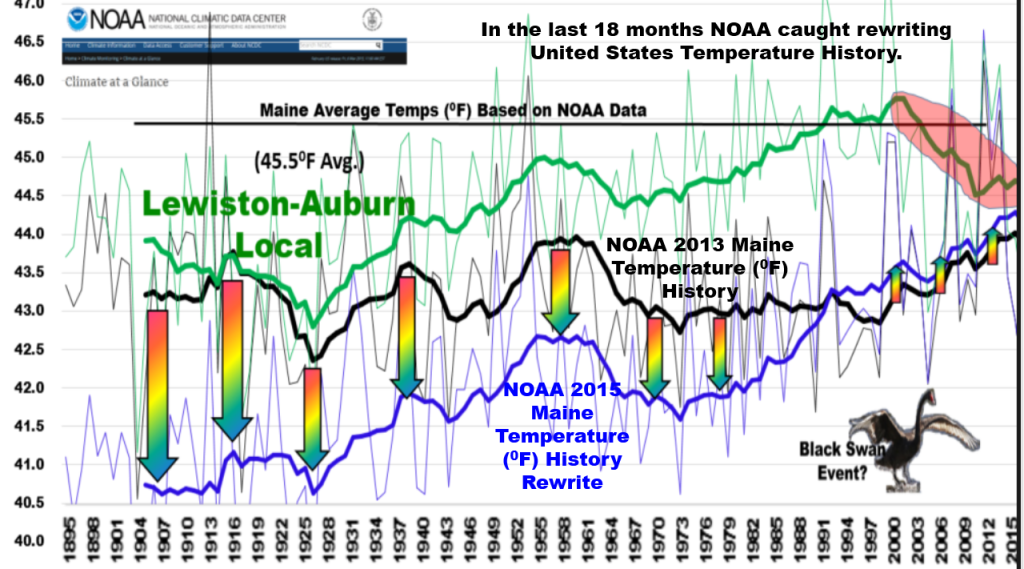
-
EIKE Europäisches Institut fü Klima und Energie
2015-05-12 de Black Swan Climate Theory
-
NoTricksZone (Pierre L. Gosselin)
2015-05-09 en Energy Physicist Implores NOAA To Return To Credibility "Get Out Of Adjusting Business !
-
NoTricksZone (Pierre L. Gosselin)
2015-06-01 en Bombshell: Comprehensive Analysis Reveals NOAA Wrongfully Applying "Master Algorithm" To Whitewash Temperature History
-
NoTricksZone (Pierre L. Gosselin)
2015-07-07 en NOAA's Data Debacle ... Alterations Ruin 120 Years Of Painstakingly Collected Weather Data (Part 2/2)
↑
d NOAA versteckt die Rohdaten hinter einem Viertel-Millionen-Dollar
Schutzwall
en
NOAA demands $262,000 fee for looking at their 'public' data
-
Die kalte Sonne (Fritz Vahrenholt & Sebastian Lüning)
2015-04-17 de Verdacht auf Temperaturdatenmanipulation: NOAA versteckt die Rohdaten hinter einem antklimatischen Viertel-Millionen-Dollar Schutzwall
-
Watts Up With That? (Antony Watts)
2015-03-27 en Outrageous: NOAA demands $262,000 fee for looking at their 'public' data
↑ e en Robust Evidence NOAA Temperature Data Hopelessly Corrupted By Warming Bias, Manipulation
-
NoTricksZone (Pierre L. Gosselin)
Kenneth Richard
2017-01-30 en Robust Evidence NOAA Temperature Data Hopelessly Corrupted By Warming Bias, ManipulationDr. Thomas Karl recently retired as Director of the National Oceanic and Atmospheric Administration (NOAA).
In 1989, Karl's stated position was that global temperatures cooled between 1921 and 1979.
"Analysis of warming since 1881 shows most of the increase in global temperature happened before 1919 - before the more recent sharp rise in the amount of carbon dioxide in the atmosphere, said Thomas Karl of the National Oceanic and Atmospheric Administration's National Climatic Data Center in Asheville, N.C.
While global climate warmed overall since 1881, it actually cooled from 1921 to 1979, Karl said."
Today, not only has the 1921-1979 cooling disappeared from NOAA's official temperature record,
it has been replaced by a +0.45°C warming trend during that nearly 60-year period.
Conclusion
The global temperature dataset available from NOAA suffers from massive and uncorrected warm biases (as preferred by its purveyors), woefully inadequate contemporary measurement coverage, and even worse historical coverage (with inherently non-uniform data collection methodologies).
Consequently, a substantial portion of the temperature data available from NOAA should be regarded as artificial and untrustworthy.
Those who faithfully uphold NOAA's global temperature dataset as "truth" will need to address its demonstrable speciousness - and why they are inclined to believe in it anyway.
↑
f NOAA-Datenmanipulation um 1,4°C:
"Schlimmer kann Wissenschaft nicht degenerieren"
en
NOAA 2.5 Degrees F Data Tampering -
'Science Doesn't Get Any Worse Than This'
![]()
![]() Man beachte die blauen tatsächlichen Messungen: Kaum Erwärmung.
Man beachte die blauen tatsächlichen Messungen: Kaum Erwärmung.
Dann betrachte man die in rot dargestellten adjustierten Daten:
so sollte ein globaler Erwärmungstrend aussehen.
Ein globaler Fake-Erwärmungstrend, heißt das.
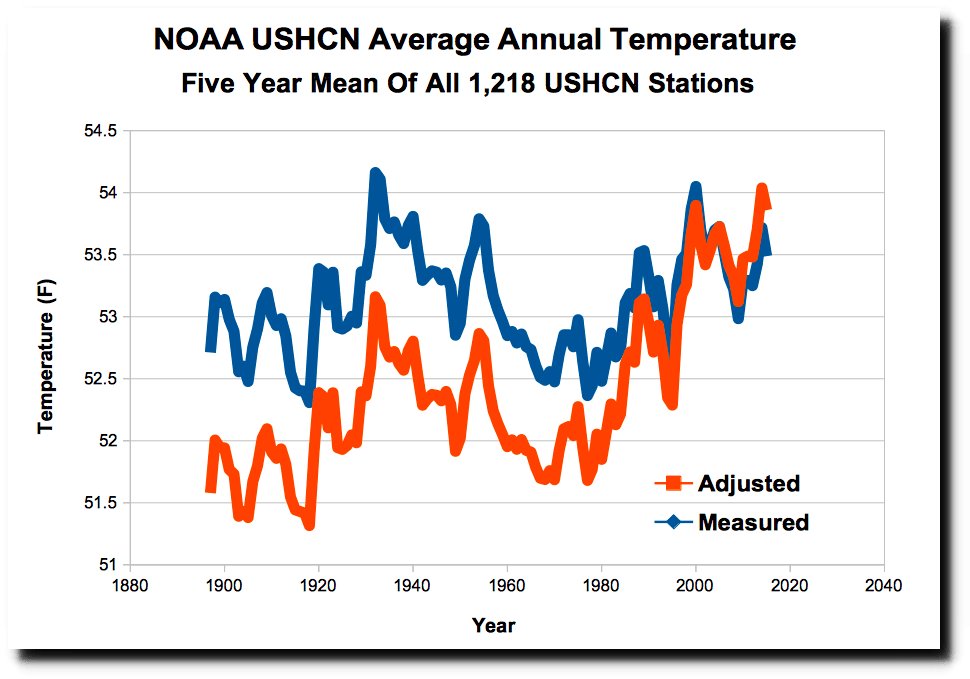
-
EIKE Europäisches Institut für Klima und Energie
James Delingpole / Chris Frey
2018-03-28 de NOAA-Datenmanipulation um 1,4°C: "Schlimmer kann Wissenschaft nicht degenerieren"Die Datenmanipulationen bei der NOAA sind sogar noch viel schlimmer als wir bisher dachten:
Während des vorigen Jahrhunderts wurde die "globale Erwärmung" in den USA um bis zu 1,4°C* übertrieben!Mit anderen Worten, so gut wie die gesamte, von den Torwächtern der weltweit führenden Temperaturaufzeichnungen "gemessene" Erwärmung könnte ein Fake sein.
-
Breitbart James Delingpole
2018-03-21 en Delingpole: NOAA 2.5 Degrees F Data Tampering - 'Science Doesn't Get Any Worse Than This'The data tampering at National Oceanic and Atmospheric Administration (NOAA) is even worse than we thought:
over the last century it has exaggerated "global warming" in the U.S. by as much as 2.5 degrees F.In other words, pretty much the entirety of the 20th century warming in the U.S. "measured" by the world's primary temperature record gatekeeper may be fake.
Quelle / Source:
-
The Deplorable Climate Science Blog / Tony Heller
2018-03-20 en NOAA Data Tampering Approaching 2.5 Degrees FNOAA's US temperature record shows that US was warmest in the 1930's and has generally cooled as CO2 has increased.
This wrecks greenhouse gas theory, so they "adjust" the data to make it look like the US is warming.

 Science doesn't get any worse than how NOAA handles US
temperature data.
Science doesn't get any worse than how NOAA handles US
temperature data.
NASA uses the NOAA data as the basis for their temperature graphs, which have also been massively altered to turn cooling into warming.
⇧
8 NOAA & NASA/GISS verändern RSS-Daten
en
NOAA & NASA/GISS RSS modifications
↑ a University of Alabama in Huntsville (UAH) lehnt fragwürdige Veränderungen am RSS-Satelliten-Temperaturdatensatz ab
![]()
![]() Globale Temperaturentwicklung seit 1980 laut RSS.
Globale Temperaturentwicklung seit 1980 laut RSS.
In schwarz die Original-Version,
in blau die nachjustierte Kurve.
Graphik aus Mears & Wentz 2016.

![]()
![]() Vergleich der Temperaturentwicklung
Vergleich der Temperaturentwicklung
nach modifizierten RSS-Daten (rot)
und den UAH-Daten (blau).
Quelle: Webseite von Roy Spencer.
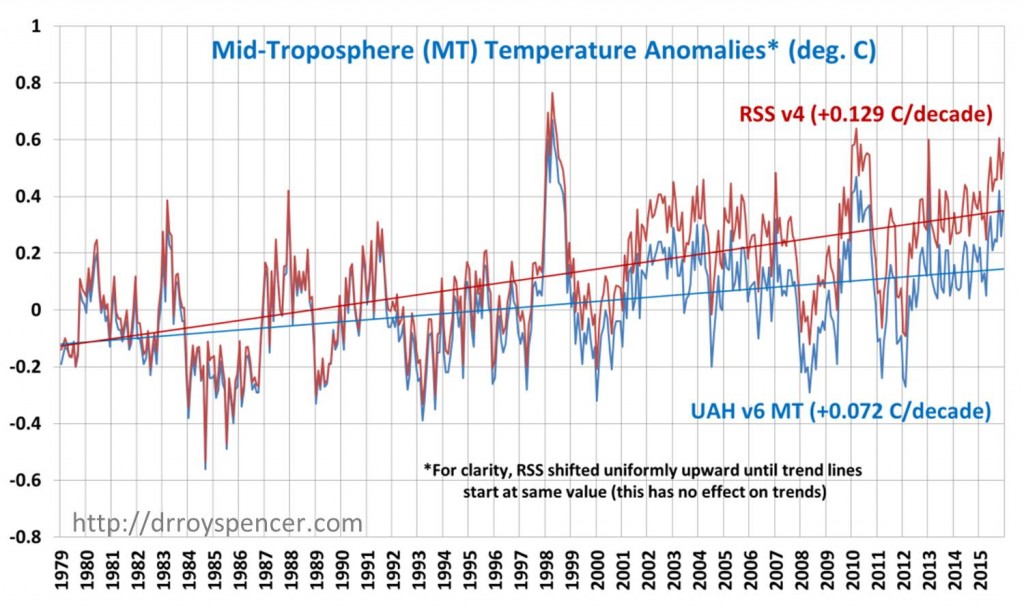
-
Die kalte Sonne (Fritz Vahrenholt & Sebastian Lüning)
2016-03-21 de University of Alabama in Huntsville (UAH) lehnt fragwürdige Veränderungen am RSS-Satelliten-Temperaturdatensatz ab
Update: University of Alabama in Huntsville (UAH) lehnt fragwürdige Veränderungen am RSS-Satelliten-Temperaturdatensatz ab
| John R. Christy |
He is the Distinguished Professor of Atmospheric Science and
Director of the Earth System Science Center at the University
of Alabama in Huntsville. He was appointed Alabama's State Climatologist in 2000. For his development of a global temperature data set from satellites he was awarded NASA's Medal for Exceptional Scientific Achievement, and the American Meteorological Society's "Special Award." In 2002. Christy was elected Fellow of the American Meteorological Society. ▶John R. Christy: Who is who (Skeptiker) ▶John R. Christy: Video (Präsentationen) |
| Roy W. Spencer |
Ph.D. is a principal research scientist for the University of Alabama
in Huntsville and the U.S. Science Team Leader for the Advanced
Microwave Scanning Radiometer (AMSR-E) on NASA's Aqua satellite.
▶Roy W. Spencer: Who is who (Skeptiker) ▶Roy W. Spencer: Video (Präsentationen) ▶Roy W. Spencer: Websites (English) ▶Ausschluss und Maulkorb für Kritiker (The mission of NASA) |
⇧ 9 NASA/GISS (Climategate 1c)
- a de
Manipulierte GISS-Statistiken
en Manipulated GISS Temperature statistics - b de
GISS streicht polare Meeresoberflächentemperaturen
en GISS Deletes Arctic And Southern Ocean Sea Surface Temperature Data - c de
Drei Jahrzehnte Anpassung
en Three decades of adjustments - d en Why NOAA and NASA proclamations should be ignored
- e de
Die NASA Daten: U.S. Klimawissenschaft so korrupt wie die CRU
en The NASA Files: U.S. Climate Science as Corrupt as CRU - f de
Roh-Daten von GISS: Vor- und Nachher
en GISS "raw" station data - before and after - g de
Die Wandlung der NASA-"Fakten"
en NASA's (Changing) FACTS - h en And now, the most influential station in the GISS record is ...
- i de
GISS-Trend für die Arktis weicht von HadCrut und von Satellitendaten ab
en GISS: Visualizing Arctic Coverage
GISS claims of better 2005 Arctic coverage in their recent paper are not justified. - j de GISS: Ein typischer Fall von Temperatur Daten-Manipulation
- k de
US Thinktank CEI verklagt NASA (GISS) wegen Datenblockade zum Klimawandel!
en NASA accused of 'Climategate' stalling - l de
Was, wenn die Löcher in den GISS-Daten pink wären?
en What if GISS Holes were Pink? - m de
Sind Hansens Temperaturen glaubhaft?
en Is Hansen's Recent Temperature Data Consistent? - n de
GISS strickt weiter an der Legende des Rekordjahres 2010
en GISS Shaping Up To Claim 2010 as #1 - o en GISStimating 1998
- p de
Die Temperaturen fallen - aber GISS präsentiert weiter eine "Erwärmung"
en The Arctic Is The Root Of All Evil
HadCRUT temps have been declining since the start of the current millennium,
but Hansen continues to show an increase. - q de
NASA/GISS manipuliert Temperaturdaten der USA
en Corruption Of The US Temperature Record - r de
Neuer Versuch des GISS, durch Datenverfälschung
eine Arktis-Erwärmung herbeizumanipulieren
en New GISS Data Set Heating Up The Arctic - s de
GISS manipuliert auch Temperaturdaten aus Dublin
en Doing The Dirty Deed In Dublin - t en Building The Hockey Stick Ahead Of Paris
- u en
2017: Temperaturdatenmanipulation von GISS (NASA) erneut nachgewiesen
↑
a Manipulierte GISS-Statistiken
en Manipulated GISS Temperature statistics
fr GISS température statistiques manipulées
NASA Klimainstitut GISS interpoliert die arktischen Daten!
en GISS Polar Interpolation
|
de Die erste Graphik zeigt die Anomalien im Juni 2010, vom GISS interpoliert aus einem Gitterpunktsabstand von 1200 km Die grüne Linie markiert den 80. Breitengrad Nord. Man erkennt, dass die Darstellung von GISS im Wesentlichen in der Region nördlich von 80° eine Temperaturabweichung bis +4 K zeigt. en GISS June 2010 anomalies smoothed to 1200 km. The green line marks 80N latitude. Note that GISS shows essentially the entire region north of 80N up to four degrees above normal. |
de Diese Graphik zeigt das Gleiche, jedoch mit einem Abstand der Gitterpunkte von 250 km. Wie man sieht, hat das GISS nur sehr wenige oder gar keine Daten nördlich von 80° N. en This map is the same, but with 250 km smoothing. As you can see, GISS has little or no data north of 80N. |
|
de James Hansen (NASA/GISS): ... die über 12 Monate gleitende mittlere globale Temperatur hat in den Analysen des GISS im Jahre 2010 einen neuen Rekord erreicht... Die GISS-Analysen weisen das Jahr 2005 als das wärmste Kalenderjahr aus, während die Analyse vom HadCRUT 1998 als das wärmste Jahr zeigen. Hauptursache [für diese Diskrepanz] ist, dass wir die geschätzte Temperatur der Arktis mit einbezogen haben. Mit anderen Worten die Daten vom GISS basieren auf inkorrekten, konstruierten Daten. Warum hat es Hansen offensichtlich gefallen, die gemessenen Daten des DMI zu ignorieren und stattdessen auf "geschätzte" Daten aus der Arktis zurückzugreifen? Die Temperaturanomalien in der Arktis sind nach GISS bis zu 4 K zu hoch, und doch behauptet er, einen gemessenen Rekord um ein paar Hundertstel Grad zu haben. |
en James Hansen (NASA/GISS): ... the 12-month running mean global temperature in the GISS analysis has reached a new record in 2010... GISS analysis yields 2005 as the warmest calendar year, while the HadCRUT analysis has 1998 as the warmest year. The main factor is our inclusion of estimated temperature change for the Arctic region. In other words the GISS record high is based on incorrect, fabricated data. Why did Hansen apparently choose to ignore the DMI data when "estimating" Arctic temperatures? GISS Arctic anomalies are high by as much as 4 degrees, and yet he claims a global record measured in hundredths of a degree. |


-
EIKE Europäisches Institut für Klima und Energie
2010-08-03 de NASA Klimainstitut GISS interpoliert die arktischen Daten!
-
Watts Up With That? (Antony Watts)
2009-07-28 en GISS Polar Interpolation
-
National Aeronautics and Space Administration / Goddard Institute
for Space Studies
NASA Official: James E. Hansen
2010-06 en GISS Surface Temperature Analysis
Merkwürdige Berechnungsmethoden des GISS (Goddard Institute of Space Sciences) für die Durchschnittstemperaturen der Welt
|
|
|

-
EIKE Europäisches Institut für Klima und Energie
2010-02-22 de Januar 2010 zu warm? Merkwürdige Berechnungsmethoden des GISS (Goddard Institute of Space Sciences) für die Durchschnittstemperaturen der Welt im Januar 2010ZITAT GISS: Der Januar 2010 war global mit 0,64K (GISS/Land/Meer) überdurchschnittlich warm, in großen Teilen Europas - also nicht nur in Mitteleuropa -, Asiens und in den USA erheblich zu kalt.
Ein Blogger stellt diverse Ungereimtheiten dazu fest. An der obenstehenden Graphik war ihm etwas Sonderbares aufgefallen.
Er hat daraufhin dieselbe Graphik erneut erstellt und nur einen einzigen Parameter verändert: den "smoothing radius" von riesigen 1200 KM auf 250 KM reduziert. Hier das neue Ergebnis:
Die Temperaturabweichung sinkt von 0,64°C auf 0,51°C, also um 0,13°C oder um satte 20,3%.
Und das geschieht, obwohl die Ausgangsdaten identisch sein müssen.
Quellen:
-
Forum / KlimaAutist
2010-02-22 de Surface Temperature Analysis: Maps
-
NASA/GISS
2010-02-22 de Surface Temperature Analysis: Maps
en
GISS-Eskapaden; die merkwürdigen Statistiktricks des US
Klimainstitutes GISS
en
GISScapades
|
|
|

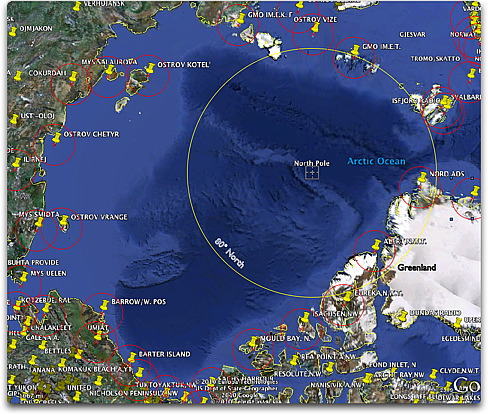
-
EIKE Europäisches Institut für Klima und Energie
2010-04-05 de GISS-Eskapaden; die merkwürdigen Statistiktricks des US Klimainstitutes GISSDer vergnügt auf der ach so bedrohten Südseeinsel Tuvalu lebende Ingenieur und Klimaforscher Willis Eschenbach hat schon des öfteren auf merkwürdige Besonderheiten bei der Berechnung von Klimadaten der hochoffzieller Stellen aufmerksam gemacht.
Jetzt hat er sich die Methoden des GISS vorgenommen.
Das zur NASA gehörende Goddard Institute of Space Studies GISS wird von Dr. James Hansen geleitet.
Einem der Hauptadvokaten des anthropogenen CO2 induzierten Klimawandels.
Hansen vergleicht im Eifer seiner Aufklärungsarbeit schon mal gerne mit Kohle beladene Züge zur Belieferung von Kraftwerken mit den Todeszügen (Deathtrains) von Auschwitz.
Dass er zusätzlich Berater von Al Gore ist, rundet das Bild. Sein GISS erstellt als eines von 3 Instituten für das IPCC und Regierungen offiziell die globalen Temperaturtrends aus den dafür angelieferten Rohdaten.
Nicht immer zimperlich, wie wir seit langem wissen. Willis Eschenbach fügt der endlosen Story um den ClimateGate Skandal eine neue Seite hinzu.
-
Watts Up With That? (Antony Watts)
2010-03-25 en GISScapades
en Goddard Data and Global Sea Ice Doesn't Fit
-
Joe Bastardi Channel
2010-03-22 en
Goddard Data and Global Sea Ice Doesn't Fit
If it is darn warm, how come there is so much sea ice?
-
Watts Up With That? (Antony Watts)
2010-03-23 en Why Joe Bastardi sees red: A look at Sea Ice and GISTEMP and starting choicesAcuuWeather meteorologist Joe Bastardi has a question about two datasets and asks: If it is darn warm, how come there is so much sea ice?
Bastardi asks a simple question:
how can we have above normal temperatures in the Arctic and the Antarctic and continue to add to the global sea ice trend?
After all we've been told by media stories that both the Arctic and the Antarctic continue to melt at a frenetic pace.
But it looks like this year we'll see another Arctic recovery as we've seen in 2008 and 2009.
Bastardi also wonders about something we routinely ask about here at WUWT: data adjustments.
GISS seems to be stuck with Arctic positive anomaly, yet the sea ice isn't cooperating.
Of course just having a positive temperature anomaly doesn't guarantee melt, but members of the public who are less discerning, who look at red hot color presentations like GISS puts out, usually can't tell the difference.
| de | en | fr |
|---|---|---|
|
Auswirkungen des Klimas Arktis (Nordpol) |
Effects of Climate Change Arctic (North Pole) |
Conséquences climatiques Arctique (Pôle Nord) |
| Temperaturen in der Arktis | Arctic Temperatures | Températures dans l'arctique |
| Meereis in der Arktis | Arctic Sea Ice | Banquise arctique |
| de | en | fr |
|---|---|---|
|
Auswirkungen des Klimas Antarktis (Südpol) |
Effects of Climate Change Antarctic (South Pole) |
Conséquences climatiques Antarctique (Pôle Sud) |
↑
b GISS streicht polare Meeresoberflächentemperaturen
en GISS Deletes Arctic And Southern Ocean Sea Surface Temperature Data
|
|
Arctic Surface Temperature Anomaly Comparison of regieon where GISS deletes SST Coverage (65N-90N, 40E-40W)
GISTEMP LST 250 km Smooth
|
|
WHY WOULD DELETING SEA SURFACE TEMPEATURE DATA AND REPLACING IT WITH LAND SURFACE DATA BE IMPORTANT? Land Surface Temperature variations are much greater than Sea Surface Temperature variations. Since January 1982, the trend in GISTEMP Arctic Land Surface Temperature Anomalies (65N-90N, 40E-40W) with 250km radius smoothing is approximately 8 times higher than the Sea Surface Temperature anomaly trend for the same area. The Arctic Ocean SST anomaly linear trend is 0.082 deg C/ decade, while the linear trend for the land surface temperature anomalies is 0.68 deg C/decade. And as a reference, the "combined" GISTEMP Arctic temperature anomaly trend for that area is 9 times the SST anomaly trend. |
|

-
Klimaskeptiker Info (Andreas Kreuzmann)
2010-05-31 de GISS streicht polare Meeresoberflächentemperaturen
-
Watts Up With That? (Antony Watts)
2010-05-31 en GISS Deletes Arctic And Southern Ocean Sea Surface Temperature Data
-
Climate Observations (Bob Tisdale)
2010-05-31 en GISS Deletes Arctic And Southern Ocean Sea Surface Temperature Data
↑
c Drei Jahrzehnte Anpassung
en Three decades of adjustments
Comparing Hansen 1981 with Hansen 2007 (NASA/GISS)
|
|
|
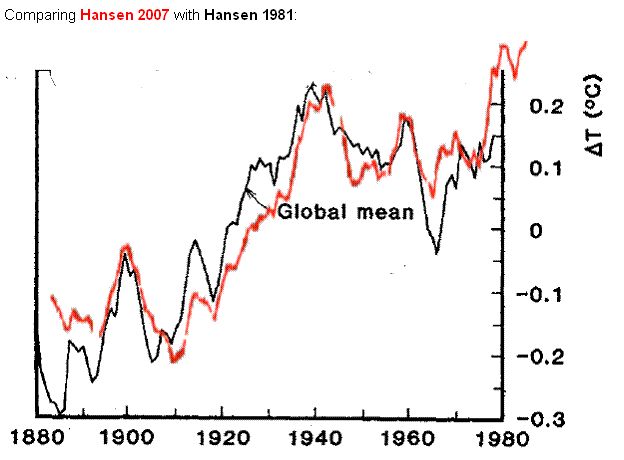
Watch how the cooling trend of the 1960's to 1970's is steadily adjusted up
so that 0.3 degrees cooler gradually becomes 0.03 rising
(notice the red and blue horizontal lines in the graphs above).
Mathews Graph 1976: 1955 - 1965 was around 0.3C warmer than 1970's
Hansen/GISS 1980: 1955 - 1965 was around 0.1C warmer than 1970's
Hansen/GISS 1987: 1955 - 1965 was around 0.05C warmer than 1970's
Hansen/GISS 2007: 1955 - 1965 was around 0.03C cooler than 1970's
And in 1974, there was the fore-runner of the "It's worse than we thought" message.
-
Klimaskeptiker Info (Andreas Kreuzmann)
2010-03-18 de Wetterballon-Daten beweisen die "verschwundene" AbkühlungÜber das mysteriöse Verschwinden(-lassen) der Abkühlung zwischen 1935 und 1975 in den CRU-Veröffentlichungen wurde bereits berichtet.
Die von Wetterballonen seit 1958 gesammelten Daten belegen ebenfalls diese Abkühlungsphase, die von den aktuellen Temperaturreihen von CRU und GISS nicht mehr gezeigt werden.
-
Watts Up With That? (Antony Watts)
2010-03-18 en Weather balloon data backs up missing decline found in old magazineThe most mysterious period is from 1958 to 1978, when a steep 0.3C decline that was initially recorded in the Northern Hemisphere.
Years later that was reduced so far it became a mild warming, against the detailed corroborating evidence from rabocore data.
-
Hide the decline
2010-03-17 en Temperature decline 1940-78, the cold data-war
If 1958 temperatures were similar to the 1990's, it rewrites the entire claim of all the unprecedented warming.
Ice at the North Pole in 1958 and 1959 - not so thick
![]()
![]()
Skate (SSN-578), surfaced at the North Pole, 17 March 1959
-
Watts Up With That? (Antony Watts)
2009-04-26 en Ice at the North Pole in 1958 and 1959 - not so thick
-
John L. Daly (1943-2004)
2001-02-02 en Is the North Pole Turning to Water?
| de | en | fr |
|---|---|---|
|
Auswirkungen des Klimas Arktis (Nordpol) |
Effects of Climate Change Arctic (North Pole) |
Conséquences climatiques Arctique (Pôle Nord) |
| Temperaturen in der Arktis | Arctic Temperatures | Températures dans l'arctique |
| Meereis in der Arktis | Arctic Sea Ice | Banquise arctique |
↑ d Why NOAA and NASA proclamations should be ignored
-
SPPI Science & Public Policy Institute / Joseph D'Aleo
2011-01-14 en
Why NOAA and NASA proclamations should be ignored
↑
e Die NASA Daten: U.S. Klimawissenschaft so korrupt wie die CRU
en
The NASA Files: U.S. Climate Science as Corrupt as CRU
de Die NASA Daten: U.S. Klimawissenschaft so korrupt wie die CRU
-
EIKE Europäisches Institut für Klima und Energie
2010-03-04 de Teil 1Im August 2007 richtete der bekannte US Author Chris Horner zwei "Freedom of Information Act"-Anfragen an die NASA und ihr Goddard Institute for Space Studies (GISS).
Dessen Leiter ist der langjährige Gore-Berater James Hansen und seine rechte Hand Gavin Schmidt (zugleich Mitbegründer der Webseite RealClimate.org). Lesen Sie seinen Erfahrungsbericht.
-
EIKE Europäisches Institut für Klima und Energie
2010-03-04 de Teil 2Am 31. Dezember 2009 hat die NASA endlich dem Competitive Enterprise Institut die Dokumente übergeben, die ich im August 2007 unter Berufung auf den "Freedom of Information Act" angefordert hatte.
Ich hatte die NASA gebeten, über ihre internen Diskussionen zu informieren, die sich wegen ihrer Irrtümer bei den Behauptungen zu den Temperaturen ergeben hatten, und die Steve McIntyre aufgedeckt hatte.
Die NASA hat diese Anforderung für mehr als zwei Jahre mit Schweigen übergangen.
-
EIKE Europäisches Institut für Klima und Energie
2010-03-08 de Teil 3Ein Hauptthema jener NASA-Emails - eines, welches zeigt, wie sich das NASA-Goddard Institute for Space Studies (GISS) in seiner Parteinahme und Heuchelei exponiert - ist das Insistieren auf der Bedeutungslosigkeit der sich als falsch herausgestellten Erwärmung von 0,15 Grad in den Aufzeichnungen der U.S.-Daten, obwohl diese nur sieben Jahre abdeckt (2000 - 2006, im Gegensatz zu einem dekadischen oder noch längeren Trend).
-
EIKE Europäisches Institut für Klima und Energie
2010-03-14 de Teil 4Als ich nahezu die Durchsicht der FOIA- Dokumente beendet hatte, bemerkte ich, dass Al Gores Current News- Netzwerk berichtete, dass die NASA diese Dokumente gleichzeitig veröffentlicht hatte.
Aber dafür keine Pressemitteilung herausgegeben hatte,was die NASA übrigens auch vermied, als sie ihre verfälschten Temperaturen (nachdem dies entdeckt wurden) korrigierte.
Im allgemeinen ist es bei der NASA aber nicht üblich, keine Pressenotiz herauszugeben, wenn irgend etwas mit globaler Erwärmung zu tun hat.
en The NASA Files: U.S. Climate Science as Corrupt as CRU
-
Pajamas Media / Christopher Horner
2010-02-17 en Part 1In August 2007, I submitted two Freedom of Information Act requests to NASA and its Goddard Institute for Space Studies (GISS), headed by long-time Gore advisor James Hansen and his right-hand man Gavin Schmidt (and RealClimate.org co-founder).
I did this because Canadian businessman Steve McIntyre - a man with professional experience investigating suspect statistical claims in the mining industry and elsewhere, including his exposure of the now-infamous "hockey stick" graph - noticed something unusual with NASA's claims of an ever-warming first decade of this century.
NASA appeared to have inflated its U.S. temperatures beginning in the year 2000.
My FOIA request asked NASA about their internal discussions regarding whether and how to correct the temperature error caught by McIntyre.
NASA stonewalled my request for more than two years, until Climategate prompted me to offer notice of intent to sue if NASA did not comply immediately.
On New Year's Eve, NASA finally provided the Competitive Enterprise Institute (CEI) with the documents I requested in August 2007.
As you examine the email excerpts below, as well as those which I will discuss in the upcoming three parts of this series, bear in mind that the contents of these emails were intended to prop up the argument for the biggest regulatory intervention in history: the restricting of carbon emissions from all human activity.
NASA's activist scientists leave no doubt in their emails that this was indeed their objective.
Also, please note that these documents were responsive to a specific FOIA request from two years ago. Recent developments - combined with admissions contained in these documents - beg further requests, which have both been already filed and with more forthcoming.
-
Pajamas Media / Christopher Horner
2010-02-18 en Part 2On December 31, 2009, NASA finally provided the Competitive Enterprise Institute with the documents I requested from them with an FOIA in August 2007.
My request asked NASA to release their internal discussions regarding errors of theirs materially effecting their temperature claims caught by Steve McIntyre.
NASA had stonewalled my request for more than two years.
-
Pajamas Media / Christopher Horner
2010-02-19 en Part 3A principal theme of these NASA emails - and one that is illuminating in its exposition of advocacy and hypocrisy at NASA's Goddard Institute for Space Studies (GISS) - is the insistence that what turned out to be a false warming of 0.15 degrees in the U.S. record is meaningless, even if covering merely seven years (2000-2006, as opposed to a decadal or longer trend).
-
Pajamas Media / Christopher Horner
2010-02-20 en Part 4
↑
f Roh-Daten von GISS: Vor- und Nachher
en GISS "raw" station data - before and after
fr "données" GISS - avant et après
- a GISS: Weather Station Data: raw or adjusted?
- b GISS 1999 vs 2008 Data interpretation
- c USHCN raw data vs GISS homogenized
- d Questions on GISS Ocean Surface temperatures
- e GISS Releases September 2008 Data
- f The NASA Goddard Institute for Space Studies (GISS
- g Why Does NASA Oppose Satellites?
↑ a GISS: Weather Station Data: raw or adjusted?
![]()
![]()
-
Klimaskeptiker Info
2008-06-05 en Malen nach Zahlen: Das eigenartige Thermometer der NASA 2008-11-14 en Fragwürdige "Evolution" der GISS-Daten 2009-06-28 en GISS-Manipulationen: Temperaturtrend um 25% zu hoch 2009-07-20 en GISS "korrigiert" mit wenigen Meßstationen den großen Rest 2009-07-22 en Beeinflußt schon der erste Verarbeitungsschritt den Temperaturtrend beim GISS?
- Watts Up With That? (Antony Watts)
↑ b GISS 1999 vs 2008 Data interpretation
GISS: "The hardest part is trying to influence the nature of the measurements obtained ..."
![]()
![]()
![]()

-
de Es ist nicht neu, daß bei James Hansens GISS die Temperaturdatenreihe dahin "angepaßt" wurde, daß das offenbar gewünschte Ergebnis eines Temperaturanstiegs im späten 20. Jahrhundert damit unterstützt wird.
Bob Tisdale hat jetzt untersucht, wie der Temperaturtrend für die zusammenhängenden 48 US-Bundesstaaten sich durch die "Anpassung" verändert.
Das Ergebnis seiner Berechnungen: Der Temperaturtrend von 1880 bis 1999 vor den Anpassungen lag bei 0,035°C Temperaturanstieg pro Dekade (also 0,35°C pro Jahrhundert), nach den Anpassungen errechnet sich der Wert zu 0,044°C pro Dekade (0,44°C pro Jahrhundert).
Der Trend wird also durch den GISS-Eingriff in die Daten um 25% verstärkt.
Klimaskeptiker Info
2009-06-28 de GISS-Manipulationen: Temperaturtrend um 25% zu hoch
-
en Before the post-1999 GISS adjustments to the Contiguous U.S. GISTEMP data, the linear trend for the period of 1880 to 1999 was 0.035 deg C/decade. After the adjustments, the linear trend rose to 0.044 deg C/decade.
2009-06-28 en NASA GISS: adjustments galore, rewriting U.S. climate history"
-
Watts Up With That? (Antony Watts)
2008-11-14 en Questions on GISS temperature product
2009-01-25 en "The hardest part is trying to influence the nature of the measurements obtained ..."
↑ c USHCN raw data vs GISS homogenized
![]()
![]()
- Surfacestations Org en Racine USHCN raw data/GISS homogenized
-
Watts Up With That? (Antony Watts)
2009-01-25 en James Hansen's 1988 Forecast
| James (Jim) E. Hansen |
Dr., Former Head of NASA Goddard Institute for Space Studies
in New York City
He also serves as Al Gore's science advisor
▶James (Jim) E. Hansen: Who is who (Aktivisten der anthropogenen Globalen Erwärmung) ▶Ausschluss und Maulkorb für Kritiker (Das renommierte amerikanische Museum für nationale Geschichte (AMNH) in New York Opfer des Klimakriegs) |
↑ d Questions on GISS Ocean Surface temperatures
| de | en | fr |
|---|---|---|
| GISS - Goddard Institute for Space Studies (NASA) | GISS - Goddard Institute for Space Studies (NASA) | GISS - Goddard Institute for Space Studies (NASA) |
| GISS-Oberflächentemperaturen | GISS-Surface temperatures | GISS-Températures des surfaces |
↑ e GISS Releases September 2008 Data
-
Watts Up With That? (Antony Watts)
2008-10-08 en GISS Releases September 2008 Data
↑ f The NASA Goddard Institute for Space Studies (GISS)
-
The NASA Goddard Institute for Space Studies (GISS),
at Columbia University in New York City,
is a laboratory of the Earth Sciences Division of NASA's Goddard Space Flight Center
and a unit of the Columbia University Earth Institute.
en Home
en GISS Surface Temperature Analysis
↑ g Why Does NASA Oppose Satellites?
-
en One of the ironies of climate science is that perhaps the most prominent opponent of satellite measurement of global temperature is James Hansen, head of ... wait for it ... the Goddard Institute for Space Studies at NASA!
As odd as it may seem, while we have updated our technology for measuring atmospheric components like CO2, and have switched from surface measurement to satellites to monitor sea ice, Hansen and his crew at the space agency are fighting a rearguard action to defend surface temperature measurement against the intrusion of space technology.
For those new to the topic, the ability to measure global temperatures by satellite has only existed since about 1979, and is admittedly still being refined and made more accurate.
However, satellite measurement has a number of substantial advantages over surface temperature measurement:
-
It is immune to biases related to the positioning of surface temperature stations, particularly the temperature creep over time for stations in growing urban areas.
-
It is relatively immune to the problems of discontinuities as surface temperature locations are moved.
-
It is much better geographic coverage, lacking the immense holes that exist in the surface temperature network.
Anthony Watts has done a fabulous job of documenting the issues with the surface temperature measurement network in the US, which one must remember is the best in the world.
-
-
Climate Skeptic
2008-07-19 en Why Does NASA Oppose Satellites? A Modest Proposal For A Better Data Set
-
Real Science (Steven Goddard)
2016-02-07 en The Wrong StufflFour years ago, the people with The Right Stuff sent this letter to NASA satellite deniers James Hansen and Gavin Schmidt, who are completely destroying the agency's reputation with their junk science.
March 28, 2012
Letter to The Honorable Charles Bolden, Jr. NASA Administrator NASA Headquarters Washington, D.C. 20546-0001We, the undersigned, respectfully request that NASA and the Goddard Institute for Space Studies (GISS) refrain from including unproven remarks in public releases and websites.
We believe the claims by NASA and GISS, that man-made carbon dioxide is having a catastrophic impact on global climate change are not substantiated, especially when considering thousands of years of empirical data.
With hundreds of well-known climate scientists and tens of thousands of other scientists publicly declaring their disbelief in the catastrophic forecasts, coming particularly from the GISS leadership, it is clear that the science is NOT settled.
The unbridled advocacy of CO2 being the major cause of climate change is unbecoming of NASA's history of making an objective assessment of all available scientific data prior to making decisions or public statements.
As former NASA employees, we feel that NASA's advocacy of an extreme position, prior to a thorough study of the possible overwhelming impact of natural climate drivers is inappropriate.
We request that NASA refrain from including unproven and unsupported remarks in its future releases and websites on this subject.
At risk is damage to the exemplary reputation of NASA, NASA's current or former scientists and employees, and even the reputation of science itself.
For additional information regarding the science behind our concern, we recommend that you contact Harrison Schmitt or Walter Cunningham, or others they can recommend to you.
↑
g Die Wandlung der NASA-"Fakten"
en NASA's (Changing) FACTS
-
KlimaskeptikerIinfo (Andreas Kreuzmann)
2010-04-12 de Die Wandlung der NASA-"Fakten"
-
Nasa Facts
en April 1998The temperature record of the past hundred years does show a warming trend, by approximately 0.5°C.
However, the observed warming trend is not entirely consistent with the carbon dioxide change.
Most of the temperature increase occurred before 1940, after which Earth started to cool until the early seventies, when warming resumed.
Carbon dioxide, on the other hand, has been increasing steadily throughout the past century.
-
Nasa Facts
en May 11, 2007Far from being some future fear, global warming is happening now, and scientists have evidence that humans are to blame.
For decades, cars and factories have spewed billions of tons of greenhouse gases into the atmosphere, and these gases caused temperatures to rise between 0.6°C and 0.9°C over the past century.
The rate of warming in the last 50 years was double the rate observed over the last 100 years. Temperatures are certain to go up further.
-
The Hockey Schtick
en NASA's (Changing) FACTS
↑ h And now, the most influential station in the GISS record is ...
-
Watts Up With That? (Antony Watts)
2009-07-20 en And now, the most influential station in the GISS record is ...
↑
i GISS-Trend für die Arktis weicht von HadCrut und von Satellitendaten ab
en GISS: Visualizing Arctic Coverage
GISS claims of better 2005 Arctic coverage in their recent
paper are not justified.
![]()
![]()

-
Klimaskeptiker Info (Andreas Kreuzmann)
2010-05-20 de GISS-Trend für die Arktis weicht von Satellitendaten abGISS hat die Erwärmung der Arktis in den letzten 13 Jahren schlicht erfunden.
-
Watts Up With That? (Antony Watts)
2010-05-21 en Visualizing Arctic CoverageConclusion: GISS claims of better 2005 Arctic coverage in their recent paper are not justified.
↑ j GISS: Ein typischer Fall von Temperatur Daten-Manipulation
|
|
|
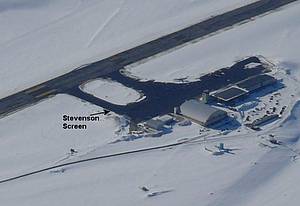
|
|
|

-
EIKE Europäisches Institut für Klima und Energie
2010-05-20 de Ein typischer Fall von Temperatur Daten-Manipulation?Wie einfach die lokalen Temperatur-Daten und deren Darstellung manipuliert werden können, zeigt das Beispiel skandinavischen Svalbard-Inseln auf 78° nördl.Breite.
Unser Autor vergleicht die veröffentlichten Daten des GISS (Goddard Institute for Space Sciences) dass mit der Ermittlung der globalen Welttemperatur betraut ist, mit den Veröffentlichungen des offiziellen skandinavischen "NordKlim" Datenzentrums.
Das Ergebnis ist erstaunlich.
↑
k US Thinktank CEI verklagt NASA (GISS) wegen Datenblockade zum Klimawandel!
en NASA accused of 'Climategate' stalling
-
EIKE Europäisches Institut für Klima und Energie
2010-06-01 de US Thinktank CEI verklagt NASA (GISS) wegen Datenblockade zum Klimawandel!Am Vormittag des 27.5.10 hat das Competitive Enterprise Institute (CEI) beim Distriktsgericht für den Distrikt Columbia die NASA verklagt, um die ehemalige Weltraumagentur wegen der fast drei Jahre währenden Abschottung des Zugangs zu internen Dokumenten und dem damit einhergehenden Missbrauch von Steuergeldern zur Verantwortung zu ziehen.
Damit hat die NASA der Klimawandel-Propaganda Vorschub geleistet.
-
The American Spectator / Chris Horner
2010-05-27 en CEI Suing NASA Over Climate StonewallThis morning in U.S. District Court for the District of Columbia, the Competitive Enterprise Institute is filing suit against NASA, calling the erstwhile space agency to account for its nearly three-year stonewall of access to internal documents exposing an abuse of taxpayer funds to advance the global warming agenda.
-
The Washington Times
2010-04-26 en NASA accused of 'Climategate' stallingThe man battling NASA for access to potential "Climategate" e-mails says the agency is still withholding documents and that NASA may be trying to stall long enough to avoid hurting an upcoming Senate debate on global warming.
Nearly three years after his first Freedom of Information Act request, Christopher C. Horner, senior fellow at the Competitive Enterprise Institute, said he will file a lawsuit Thursday to force NASA to turn over documents the agency has promised but has never delivered.
Mr. Horner said he expects the documents, primarily e-mails from scientists involved with NASA's Goddard Institute for Space Studies (GISS), will be yet another blow to the science behind global warming, which has come under fire in recent months after e-mails from a leading British research unit indicated scientists had manipulated some data.
↑
l US Was, wenn die Löcher in den GISS-Daten pink wären?
en What if GISS Holes were Pink?
-
Klimaskeptiker Info (Andreas Kreuzmann)
2010-06-15 de Was, wenn die Löcher in den GISS-Daten pink wären?
-
Watts Up With That? (Antony Watts)
2010-06-15 en What if GISS Holes were Pink?
-
Watts Up With That? (Antony Watts)
2010-07-26 en GISS Swiss Cheese
↑
m Sind Hansens Temperaturen glaubhaft?
en Is Hansen's Recent Temperature Data Consistent?
|
with 2010 almost 0.1°C warmer than the actual warmest year of 1998. |
and 2010 about 0.1°C cooler than the warmest year 1998. |
|
|
|


-
Klimaskeptiker Info (Andreas Kreuzmann)
2010-08-16 de Sind Hansens Temperaturen glaubhaft?In den Medien hören wir immer wieder, das Jahr 2010 sei auf dem weg, als heißestes Jahr in die Geschichte einzugehen.
Diese Aussage kann nur auf den Daten von James Hansens GISS beruhen, denn alle anderen großen Temperaturreihen zeigen kein Rekordjahr 2010.
-
Watts Up With That? (Antony Watts)
2010-08-16 en Is Hansen's Recent Temperature Data Consistent?This post raises questions about GISS claims of record 2010 temperatures.
The most recent GISS graph below shows nearly constant warming from 1965 to the present, with 2010 almost 0.1°C warmer than the actual warmest year of 1998.
HadCrut disagrees.
They show temperatures flat over the past decade and 2010 about 0.1°C cooler than the warmest year 1998.
↑
n GISS strickt weiter an der Legende des Rekordjahres 2010
en GISS Shaping Up To Claim 2010 as #1
|
As you can see in the graph, they show 2010 with much more area
above the 1998 line than below. |
Seventy times lower than GISS. |
|
|
|
GISS is the only one of the four which shows 2010 as #1. The others aren't even close. Conclusion: Dr. Hansen thinks that warming has continued unabated since 1998, while HadCrut, RSS and UAH think it has stopped or slowed to a crawl. |
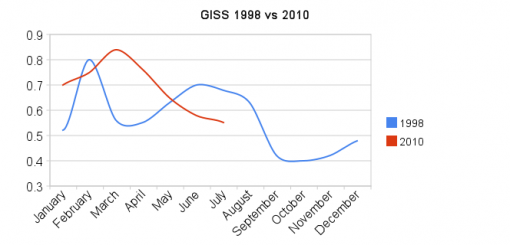

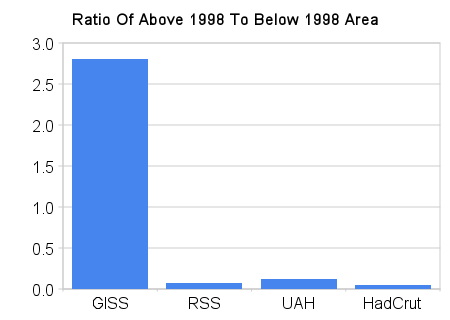
-
Klimaskeptiker Info (Andreas Kreuzmann)
2010-03-05 de GISS strickt weiter an der Legende des Rekordjahres 2010Das vom AGW-Miterfinder James Hansen geleitete GISS bastelt weiter daran, die Behauptung zu verbreiten, 2010 seit auf dem besten Wege, das wärmste Jahr seit Beginn der Aufzeichnungen zu werden.
Rahmstorf und das Fernsehen zitieren diese Behauptung freudig.
Wie sieht das im Vergleich zu anderen Datenquellen aus?
HadCRUT hat seine Daten nach oben "korrigiert", aber selbst mit den veränderten Daten ist dort das Verhältnis von wärmer zu kälter nur 0,04 - siebzigmal kleiner als bei GISS
-
Watts Up With That? (Antony Watts)
2010-08-20 en GISS Shaping Up To Claim 2010 as #1GISS appears to be working hard to make 2010 the hottest year ever.
As you can see in the graph above, they show 2010 with much more area above the 1998 line than below.
I did a numerical integration of the graph above, and found that they have 2.8 times as much area with 2010 warmer than they do with 2010 cooler.
↑ o GISStimating 1998
|
|
Note that not only was 1998 demoted, but also many other years since 1975 - the start of Tamino's "modern warming period." By demoting 1998, they are now able to show a continuous warming trend from 1975 to the present - which RSS, UAH and Had Crut do not show. |
|
|
Conclusion:
GISS recently modified their pre-2000 historical data, and is now
inconsistent with other temperature sets. Had GISS not modified their historic data, they would still be consistent with other data sets and would not show warming post-1998. I'll leave it to the readers to interpret further. |
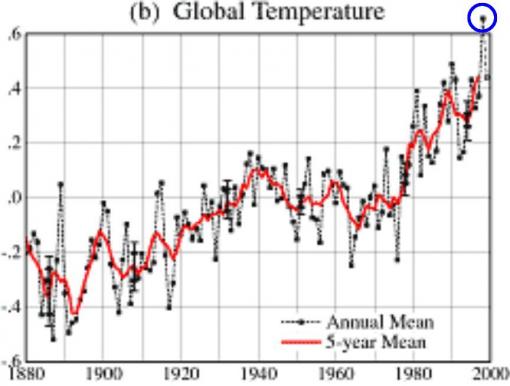
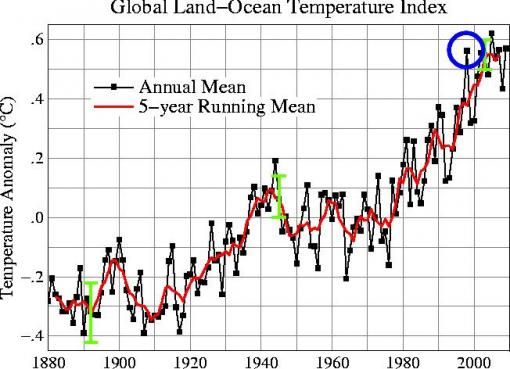

-
Watts Up With That? (Antony Watts)
2010-08-20 en GISStimating 1998In a previous article, I discussed how UAH, RSS and HadCrut show 1998 to be the hottest year, while GISS shows 2010 and 2005 to be hotter.
But it wasn't always like that.
GISS used to show 1998 as 0.64 anomaly, which is higher than their current 2005 record of 0.61.
↑
p Die Temperaturen fallen - aber GISS präsentiert weiter eine "Erwärmung"
en HadCRUT temps have been declining since the
start of the current millennium, but Hansen continues to show an increase.
![]()
![]()
HadCRUT temps have been declining since the start of the current
millennium, but Hansen continues to show an increase.
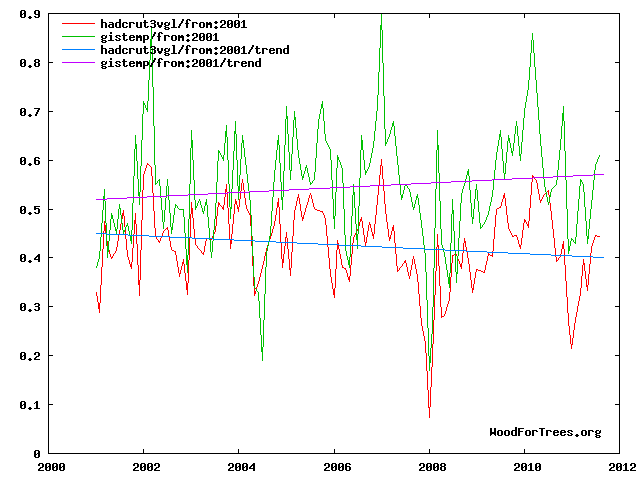
-
Klimaskeptiker Info (Andreas Kreuzmann)
2011-10-08 de Die Temperaturen fallen - aber GISS präsentiert weiter eine "Erwärmung"Wenn man die Temperaturdaten des Hadley Centre (Großbritannien) betrachtet, ergibt sich seit Beginn des 21. Jahrhunderts ein leichter Abkühlungstrend.
Nach der Temperaturreihe des GISS, dessen Direktor der mehrfach verhaftete AGW-Miterfinder James Hansen ist, gab es angeblich eine Erwärmung.
Die Differenz zwischen den beiden Datenreihen nimmt von Jahr zu Jahr zu.
-
Real Science
2010-05-10 en The Arctic Is The Root Of All EvilHadCRUT temps have been declining since the start of the current millennium, but Hansen continues to show an increase.
GISS has been diverging from HadCrut at a rate of almost 1C per century since 2001.
Hansen blames attributes this to his extrapolated Arctic temperatures north of 80N, where he has no thermometers.
| de | en | fr |
|---|---|---|
| Manipulationen I | Manipulations I | Manipulations I |
| Manipulierte GISS-Statistiken | Manipulated GISS Temperature statistics | GISS température statistiques manipulées |
↑
q NASA/GISS manipuliert Temperaturdaten der USA
en Corruption Of The US Temperature Record
-
Real Science
2016-01-15 en "If the facts don't fit the theory, change the facts."
NASA US temperature data is based on NOAA USHCN data, which is
massively altered to create the appearance of warming.
 The graph below shows how the NOAA data is altered.
The blue line shows the averaged measured temperature at all USHCN stations, and the red line shows the average adjusted temperature.The warming trend over the last century is entirely due to "adjustments" by NOAA.
Note how the "1940s blip" has been largely removed.
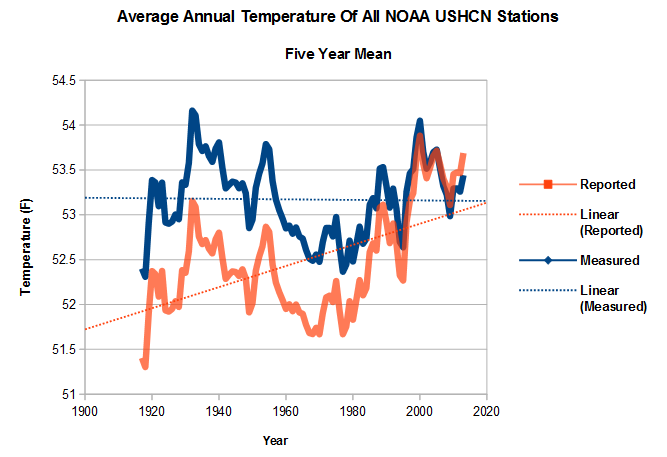
|
|
|
|
|
de
(a) = Ursprüngliche Angabe
en
(a) = Original indication |
|
|
|
|
|
|
|
|
|
|
|
|


|
|
en
GISS 1999 vs 2008 Data interpretation |
de Aus der Panik-Küche en From the panic laboratory fr De la marmite des alarmistes
Resultat dieser Manipulation / Result of this manipulation
![]()
![]()

-
Welt Online
2012-02-02 de
Nasa zeigt Erderwärmung seit 1880 im Zeitraffer
Eine aktualisierte Analyse des "Goddard Institute for Space Studies" (GISS) der Nasa, welches die Oberflächentemperatur der Erde überwacht, zeigt die Erderwärmung von 1880 bis heute im Zeitraffer.
2012-02-02 de
Nasa-Animation zeigt Fieberkurve der Erde
Unser Planet heizt sich immer schneller auf:
Das vergangene Jahrzehnt war das wärmste seit Beginn der Aufzeichnungen. Und es soll noch heißer werden.
de
Zum Nachdenken - oder besser: Das gibt zu Denken!
en
To think about!
fr
A réfléchir!
|
de Original, vor der "Korrrektur" Das mit Abstand wärmste Jahrzehnt waren die 1930er Jahre.
en
Prior to being The 1930s was by far the hottest decade. |
de Nach der "Korrektur" im Jahre 2000 Die älteren Temperaturen sind abgesenkt, die jüngeren angehoben worden. Erst diese Manipulation hat den "Beweis" für die vom GISS-Chef Hansen 1988 vorhergesagte Erwärmung gebracht. Allein das Jahr 1998 wurde nachträglich um fast ein halbes Grad wärmer gemacht. en After being "adjusted" in the year 2000, it magically changed shape The 1990s became much warmer. 1998 added almost half a degree - ex post facto. |
|
|
|

-
Klimaskeptiker Info (Andreas Kreuzmann)
2010-07-23 de Rahmstorfs PropagandaDie GISS-Daten werden nachträglich verändert (gefälscht), um die von James Hansen 1988 vorgesagte, aber nicht eingetretene Erwärmung zu "beweisen".
-
Watts Up With That? (Antony Watts)
2010-07-23 en GISTEMP Movie MatinéesRewriting history is not a good approach to science.
It was very hot during the 1930s, as anyone who lived through it can tell you.
Someday Hollywood will make a blockbuster movie about the global warming hysteria of the early 21st century.
-
Real Science
2012-01-29 en Corruption Of The US Temperature Record
↑
r Neuer Versuch des GISS, durch Datenverfälschung eine Arktis-Erwärmung
herbeizumanipulieren
en New GISS Data Set Heating Up The Arctic
|
Bis vor ein paar Wochen sah beim GISS die Temperaturgraphik für Reykjavik auf Island so aus: |
Jetzt stellt sich die Graphik so dar: |
|
In den 1930er und 1940er Jahren war es dort wärmer als in der Gegenwart. |
mit 1930er und 1940er Jahren, die viel kälter waren als die Gegenwart. |
|
|
|

|
Resultate / Results / Résultats Dieses Verfahren gehört beim GISS inzwischen offensichtlich zum Standard, wie einige Blinkvergleiche zeigen |
|
|
|
|

-
Klimaskeptiker Info (Andreas Kreuzmann)
2012-01-15 de Neuer Versuch des GISS, durch Datenverfälschung eine Arktis-Erwärmung herbeizumanipulieren
-
EIKE Europäisches Institut für Klima und Energie
2012-01-26 de Ein neuer GISS-Datensatz erwärmt die ArktisDas GISS hat einige neue Korrekturen angebracht, um die Arktis zu erwärmen
-
Real Science
2012-01-15 en New GISS Data Set Heating Up The Arctic
↑
s GISS manipuliert auch Temperaturdaten aus Dublin
en Doing The Dirty Deed In Dublin
|
|
Hansen just whacked a degree off all pre-1990 temperatures in Dublin. |
-
Klimaskeptiker Info (Andreas Kreuzmann)
2012-01-18 de GISS manipuliert auch Temperaturdaten aus Dublin
-
Real Science
2010-08-07 en Doing The Dirty Deed In Dublin
↑ t en Building The Hockey Stick Ahead Of Paris
-
Real Science (Steven Goddard)
2015-09-22 en Building The Hockey Stick Ahead Of ParisNASA 2001:
In 2001, NASA showed little if any global warming from 1991 to 2001

NASA 2015:
Now they show a hockey stick of warming during that same period.
de Effektive Temperaturen
en Real TemperaturesThe planet has not warmed for almost 20 years, so NASA and NOAA are simply making up fake data to keep the president's fraudulent "climate legacy" on track ahead of Paris.
The Left Half Of NASA's Temperature Fraud
Half of NASA temperature fraud is manufactured by cooling the past. In 1981, Hansen showed a little over 0.3C surface warming from 1880 to 1980
The other half of their fraud is accomplished by warming recent years, which I will cover in a later post.
Make no mistake about it, NASA and NOAA are engaged in the biggest fraud in science history. Quelle/Source
![]()
![]()
More From America's Very Hot Past
One of the primary functions of both NASA and NOAA is to make America's hot past disappear. Quelle/Source
![]()
![]()
| de | en | fr |
|---|---|---|
|
Klimawandel: Probleme Temperatur-Manipulationen Skandal Manipulationen Teil I, II, III Climategate Institute, Who's who, Mails |
Climate change: Problems Temperature Manipulations Scandal Manipulations Part I, II, III Climategate Institutes, Who's who, Mails |
Climat: Problèmes Manipulation des températures Scandale Manipulations partie I, II, III Climategate Instituts, Qui est qui, Méls |
↑ u 2017: Temperaturdatenmanipulation von GISS (NASA) erneut nachgewiesen
-
2017-06-09 en
NASA manipuliert Klima-Daten !
-
EIKE Europäisches Institut für Klima und Energie
2017-06-12 de Temperaturdatenmanipulation von GISS (NASA) erneut nachgewiesenManipulation der Temperaturdaten
Seit langem ist bekannt, dass das das zur NASA gehörende Goddard Institute for Space Sciences (GISS) die weltweiten Temperaturdaten manipuliert.
Und zwar fast ausschließlich so, dass heute eine stärkerer Erwärmung erkennbar sein soll.
Zugleich wird auch kein nachvollziehbarer Grund für diese ständige Manipulation angegeben.

Damit sind diese Daten für die Klimawissenschaft wertlos.
Doch selten konnten diese Manipulationen so eindeutig und vor allem so einprägsam und daher auch für Laien überzeugend gezeigt werden, wie in diesem Ausschnitt aus dem Recherche-Video "Schulbuch belegt Schwindel mit Globaler Erwärmung".
⇧ 10 UC University of Colorado
- a de
Modellberechnungen und Manipulationen statt Meßdaten -
Wie die Verlangsamung des Meeresspiegelanstiegs geleugnet wird
en More hiding the decline - The University of Colorado has done it again!
↑
a Modellberechnungen und Manipulationen statt Meßdaten -
Wie die Verlangsamung des Meeresspiegelanstiegs geleugnet wird
en
More hiding the decline - The University of Colorado has done it again!
-
Klimaskeptiker Info (Andreas Kreuzmann)
2011-08-12 de Modellberechnungen und Manipulationen statt Meßdaten - Wie die Verlangsamung des Meeresspiegelanstiegs geleugnet wirdSeit etwa 5 Jahren hat sich der Anstieg des Meeressppiegels, wie er von der Universität von Colorado in Boulder errechnet wird, verlangsamt.
Diese Tatsache paßt natürlich überhaupt nicht ins alarmistische Weltbild, in dem die vermeintlich durch CO2 ausgelöste globale Erwärmung zu einer Beschleunigung des Meeresspiegelansteigs führen müßte.
Was passiert nun mit Daten, die nicht zum gewünschten Ergebnis passen?
Sie müssen "angepaßt" werden.
-
EcoTretas
2011-07-19 en More hiding the declineDespite the fact that sea level has been going down for the last year, they are saying that sea level rise rate is going up!
⇧ 11 NCDC National Climatic Data Center
- a de
In Erwartung eines US-amerikanischen "Temperatur-Gate"
en A new paper comparing NCDC rural and urban US surface temperature data - b de
Das US National Climatic Data Center NCDC wurde bei der künstlichen
Abkühlung der Vergangenheit ertappt
en NOAA's National Climatic Data Center caught cooling the past -
modern processed records don't match paper records
↑
a In Erwartung eines US-amerikanischen "Temperatur-Gate"
en A new paper comparing NCDC rural and urban
surface temperature data
NOAA = National Oceanic and Atmospheric Administration
(United States Department of Commerce)
NESDIS = National Environmental Satellite, Data and Information Service
(United States Department of Commerce)
NCDC = National Climatic Data Center
(United States Department of Commerce)
|
|
|
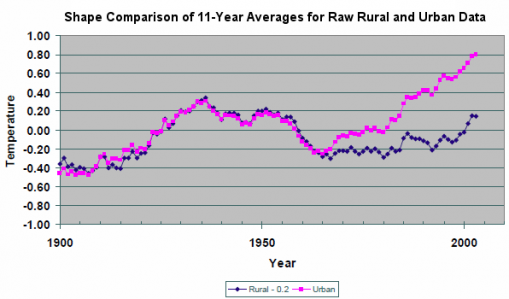

de
-
EIKE Europäisches Institut für Klima und Energie
2010-02-27 de In Erwartung eines US-amerikanischen "Temperatur-Gate"?Der Physiker und Strahlungswissenschaftler Edward R. Long untersuchte in einer Studie die Unterschiede zwischen ländlichen (ruralen) und städtischen (urbanen) Temperatur-Messstationen des amerikanischen Klimazentrums NCDC (National Climate Data Center), sowie das von der NCDC Behörde veröffentlichte Gesamtergebnis.
Sein Resultat: Die einen kräftigen Erwärmungstrend zeigenden urbanen Messstationen dominieren die - keinen oder kaum einen Erwärmungstrend zeigenden - ruralen Stationen bei weitem.
Er schließt daraus, dass die Ergebnisse dahingehend frisiert d.h. verfälscht wurden, um einen Erwärmungstrend zu zeigen, den die Daten selber so nicht hergeben.
en
-
Watts Up With That? (Antony Watts)
2010-02-26 en A new paper comparing NCDC rural and urban US surface temperature data
Quellen/Sources:
-
SPPI Science & Public Policy Institute
2010-02-25 en Contiguous U.S. Temperature Trends Using NCDC Raw and Adjusted Data for One-Per-State Rural and Urban Station Sets
2010-02-26 en
Full Report
↑
b Das US National Climatic Data Center NCDC wurde bei der künstlichen
Abkühlung der Vergangenheit ertappt
en NOAA's National Climatic Data Center caught
cooling the past - modern processed records don't match paper records
-
EIKE Europäisches Institut für Klima und Energie
2012-06-19 de Das US National Climatic Data Center NCDC wurde bei der künstlichen Abkühlung der Vergangenheit ertappt...und aktuell erstellte Aufzeichnungen passen nicht zu alten Papieraufzeichnungen.
Aber unverdrossen meldet das NCDC immer auf Neue Wärmerekorde.
So auch in den letzten Tagen:
(Der wärmste Mai seit 1880) wie HEISE online titelt .Doch in letzter Zeit mussten wir wieder und immer wieder erfahren, dass diese Angaben getürkt sind, denn man macht permanent die Vergangenheit kälter, jedenfalls beim GISS, HadCRUT und anderen Datensätzen der Temperatur.
-
Watts Up With That? (Antony Watts)
2012-06-06 en NOAA's National Climatic Data Center caught cooling the past - modern processed records don't match paper recordsWe've seen examples time and again of the cooling of the past via homogenization that goes on with GISS, HadCRUT, and other temperature data sets.
By cooling the data from the past, the trend/slope of the temperature for the last 100 years increases.
⇧ 12 NODC National Oceanographic Data Center
- a de
NODC verändert die Daten des Ozean-Wärmegehalts: Jetzt abnehmend
en NODC revises ocean heat content data - it's now dropping slightly
↑
a NODC verändert die Daten des Ozean-Wärmegehalts:
Jetzt abnehmend - GISS-Projektion falsch
en NODC revises ocean heat content data -
it's now dropping slightly
|
|
|
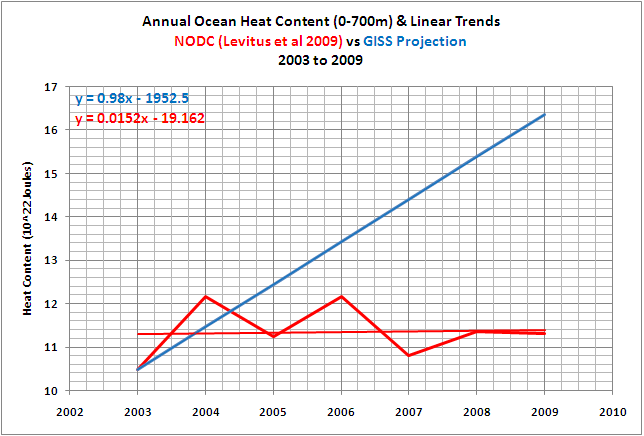
-
Klimaskeptiker Info (Andreas Kreuzmann)
2010-01-31 de NODC verändert die Daten des Ozean-Wärmegehalts: Jetzt abnehmend - GISS-Projektion falsch
-
Watts Up With That? (Antony Watts)
2010-01-31 en NODC revises ocean heat content data - it's now dropping slightly
⇧ 13 NSIDC National Snow and Ice Data Center
- a de
Noch mehr Propaganda mit Zahlen: Über den Rückgang des arktischen Meereises
en The Sea Ice Monster: it's a scaly thing
↑
a Noch mehr Propaganda mit Zahlen: Über den Rückgang des arktischen Meereises
en The Sea Ice Monster: it's a scaly thing
de Aus der Panik-Küche en From the panic laboratory fr De la marmite des alarmistes
|
|
|
|
de Die gewohnte (manipulative) Darstellung der arktischen Meereisausdehnung (hier für den Monat April seit 1979) zeigt einen steilen Abwärtstrend |
de Meereisausdehnung seit 1979 für den Monat April in korrekter Darstellung: Der Trend sieht viel schwächer aus
Der Abnahmetrend während der dargestellten Jahre
(1979 bis 2010) beträgt 39.000 km² pro Jahr
(oder 0,039 Millionen km² pro Jahr). |
|
en There has been a lot of talk about commercial shipping opportunities through the "soon to be ice free" Arctic. These are normally based on highly magnified graphs published by organisations like NSIDC |
en
A different view emerges when you take the raw data from NSIDC's
web site and plot it on graphs with a more appropriate vertical scale. When you calculate the slope, it suggests that April sea ice extent won't reach zero until the year 2385. |


-
Klimaskeptiker Info
2010-05-24 de Noch mehr Propaganda mit Zahlen: Über den Rückgang des arktischen MeereisesWir bekommen ständig erzählt, das Meereis in der Arktis verschwinde schnell.
In wenigen Jahren sollen wir mit eisfreien Sommern in der Arktis rechnen können.
Diese Behauptungen finden in der Realität keine Bestätigung.
-
Watts Up With That? (Antony Watts)
2010-05-24 en The Sea Ice Monster: it's a scaly thing
| de | en | fr |
|---|---|---|
|
Auswirkungen des Klimas Arktis (Nordpol) |
Effects of Climate Change Arctic (North Pole) |
Conséquences climatiques Arctique (Pôle Nord) |
| Temperaturen in der Arktis | Arctic Temperatures | Températures dans l'arctique |
| Meereis in der Arktis | Arctic Sea Ice | Banquise arctique |
⇧ 14 The National Wildlife Federation
↑ a When Saving the Planet, You Have to Streeeetch The Truth
-
Watts Up With That? (Antony Watts)
2010-08-12 en When Saving the Planet, You Have to Streeeetch The TruthInteresting theory!
Only problem is that summers have been generally getting cooler across those regions for the last 80 years.
Below are the NCDC summer (Jun-Aug) trend graphs for all of the states discussed in the article.
More than half of those states have seen declining summer temperatures, and the average trend is -0.1°F per century.
de Aus der Panik-Küche en From the panic laboratory fr De la marmite des alarmistes
-
USA Today
2010-08-02 en Think this summer is hot? Get used to it
This summer's stifling, deadly heat along the Eastern Seaboard and Deep South could be a preview of summers to come over the next few decades, according to a report about global warming to be published Wednesday by the National Wildlife Federation and the Asthma and Allergy Foundation of America.
⇧ 15 North Atlantic
↑ a Nuuk Airport
|
|
|
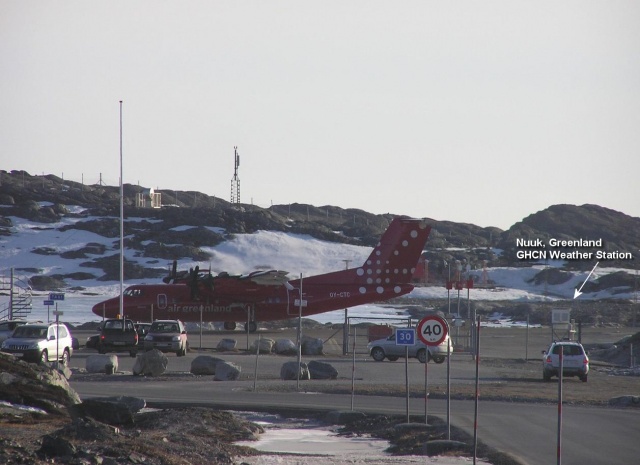

-
Watts Up With That? (Antony Watts)
2010-10-03 en Watts Up With Nuuk?
2011-01-27 en The North Atlantic heat is on
⇧ 16 Kanada / Canada / Canada
↑ a Government report: Canadian climate data quality 'disturbing'
-
Watts Up With That? (Antony Watts)
2010-08-23 en Government report: Canadian climate data quality 'disturbing'
2010-04-17 en GISS & METAR - dial "M" for missing minus signs: it's worse than we thought
-
Financial Post
2010-08-23 en Cuts jeopardizing quality of Canada's weather service: reportSustained cuts to Environment Canada weather-service programs have compromised the government's ability to assess climate change and left it with a "profoundly disturbing" quality of information in its data network, says a newly released internal government report.
The stinging assessment, obtained through an access-to-information request, suggests that Canada's climate network infrastructure is getting progressively worse and no longer meets international guidelines.
"Environment Canada is on the road to junior partner status with respect to other agencies, both provincial and international, in the area of climate data gathering, quality control and archiving," said the report, released to the Pembina Institute, an Alberta-based environmental research group.
⇧ 17 Deutschland / Germany / Allemagne
- a Die Himalaya-Gletscher-Lüge von "Klimapapst" Schellnhuber am 30.10.2009
- b Wie Professor Schellnhuber vom Potsdam Institut für Klimafolgenforschung (PIK) das 2-Grad Ziel erklärt
- c Widersprüchliche Behauptungen des PIK Potsdam-Institut für Klimafolgenforschung
- d
Desinformationstraining für Journalisten; Intendant der DW verneint
Desinformationsabsicht entgegen offizieller Bekundungen! - e de GISS manipuliert auch Potsdamer Temperaturdaten
- f de Mit welchen Tricks deutsche Universitäten abweichende Meinungen niederhalten
- g de Akademiker 'lügen regelmäßig, um Forschungsgelder zu ergattern'
↑ a Die Himalaya-Gletscher-Lüge von "Klimapapst" Schellnhuber am 30.10.2009
Auch Schellnhuber hatte im Vorfeld der Klimakonferenz von "Kopenhagen" über das Abschmelzen der "Himalaya"-Gletscher gelogen
...und zwar noch am 30.10.2009 in der ZDF-Sendung "Die lange Nacht des Klimas".
Im Januar 2010 wurde der Himalaya-Gletscher-Schwindel bekanntlich entlarvt.
-
Die Dreckschleuder
2010-01-28 de Klima: H. J. Schellnhuber lügt hier wissentlichDer Klimaberater der Kanzlerin H. J. Schellnhuber hat im Vorfeld der Klimakonferenz von Kopenhagen über das Abschmelzen der Himalaya-Gletscher "Fehlinformationen" verbreitet.
Am 30.10.2009 verkündete er in der ZDF-Sendung "Die lange Nacht des Klimas", dass die Himalaya-Gletscher in 30 bis 40 Jahren zum größten Teil verschwunden sein könnten.
-
EIKE Europäisches Institut für Klima und Energie
2010-01-26 de ClimateGate 20: Auch Herr Schellnhuber wusste von nichts...Der ehemalige Klima-Berater von Bundeskanzlerin Angela Merkel, Hans Joachim Schellnhuber, Direktor des eingetragenen Vereins Potsdam-Instiutut für Klimafolgenforschung, hat es bislang geschafft, nicht mit den Skandalen der Klimaforschung in Zusammenhang gebracht zu werden.
↑ b Wie Professor Schellnhuber vom Potsdam Institut für Klimafolgenforschung (PIK) das 2-Grad Ziel erklärt
de Allgemein en General fr Générale
-
Klimamanifest Heiligenroth
de Die Varianten (27) des 2-Grad-Ziels !!
@DerSPIEGEL, #SPON @SPIEGELWISSENUpdate 01.12.2017: nun 27 (!) "Zwei-Grad-Ziele"
|
Hans-Joachim Schellnhuber *1950-06-07 |
Professor, Bis September 2018 war er Direktor des 1992 von ihm gegründeten Potsdam-Instituts für Klimafolgenforschung (PIK) ▶Hans-Joachim Schellnhuber: Who is who (Aktivisten der anthropogenen Erwärmung) |
de Verzeichnis en Contents fr Sommaire
- 2019
- de
Hans-Werner Sinn und die "Willkür" des "2-Grad-Zieles !!
Hans-Werner Sinn kritisierte das dubiose "2-Grad-Ziel" bereits im Jahr 2010 ziemlich zutreffend, in dem er ebenfalls keine seriöse Basisgrundlage für dieses 2-Grad-Ziel ausmachen konnte. - en Planet-Sized Experiments - we've already done the 2°C test
- 2018
- en Secrets about the 1.5°C world temperature limit
- de
Karsten Hilse entlarvt 1,5-Grad-Ziel-Irrsinn
- 2014
- de Alarm für Alarmisten: 2°C-Vater Schellnhuber verschiebt maximalen CO2-Ausstoß um 10 Jahre!
- de
2-Grad-Ziel: Völkerrecht ?
- 2013
- de
Die Widersprüche bei der Globalen Mitteltemperatur und 2 Grad Ziel
- de Erwärmungshysterie und 2°-Ziel - warum?
- 2009
- de
Zwei Grad Fieber!
en G-8 Summit drops CO2 targets, keeps 2 degree temperature goal - de Ein Limit von zwei Grad Erwärmung ist praktisch Unsinn
de Text en Text fr Texte
⇧ 2019
↑ Hans-Werner Sinn und die "Willkür" des "2-Grad-Zieles !!
-
Klima Manifest Heiligenroth / Fundstück #020
BR ALPHA "AlPA CAMPUS" vom 01.04.2010
2019-09-17 de
Hans-Werner Sinn und die "Willkür" des "2-Grad-Zieles !!
Hans-Werner Sinn kritisierte das dubiose "2-Grad-Ziel" bereits im Jahr 2010 ziemlich zutreffend, in dem er ebenfalls keine seriöse Basisgrundlage für dieses 2-Grad-Ziel ausmachen konnte.
↑ en Planet-Sized Experiments - we've already done the 2°C test
![]()
![]() ▶ Planet-Sized Experiments -
we've already done the 2°C test
▶ Planet-Sized Experiments -
we've already done the 2°C test

-
Watts UP With That? (Antony Watts) / Willis Eschenbach
2019-03-17 en Planet-Sized Experiments - we've already done the 2°C test
Berkeley Earth average European temperature, 1743 - 2013
Red/yellow line is an 8-year Gaussian average.
Horizontal red and blue lines are 2°C apart.
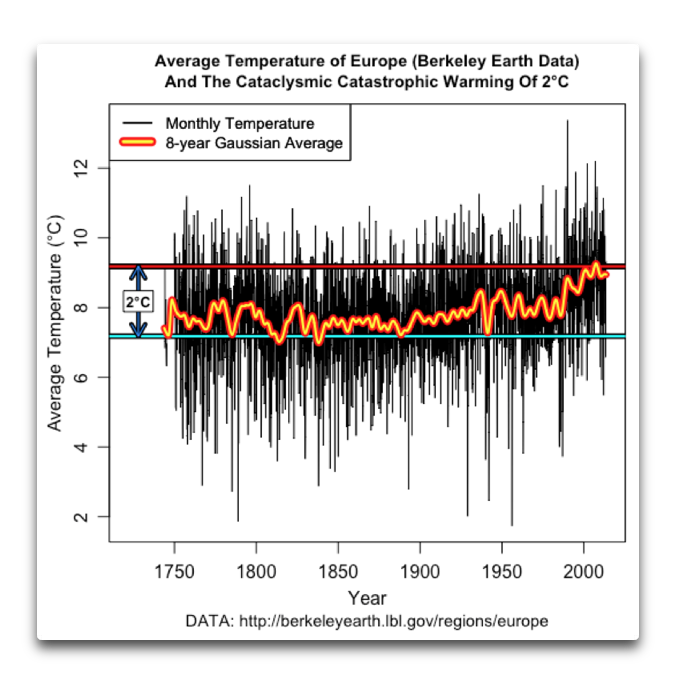
People often say that we're heading into the unknown with regards to CO2 and the planet.
They say we can't know, for example, what a 2°C warming will do because we can't do the experiment.
This is seen as important because
for unknown reasons, people have battened on to "2°C" as being the scary temperature rise
that we're told we have to avoid at all costs.
But actually, as it turns out, we have already done the experiment.
Below I show the Berkeley Earth average surface temperature record for Europe.
Europe is a good location to analyze, because some of the longest continuous temperature records are from Europe.
In addition, there are a lot of stations in Europe that have been taking record for a long time.
This gives us lots of good data.
Average annual climate-related (blue line)
and non-climate-related (red line) deaths in natural disasters
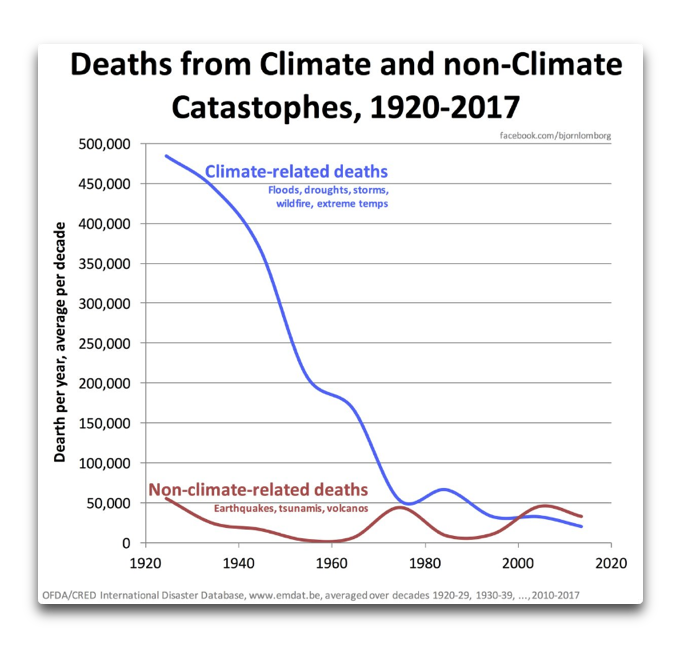 Results of the UN "My World" poll. Further analytic data

|
|
Planet-Sized Experiments - we've already done the 2°C test |
⇧ 2018
↑ en Secrets about the 1.5°C world temperature limit
-
Fabius Maximus website / Larry Kummer
2018-11-09 en Secrets about the 1.5°C world temperature limitThere has been a daily drumbeat of dark climate news to accompany the IPCCs new report, "Global Warming of 1.5 °C."
Millions of people are terrified that climate change will wreck or destroy the world.
Here is some information they probably do not know, because journalists do not mention it.
-
Frontiers / Sebastian Lüning and Fritz Vahrenholt
2017-12-12 de Paleoclimatological Context and Reference Level of the 2°C and 1.5°C Paris Agreement Long-Term Temperature LimitsThe Paris Agreement adopted in December 2015 during the COP21 conference stipulates that the increase in the global average temperature is to be kept well below 2°C above "pre-industrial levels" and that efforts are pursued to limit the temperature increase to 1.5°C above "pre-industrial levels."
In order to further increase public acceptance of these limits it is important to transparently place the target levels and their baselines in a paleoclimatic context of
the past 150,000 years (Last Interglacial, LIG)
and in particular of the last 10,000 years (Holocene; Present Interglacial, PIG).
Intense paleoclimatological research of the past decade has firmed up that pre-industrial temperatures have been highly variable which needs to be reflected in the pre-industrial climate baseline definitions.
The currently used reference level 1850-1900 represents the end of the Little Ice Age (LIA).
The LIA represents the coldest phase of the last 10,000 years when mean temperatures deviated strongly negatively from the Holocene average and which therefore are hard to justify as a representative pre-industrial baseline.
The temperature level reached during the interval 1940-1970 may serve as a better reference level as it appears to roughly correspond to the average pre-industrial temperature of the past two millennia.
Placing the climate limits in an enlarged paleoclimatic context will help to demonstrate that the chosen climate targets are valid and represent dangerous extremes of the known natural range of Holocene temperature variability.
| Studie | Lüning, S., F. Vahrenholt (2017) |
|---|---|
| Paleoclimatological context and reference level of the 2°C and 1.5°C Paris Agreement long-term temperature limits. | |
|
Frontiers in Earth Science, 12 December 2017, doi: 10.3389/feart.2017.00104 |
Dieser Literaturhinweis wurde mit dem ganzen Litreraturverzeichnis von Dr. Sebastian Lüning in Wikipedia gelöscht:
▶Wikipedia-Deckname 'Neudabei':
Er kam des nachts und löschte aus Ärger einfach das
Literaturverzeichnis
[Who is who (Skeptiker):
Sebastian Lüning;
Wikipedia:
Websites,
Opfer:
Lüning,
Manipulatoren:
Neudabei]
-
Die kalte Sonne (Fritz Vahrenholt & Sebastian Lüning)
2017-12-20 de Neue Studie setzt die 1,5°C und 2,0°C Temperaturziele des Pariser Klimavertrags in einen historischen KontextAm 12. Dezember 2017 erschien im Fachblatt 'frontiers in Earth Science' eine Arbeit von Sebastian Lüning und Fritz Vahrenholt zum paläoklimatischen Kontext der Pariser 1,5°C und 2,0°C Klimaziele.
Die Publikation ist dort kostenfrei als pdf herunterladbar.
Zu der Arbeit gaben die Autoren die folgende Pressemitteilung heraus (deutsche Version weiter unten):
Press release issued: 13 December 2017
New study puts the 1.5°C and 2.0°C temperature limits of the Paris Agreement into a historical climate context
The Paris Agreement adopted in December 2015 during the COP21 climate conference stipulates that the increase in the global average temperature is to be kept well below 2°C above "pre-industrial levels" and that efforts are pursued to limit the temperature increase to 1.5°C above "pre-industrial levels."
Closer inspection of the treaty text, however, reveals that the term "pre-industrial levels" is nowhere defined in this epochal UN-document, that has meanwhile been ratified by 170 Parties.
This is particularly odd because the "pre-industrial" temperatures of the past 10,000 years have varied quite significantly, as meticuloulsy documented by hundreds of paleoclimate studies.
Puzzled by this apparent gap in the Agreement, Fritz Vahrenholt went out and researched the history of the temperature limit definition.
The former renewable energy manager and current head of the German Wildlife Foundation was surprised to find that the initial description of this important climate goal dates back to the mid 1970s, proposed by an economist, by the name of William Nordhaus.
Nordhaus' idea was as simple as effective:
He looked at the maximum temperatures recorded during the past several hundred thousand years and warned that this natural range should not be exceeded in the future.
Two decades later, in 1995, the German Advisory Council for Global Change further refined this concept, but kept Nordhaus' original idea of a tolerable 'temperature window'.
Vahrenholt:
"Unfortunately this important palaeoclimatological perspective was lost in subsequent key papers on the subject that paved the way to the Paris Agreement.
Reports by the World Bank and United Nations Framework Convention on Climate Change (UNFCCC) in 2014 and 2015 narrowed their view to the last 200 years which does not do justice to the enormous natural temperature fluctuations on a multi-millennial perspective."
In order to better understand the complex pre-industrial temperature history of the past, Vahrenholt teamed up with Sebastian Lüning, a professional resources geologist who in his sparetime works on paleoclimatological studies with the Switzerland-based Institute for Hydrography, Geoecology and Climate Sciences.
Lüning researched the literature and integrated the Paris Agreement 2.0°C and 1.5°C temperature limits into the climate development of the past 2000, 10,000 and 120,000 years.
Lüning:
"Comparing the modern warming to reference levels at the end of the Little Ice Age about 150 years ago does not really make much sense because this period represents one of the coldest times of the past 10,000 years.
The choice of a baseline near the lower extreme of a variable parameter is uncommon in science.
The temperature level that was reached during the interval 1940-1970 may serve as a better reference level because it appears to roughly correspond to the average pre-industrial temperature of the past two millennia."
On an even longer time scale, it is found that current temperatures have not yet even exceeded the warmest temperatures of a natural warm phase that globally occurred some 7000 years ago, the so-called 'Holocene Thermal Maximum'.
Global temperatures may have even partly exceeded the 1.5°C limit during this warm phase, when combined land and sea surface temperatures are taken into account.
The increase in this natural temperature window and the baseline shift potentially enlarges the headroom for the 1.5°C temperature limit of the Paris Agreement which deserves further study.
...
-
EIKE Europäisches Institut für Klima und Energie
2017-12-15 de Neue Studie stellt die Temperaturgrenzen von 1,5°C bzw. 2°C des Paris-Abkommens in einen histori-schen Klima-ZusammenhangAnmerkung der Redaktion.
Die Autoren Lüning und Vahrenholt bemängeln in ihrer Studie bei den Pariser Klimabeschlüssen zu Recht das Fehlen einer exakten Vergleichsbasis für die dort definierten zulässige Temperatur-Erhöhungen, die aber trotzdem mit einer Genauigkeit von 1/10nbsp;°C (2,0 bzw 1,5nbsp;°C) beziffert werden und die auch bestimmt werden sollen.
Das mag hohe Politik sein, Wissenschaft ist es nicht.
Wissenschaftlich ist es Unsinn.
Diese Wissenschaft wieder zu etablieren, ist das Ziel der Autoren.
Dabei konzentrieren sie sich nur auf diesen einen offensichtlichen Mangel, weitere schwere Mängel wie z.B. den, dass eine mittlere Temperatur der Erdatmosphäre in der Realität nicht existiert, lassen sie außen vor.
Wir vermuten, dass das deshalb geschah, um die Studie überhaupt veröffentlicht zu bekommen.
Trotzdem ist die Studie lesenswert.
Jeder mag seine eigenen Schlussfolgerungen ziehen.
Presseerklärung vom 13. Dezember 2017
Bei dem Pariser Klima-Abkommen vom Dezember 2015 wurde vereinbart, dass die Zunahme der globalen mittleren Temperatur auf deutlich unter 2°C verglichen mit dem "vorindustriellen Niveau" begrenzt werden muss und dass man sich bemühen sollte, den Anstieg auf 1,5°C zu begrenzen.
Eine genauere Betrachtung des Vertrags-Wortlautes enthüllt jedoch, dass der Terminus "vorindustrielles Niveau" nirgendwo in diesem epochalen UN-Dokument definiert ist, welches mittlerweile von 170 teilnehmenden Parteien ratifiziert worden ist.
Dies ist besonders komisch, weil die "vorindustriellen" Temperaturen der letzten 10.000 Jahren signifikante Variationen durchlaufen haben, wie akribisch dokumentiert in hunderten paläoklimatischer Studien.
Verwirrt durch diese klaffende Lücke im Abkommen machte sich Fritz Vahrenholt daran, die Historie der Definition zum Temperaturlimit zu ergründen.
Der ehemalige Manager erneuerbarer Energie und derzeit Leiter der German Wildlife Foundation fand zu seiner Überraschung heraus, dass die ursprüngliche Beschreibung dieses bedeutenden Klimaziels von Mitte der siebziger Jahre stammt und von einem Ökonom namens William Nordhaus ins Spiel gebracht worden ist.
Nordhaus' Gedanke war ebenso einfach wie effektiv:
Er betrachtete die Höchstwerte der Temperatur der letzten paar hunderttausend Jahre und warnte, dass die dabei zutage getretene natürliche Bandbreite in Zukunft nicht überschritten werden darf.
Zwei Jahrzehnte danach, nämlich im Jahre 1995 überarbeitete der Wissenschaftliche Beirat Globale Umweltveränderungen WBGU dieses Konzept, behielt aber den ursprünglichen Gedanken eines tolerierbaren "Temperatur-Fensters" von Nordhaus bei.
Vahrenholt:
"Unglücklicherweise ist diese wichtige paläoklimatische Perspektive in nachfolgenden grundlegenden Studien, welche den Weg nach Paris bereitet hatten, verloren gegangen.
In Berichten der Weltbank und des United Nations Framework Convention on Climate Change (UNFCCC) aus den Jahren 2014 und 2015 wurde der historische Zeitraum auf die letzten 200 Jahre eingeengt, welche den enormen natürlichen Temperatur-Fluktuationen im Zeitmaßstab von Jahrtausenden nicht gerecht wird".
Um die komplexe präindustrielle Temperatur-Historie besser zu verstehen tat er sich mit Sebastian Lüning zusammen, einem professionellen Ressourcen-Geologen, der in seiner Freizeit an paläoklimatischen Studien arbeitet am in der Schweiz ansässigen Institute for Hydrography, Geoecology and Climate Sciences.
Lüning durchforstete die Literatur und integrierte die Temperaturgrenzen von 2,0°C bzw. 1,5°C in die Klimaentwicklung der letzten 2000, 10.000 und 200.000 Jahre.
Lüning:
"Der Vergleich der derzeitigen Erwärmung mit dem Referenz-Niveau am Ende der Kleinen Eiszeit vor etwa 150 Jahren ist wenig sinnvoll, weil diese Zeit eine der kältesten Epochen der letzten 10.000 Jahre repräsentiert.
Die Auswahl eines Parameters als Grundlinie nahe dem untersten Extrem eines variablen Parameters ist in der Wissenschaft unüblich.
Das Temperaturniveau des Zeitraumes von 1940 bis 1970 wäre ein viel besser geeignetes Referenz-Niveau, weil es in etwa mit dem mittleren vorindustriellen Temperaturniveau der letzten beiden Jahrtausende korrespondiert".
In einem sogar noch längeren Zeitmaßstab stellte sich heraus, dass die Temperatur gegenwärtig noch nicht einmal über die höchsten Temperaturen einer natürlichen Warmphase hinausgegangen sind, dem "Thermalen Maximum des Holozäns" vor etwa 7000 Jahren.
Die globalen Temperaturen können während jener Warmphase gut über das Limit von 1,5°C hinaus gegangen sein, wenn man Land- und Wassertemperatur zusammen in Betracht zieht.
Die Zunahme dieses natürlichen Temperatur-Fensters und die Verschiebung der Grundlinie vergrößert die Obergrenze des 1,5°C-Limits und muss weiter untersucht werden.
...
|
|
Secrets about the 1.5°C world temperature limit Die Erfindung des 2-Grad-Zieles Wissenschaftliche Debatte zur Aufklärung Manipulation und Terror von Wikipedia: Mainstream vs. Wissenschaft |
↑ Karsten Hilse entlarvt 1,5-Grad-Ziel-Irrsinn
-
2018-10-10 de
Karsten Hilse entlarvt 1,5-Grad-Ziel-Irrsinn
Ausschnitt aus Bundestagssitzung vom 10.10.2018 - "Aktuelle Stunde zu notwendigen Maßnahmen zur Einhaltung des 1,5-Grad-Klimaziels".
Auch an dieser Stelle möchte ich darauf hinweisen, dass ich KEIN Anhänger der AfD bin; bzgl. Klimapolitik muss ich der AfD jedoch weitgehend Recht geben.
⇧ 2014
↑ Alarm für Alarmisten: 2°C-Vater Schellnhuber verschiebt maximalen CO2-Ausstoß um 10 Jahre!
-
EIKE Europäisches Institut für Klima und Energie
2014-12-15 de Alarm für Alarmisten: 2°C-Vater Schellnhuber verschiebt maximalen CO2-Ausstoß um 10 Jahre!Der Vater des 2°C-Zieles Schellnhuber verschiebt das Datum des maximalen CO2-Ausstoßes um 10 Jahre, von 2020 auf 2030.
↑ 2-Grad-Ziel: Völkerrecht ?
-
2014-12-13 de
2-Grad-Ziel: Völkerrecht ?
-
EIKE Europäisches Institut für Klima und Energie
Alex Baur (Red. WELTWOCHE Zürich)
2014-12-17 de PIK Chef Schellnhuber irrte schon wieder: 2 ° Ziel nicht völkerrechtlich verbindlichImmer wieder prescht der Chef des Potsdam Instituts für Klimafolgenforschung PIK weit vor, um die Öffentlichkeit und mit ihr die Politik zu überzeugen, dass jede Anstrengung (der anderen versteht sich) erforderlich ist, die Erde um nicht mehr als 2 °C - bezogen auf die (leider nur ziemlich ungenau bekannte) "vorindustrielle" Temperatur - zu erwärmen.
Netto blieben dann noch ca. 1 °C übrig.
Als Begründung und Verstärkung führt er an, dass dieses 2 °-Ziel völkerrechtlich verbindlich sei.
Doch wie so viele andere Behauptungen des PIK Chefs erweist sich auch diese wieder als falsch.
Dankenswerterweise hat sich der Solarkritiker Rainer Hoffmann vom Klimamanifest von Heiligenroth die Zeit genommen, diese erneute Fehlinformation des J. Schellnhuber zu belegen
de Quelle:
Schellnhuber behauptete am 03.07.2011 im ZDF, das "2-Grad-Ziel" sei angeblich völkerrechtlich anerkannt.
Schellnhuber bestätigt beim Deutschen Bundestag am 03.12.2014:
"Bisher sei dieser 2010 in Cancun getroffene Beschluss in keiner Weise völkerrechtlich abgesichert."Es kann doch nun wirklich nicht mehr so weitergehen, dass die politischen Verantwortlichen im DEUTSCHEN BUNDESTAG in Berlin sich von diesem offensichtlichen "Scharlatan" vom PIK in Potsdam weiterhin angeblich "wissenschaftlich" beraten lassen.
en Source: NoTricksZone Further Comments
Many of us have been misled to believe that the 2°C was established by leading climate scientists and even made to "international law" that now has to be strictly adhered to, and that
Prof Hans-Joachim Schellnhuber (0:18 mark), Director of the ultra-alarmist Potsdam Institute for Climate Impact Research, for example, claimed on German public television on July 3, 2011, that the 2°C target indeed was "international law" and that CO2 emissions needed to start falling by 2020 if humanity was to have any chance of reaching the 2°C target.
On December 3, 2014, Schellnhuber admitted that the 2°C target was not international law (0:53) and then postponed the year CO2 emissions would have to start dropping by an entire decade, to 2030.
Suddenly we got goalposts that were not international law and had been moved out another 10 years.
2°C target is purely political
On the question of: Is the theoretical 2°C target a scientific one?
The answer to that question is also a definite "no".Prof. Dr. Christian Schönwiese
On February 2, 2010, Prof. Dr. Christian Schönwiese (1:27) told FAZ journalist Christian Bartsch on German public television:
They formulated a 2°C target. It is not from a climate scientist, or a physicist, or a chemist, but from an outside person who simply plucked it out of thin air and said '2°C'
Bartsch asks Schönwiese rhetorically:
"So it's no scientific target?" Schönwiese acknowledges: "Right."
Prof. Hans von Storch
At the 2:03 mark of the video, Prof. Hans von Storch in a speech he made in January, 2011 confirmed Schönwiese:
We are in a time where scientists and politicians claim, or at least suggest, the science, in the form of the IPCC, or the German Advisory Council on Global Change (WBGU), has shown that the 2°C target is scientifically mandatory, and is thus no longer a political question that has to be negotiated by society, but rather a target that policymakers only must execute - quasi an order.
However the IPCC has never in any way presented the 2°C target as mandatory.
Rather this was done by a few scientists, or shall I say: politicians disguised as scientists."
⇧ 2013
↑ Die Widersprüche bei der Globalen Mitteltemperatur und 2 Grad Ziel
-
Klima Manifest Heiligenroth
2013-09-22 de
Kapitel 4 - 2-Grad-Ziel (Fieber) ?
10 Unbequeme Wahrheiten über H J Schellnhuber -
2013-09-29 de
Kapitel 5: 2-Grad-Ziel (Völkerrecht) ?
10 Unbequeme Wahrheiten über Hans J. Schellnhuber -
2014-12-13 de
1. NACHTRAG Kapitel 5: 2-Grad-Ziel (Völkerrecht) ?
Man sollte auch wissen, wie das "2-Grad-Ziel" entstanden ist ...
Hans Joachim Schellnhuber entwickelte die "2-Grad-Idee" (Idee???) 1995 in einem Gutachten für die Bundesregierung.
Das politische 2-Grad-Ziel formulierte 1996 der Europäische Rat.
Schellnhuber sieht die Erde als menschlicher Organismus!!!!!
2 Grad ist Fieber für die Erde.
Die 2 Grad sind das absolute Maximum, was wir dem Planeten zumuten können.
Das "2-Grad-Ziel" hat nichts mit fundierter Wissenschaft zu tun.
⇧ 2009
↑
de
Zwei Grad Fieber!
en
G-8 Summit drops CO2 targets, keeps 2
degree temperature goal
![]()
![]()
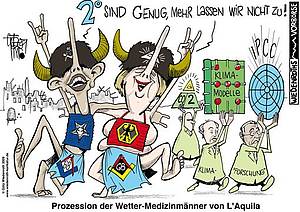
de Die Gipfelteilnehmer des G-8-Treffens in L'Aquila, Italien, haben sich darauf geeinigt, die Welt-Temperatur bis zum Ende des Jahrhunderts um nicht mehr als zwei Grad Celsius ansteigen zu lassen.
-
EIKE Europäisches Institut für Klima und Energie
2009-07-10 de Zwei Grad Fieber!
-
Watts Up With That? (Antony Watts)
2009-07-08 en G-8 Summit drops CO2 targets, keeps 2 degree temperature goal
↑ Erwärmungshysterie und 2°-Ziel - warum?
-
EIKE Europäisches Institut für Klima und Energie
2013-10-21 de Erwärmungshysterie und 2°-Ziel - warum? Teil 12013-11-06 de Erwärmungshysterie und 2°-Ziel - warum? Teil 2
↑ Ein Limit von zwei Grad Erwärmung ist praktisch Unsinn
-
FAZ
2009-10-29 de Ein Limit von zwei Grad Erwärmung ist praktisch UnsinnDrei große deutsche Geoinstitute stellen sich quer zur internationalen Klimapolitik.
Statt nur über Temperaturen und Emissionen sollte über ein Erdsystemmanagement verhandelt werden, sagen die drei Direktoren.
Im Gespräch erläutern sie ihre Motive.Reinhard Hüttl
Direktor am Deutschen Geoforschungszentrum GFZ in PotsdamIm Laufe der Erdgeschichte gab es immer wieder dramatische Veränderungen, die weit über eine solche Grenze von plusminus zwei Grad hinausgingen.
Und das war allein auf natürliche Faktoren zurückzuführen.Wärmephasen waren nicht immer katastrophal.
Sie haben auch zur Artenvielfalt beigetragen.
Oder schauen Sie sich die Entwicklung vom Homo sapiens seit der letzten Warmphase vor 150 000 Jahren an.Unsere Spezies hat in dieser Zeit den Klimawandel gemeistert.
Wir sind außergewöhnlich anpassungsfähig.
Nur haben wir zuletzt eben eine glückliche Situation mit relativ stabilem Klima gehabt.
Daher kommt sicher auch die Forderung nach der Zwei-Grad-Grenze.
Das ist politisch wünschenswert, aber aus geowissenschaftlicher Sicht nicht haltbar.
Wir haben nicht deutlich genug gesagt, dass man das Klima nur als Teilsystem des ständig variablen Systems Erde verstehen kann, das zudem noch durch extraterrestrische Größen wie solare Strahlung und Orbit beeinflusst wird.
Die Politik konzentriert sich derzeit fast ausschließlich auf die Kohlendioxidreduktion.
Wir wissen aber, dass das System Erde komplex ist.
Es gibt natürliche Effekte, die wir so nicht einfach kontrollieren können, wie wir uns das vorgestellt haben.
Volker Moosbrugger
Direktor am Senckenberg-Forschungsinstitut und Museum in FrankfurtIch denke, Modelle sind die besten Werkzeuge, die wir haben, um Zukunsftszenarien zu entwickeln.
Aber man muss auch die Schwachstellen erkennen, die sie haben, und ich behaupte, die Schwachstellen sind nicht immer ausreichend dokumentiert.
Das sage ich als jemand, der sich in der älteren Erdgeschichte auskennt, der weiß, dass die Klimamodelle typische Treibhausklimata, wie wir sie rekonstruieren können, nicht abbilden.
Eine historische Situation, die komplett eisfrei ist und wo Wälder bis in achtzig Grad nördlicher Breite vorkommen, das bekommt man in Modellen bisher nicht hin.
Da können Sie das Kohlendioxid hochfahren bis auf 1000 ppm, aber sie bekommen in achtzig Grad nördlicher Breite kein frostfreies Klima hin.
Dennoch wissen wir, dass es das früher gegeben hat.
Karin Lochte
Direktorin am Alfred-Wegener-Institut für Polar- und MeeresforschungEs gibt sowohl in Kanada als auch in Russland große Pläne für die Entwicklung des hohen Nordens.
In beiden Ländern wird Geld investiert, um den Klimawechsel tatsächlich zu nutzen.
|
Hans-Joachim Schellnhuber *1950-06-07 |
Professor, Bis September 2018 war er Direktor des 1992 von ihm gegründeten Potsdam-Instituts für Klimafolgenforschung (PIK) ▶Hans-Joachim Schellnhuber: Who is who (Aktivisten der anthropogenen Erwärmung) |
↑ c Widersprüchliche Behauptungen des PIK Potsdam-Institut für Klimafolgenforschung
-
www.fernsehkritik.tv
2009-12-23 de
Widersprüchliche Klimaberichterstattung im TV
In Folge 38 von http://www.fernsehkritik.tv wurden seltsame Widersprüchlichkeiten und zahlreiche Ungenauigkeiten in der TV-Klimaberichterstattung rund um die Klimakonferenz von Kopenhagen aufgedeckt.
-
solarkritik 2 (Rainer Hoffmann)
2009-12-07 de
Mojib Latif entlarvt "Klimapapst" Schellnhuber als "linearen
Klimaschwindler"
Auf der Klima-Pressekonferenz am 23,11,2009 in Berlin erzählt Klimapapst Schellnhuber zahlreiche Unwahrheiten, die Klimakollege Mojib Latif in einer arte-sendung am gleichen Tag, wohl mehr unfreiwillig und unbewusst, als Unwahrheiten entlarvt hat...
-
solarkritik 2 (Rainer Hoffmann)
2009-12-09 de
Klimaschwindel Teil 4: Die seltsamen Schellnhuber-Varianten des
angeblich maximalen CO2-Budgets
Innerhalb von 14 Tagen (vom 23.11.2009 bis 06.12.2009) hat der Klimaberater der Kanzlerin, Hans Joachim Schellnhuber, 4 Varianten über den angeblich maximale CO2-Ausstoss publiziert, der einen "gefählichen Klimawandel" vermeiden könnte. Diese Videorecherche entlarvt den Klimaforscher Schellnhuber als Schwindler und Scharlatan, denn auch seine eigenen Leute beim PIK, wie Ottmar Edenhofer, kennen die angeblich korrekten Zahlen nicht...aber schauen Sie selbst...
↑ d Desinformationstraining für Journalisten: Intendant der DW verneint Desinformationsabsicht entgegen offizieller Bekundungen!
-
EIKE Europäisches Institut für Klima und Energie
2010-06-20 de Desinformationstraining für Journalisten: Intendant der DW verneint Desinformationsabsicht entgegen offizieller Bekundungen!Die Deutsche Welle (DW) will ab 21.6.10 einen internationalen Workshop abhalten mit dem Titel "The Heat is on - Climate Change and the Media". In der Webankündigung der DW steht:
"Die globale Erderwärmung stellt die Welt vor gravierende Probleme.
Der Klimawandel hat nicht nur Auswirkungen auf den geo- politischen Frieden, regionale Konflikte, das soziale Wohl und die Menschenrechte. Er wirkt sich auch auf die Basis unserer Existenz aus - auf die Bewohnbarkeit unseres Planeten.
Hungersnöte, Flüchtlingswanderungen, Überschwemmungen, Ernteausfälle, extreme Unwetter, Dürreperioden und Pandemien schwächen das Fundament unseres kollektiven Zuhauses."
Ein Blick auf die stagnierende globale Temperatur-Entwicklung der letzten 10 Jahre hätte genügt, um schon den ersten Teil des Titels anders zu formulieren: "The Heat is off".
Vom Rest ganz zu schweigen.EIKE hat den Intendanten des steuerfinanzierten Sendes Erik Bettermann auf diese Diskrepanz hingewiesen und darauf, dass es nicht Aufgabe eines Staatssenders sein darf, Journalisten zu einem bestimmten wissenschaftlich falschem Meinungsbild zu bewegen.
EIKE hat darüber hinaus die Absetzung dieses u.E.n. Desinforamtionsworkshops verlangt.
Es entspann sich ein Briefwechsel zwischen Indendant und EIKE den wir unten zeigen.
↑ e GISS manipuliert auch Potsdamer Temperaturdaten
-
Klimaskeptiker Info (Andreas Kreuzmann)
2010-02-20 de GISS manipuliert auch Potsdamer TemperaturdatenAls Kommentar im ScienceSkeptical-Blog zu einem Eintrag über die Machenschaften von Stefan Rahmstorf schreibt der Leser upjohn über die Temperaturdaten von der Meßstation auf dem Telegraphenberg (Potsdamer Temperaturmeßfühler auf dem Telegraphenberg - PTT), die beim GISS in Richtung einer Erderwärmung manipuliert wurden.
Quelle: upjohn 20. Februar 2010
Hallo All,
ich habe mir über Fasching einen Gag erlaubt, dessen Resultate ich kurz vorstellen möchte.
Der GISS-Datensatz der NASA ist bekanntlich nicht gänzlich unumstritten. Aus ihm heraus zitiert der "Potsdamer Professor" gerne. Der GISS-Datensatz beinhaltet auch Monats-Durchschnitts-Daten des Potsdamer Temperaturmeßfühlers auf dem Telegrafenberg - PTT (ein Steinwurf weit weg vom PIK).
Da der PTT seit 1893 bis heute mißt, müßte auch der GISS-Datensatz diese Daten enthalten. Er tut das auch, wie man nachprüfen kann unter giss.nasa.gov.
Was sofort auffällt, wenn man die dortigen Daten mit den monatlichen Temperaturdaten des PTT abgleicht, ist:
- der GISS-Datensatz beinhaltet nur die Daten von 1893-1991 (1992-2010 fehlen vollständig)
- der GISS-Datensatz beinhaltet nur Daten, die auf eine Nachkommastelle gerundet sind, während PTT zwei Nachkommastellen hat. Die Rundungen sind nicht konsequent, sondern laufen in eine bestimmte Richtung. Man vergleiche z.B. die Temp.-Daten des Januars 1893 (PTT: -8,19; GISS: -8,2) und Januar 1895 ( PTT: -3,54; GISS: -3,6). Man mache sich das Vergnügen und vergleiche alle Monats-Durchschnittswerte zwischen PTT und GISS für 1893 bis 1991 und man findet sehr Erhellendes!
- der Datensatz für das Jahr 1933 fehlt in GISS für alle Monate, ist aber in PTT komplett vorhanden.
- Daten für die Monate 02.1983, 04.1991, 09.1990 und 12.1986 fehlen komplett in GISS, sind aber in PTT vorhanden.
Ich habe absichtlich noch nichts dazu gesagt, was dies für Konsequenzen auf die Temperaturaussage dieses Meßfühlers hat, wenn man die PTT-Daten nach GISS-Manier behandelt.
Jeder mache sich bitte selbst mit Excel das Vergnügen, dies selbst graphisch aufzuarbeiten und dann die Augenbraunen zu lüften. Meine persönliche Meinung ist, daß ein gewisser Professor auf dieses Problem angesprochen werden sollte.
Mal sehen, ob er rot wird und zwar entweder aus Scham (weil die Aussagen von GISS und PTT anders aussehen) oder aus Wut (weil GISS ganz eindeutig an den PTT-Daten manipuliert im Sinne der Klimaerwärmung).
Schade, daß "upjohn" sich aus beruflichen Gründen nicht exponieren will. Von ihm können wir hoffentlich noch mehr Erhellendes erwarten.
-
Science Skeptical Blog
2010-02-02 de Wie ein Klimaforscher die Erwärmung voranschreiten lässt
↑ f Mit welchen Tricks deutsche Universitäten abweichende Meinungen niederhalten
- Treibhäuser des Klima-Alarmismus - Mit welchen Tricks deutsche Universitäten abweichende Meinungen niederhalten
- Update 1: Beim "Klimaschutz" wird die Freiheit der Wissenschaft an den Universitäten missachtet.
- Update 2: Akademiker 'lügen regelmäßig, um Forschungsgelder zu ergattern'
↑ Treibhäuser des Klima-Alarmismus - Mit welchen Tricks deutsche Universitäten abweichende Meinungen niederhalten
-
EIKE Europäisches Institut für Klima und Energie
Ein Interview mit EIKE Vizepräsident Michael Limburg geführt von Fred. F. Mueller
2016-04-03de Treibhäuser des Klima-Alarmismus - Mit welchen Tricks deutsche Universitäten abweichende Meinungen niederhaltenUniversitäten haben eigentlich die Aufgabe, die Freiheit der Forschung und Lehre zu verteidigen und den akademischen Nachwuchs anzuhalten, das Streben nach Wahrheit und Wissenschaftlichkeit zu seiner Leitschnur zu machen.
An Zeiten, in denen dies anders war und nur Vertreter z.B. eines "gefestigtem Klassenstandpunkts" geduldet wurden, erinnert man sich insbesondere in Deutschland eher mit unguten Gefühlen.
Leider scheinen diese unguten Zeiten schon wieder heraufzudämmern, wenn man sieht, mit welcher Dreistigkeit deutsche Hochschulen inzwischen des Recht beugen, wenn es darum geht, sogenannten "Klimaleugnern" die Erlangung akademischer Würden zu verweigern.
So wie es dem Dipl.-Ing. Michael Limburg erging, dem die wissenschaftliche Anerkennung seiner Dissertation versagt wurde - nicht weil diese fachlich fehlerhaft war, sondern weil sie nicht in den Rahmen des aktuell politisch genehmen Klimalarmismus passte.
↑ Update 1: Beim "Klimaschutz" wird die Freiheit der Wissenschaft an den Universitäten missachtet.
-
EIKE Europäisches Institut für Klima und Energie
2016-04-08 de Beim "Klimaschutz" wird die Freiheit der Wissenschaft an den Universitäten missachtet.Ich habe das Interview mit Ihnen zu Ihrem Promotionsvorhaben gelesen.
Das Verhalten der Universität Leipzig ist in der Tat skandalös, würde an anderen Universitäten jedoch ähnlich ablaufen.
Die von Ihnen beschriebene kritiklose Einheitsmeinung zahlreicher Wissenschaftler und Fakultäten und den Versuch, jeglichen Kritiker mundtot zu machen, kann ich aus meiner Erfahrung an der Universität XYZ leider bestätigen.
In meiner Fachgruppe ist unter den Kollegen das Thema "CO2 bedingter Klimawandel" ein Axiom, über das jegliche Diskussion abgeblockt wird und bei der ein Ausscheren aus der Einheitsmeinung die vollständige Marginalisierung zur Folge hat.
Da ich aus geologischer Sicht keine unterstützende Argumente für die von den Kollegen (unter denen freilich wenige Meteorologe sind, der Rest eine bunte Mischung von Geowissenschaftlern, die alle beim Thema Klimawandel aber keine Zweifel haben) vertretene Einheitsmeinung habe, sondern aus der Erdgeschichte eher widersprechende Sachverhalte kenne, werde ich bei der Kommissionsauswahl für Promotionen und Berufungen vollständig übergangen.
Dass der Versuch der Gleichschaltung der Meinungen derart gut funktioniert, liegt vor allem an dem Dressurakt, der bei der Bewilligung von Drittmitteln ausgeübt wird: fehlt in DFG-Projekten der obligatorische Hinweis auf Klimawandel und das entsprechende Glaubensbekenntnis, dann ist der Antrag chancenlos.
Ich stelle daher seit Jahren keine DFG-Anträge mehr.
Wir leben ganz offensichtlich in einer Phase der "Normalwissenschaft", wie Thomas Kuhn dies bezeichnet, in der Ergebnisse schon vor der Forschung feststehen. Forschung zum Thema Klimawandel ist gewissermassen zum "cargo-cult" geworden, bei dem bislang die Geldmittel noch reichlich fliessen.
Mich tröstet der Umstand, dass der Paradigmenwechsel irgendwann stattfinden wird.
↑ Update 2: Akademiker 'lügen regelmäßig, um Forschungsgelder zu ergattern'
-
EIKE Europäisches Institut für Klima und Energie
2016-03-17 de Akademiker 'lügen regelmäßig, um Forschungsgelder zu ergattern'
↑ g Akademiker 'lügen regelmäßig, um Forschungsgelder zu ergattern'
-
EIKE Europäisches Institut für Klima und Energie
2016-03-17 de Akademiker 'lügen regelmäßig, um Forschungsgelder zu ergattern'
⇧ 18 Niederlande / Netherlands / Pays Bas
↑ a en One third of the Netherlands suddenly rises above sea level
-
CLIMATEGATE
2010-02-04 en Good news! One third of the Netherlands suddenly rises above sea levelIf rising sea levels from global warming can drown whole islands, what could the rising pressure of more water do, smashing against the dykes of the Netherlands?
Oh, the horror! After all, 65% of their National Domestic Product is produced in the 55% of the Netherlands that is below sea level.
Why, that would...
Oops... hold on.
What's this?
The national statistics office says just 20% of the country is below sea level and 19% of the GDP is earned there?
Well, where the hell did we get the bigger, more frightening numbers?
The 2007 Intergovernmental Panel on Climate Change (IPCC report, that's where.
⇧ 19 Schweden / Sweden / Suede
- a de
Schwedische Daten wurden von der CRU "processed"
Schweden bezichtigen Phil Jones der Falschaussage
en Swedish data have been "processed" by CRU
Climate scientist delivers false statement in parliament enquiry
↑
a Schwedische Daten wurden von der CRU "processed"
Schweden bezichtigen Phil Jones der Falschaussage
en Swedish data have been "processed" by CRU
Climate scientist delivers false statement in parliament enquiry
-
Klimaskeptiker Info (Andreas Kreuzmann)
2010-03-05 de Schweden bezichtigen Phil Jones der FalschaussageDie schwedische Stockholm Initiatve bezichtigt Phil Jones der Falschaussage vor dem Ausschuß des britischen Unterhauses.
-
Watts Up With That? (Antony Watts)
2010-03-05 en Swedes call out Jones on data availabilityClimate scientist delivers false statement in parliament enquiry
It has come to our attention, that last Monday (March 1), Dr. Phil Jones, head of the Climatic Research Unit at the University of East Anglia (CRU), in a hearing with the House of Commons Science and Technology Committee made a statement in regards to the alleged non-availability for disclosure of Swedish climate data.
Dr. Jones asserted that the weather services of several countries, including Sweden, Canada and Poland, had refused to allow their data to be released, to explain his reluctance to comply with Freedom of Information requests.
This statement is false and misleading in regards to the Swedish data.
All Swedish climate data are available in the public domain.
As is demonstrated in the attached correspondence between SMHI (Swedish Meteorological and Hydrological Institute), the UK Met Office and Dr. Jones (the last correspondence dated yesterday March 4), this has been clearly explained to Dr. Jones.
What is also clear is that SMHI is reluctant to be connected to data that has undergone "processing" by the East Anglia research unit.
-
SMHI - Swedish Meteorological and Hydrological Institute
2009-12-21 en
Letter to Prof. Phil Jones
Given the information that the version of the data from the SMHI stations that you hold are likely to differ from the data we hold, SMHI do not want the data to be released on your web site.
-
SMHI - Swedish Meteorological and Hydrological Institute
2009-03-04 en
Letter to Prof. Phil Jones
Our response was based on your information that it was likely that the version held by you would most likely differ from our current holdings.
It has never been our intention to withhold any data but we feel that it is paramount that data that has undergone, for instance, homogenisation by anyone other than SMHI is not presented as SMHI data.
We see no problem with publication of the data set together with a reference stating that the data included in the dataset is based on observations made by SMHI but it has undergone processing made by your research unit. We would also prefer a link to SMHI or to our web site where the original data can be obtained.
⇧ 20 Finnland / Finland / Finlande
↑ a Which NASA climate data to believe?v
-
Watts Up With That? (Antony Watts)
2010-04-17 en Which NASA climate data to believe?
-
Climate Audit (Steve McIntyr)
2010-04-15 en GISS: Warmest March ever in Finland
⇧ 21 Tschechische Republik / Czech Republic / République tchèque
↑ a en CzechGate: Climate scientists dump world's second oldest 'cold' climate record
![]()
![]()
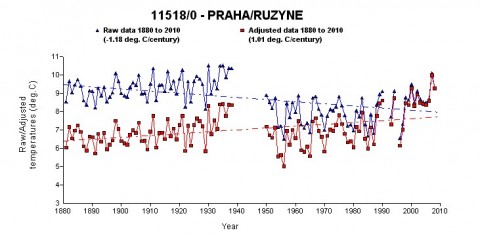
-
CLIMATEGATE
2010-02-16 en CzechGate: Climate scientists dump world's second oldest 'cold' climate record
⇧ 22 Bolivien / Bolivia / Bolivie
↑
a Der Bolivien-Effekt
en The Bolivia Effect
fr L'effet Bolivien
|
|
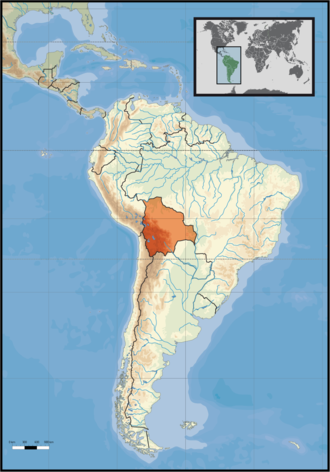

-
KlimaskeptikerIinfo (Andreas Kreuzmann)
2010-01-08 de Der Bolivien-Effekt oder Warum den GISS-Temperaturen nicht getraut werden kann
-
Musings from the Chiefio
2010-01-08 en GHCN - GIStemp Interactions - The Bolivia Effect
⇧ 23 Australien / Australia / Australie
- a de
GISS hat australische Temperaturmessungen manipuliert
en GISS manipulates climate data in Australia - b en Australia: Darvin Airport
- c Australian "homogenisation" of Data
- d Temperature data missing for Australia
- e Major new analysis by Aussies show IPCC manipulated data
- f de
Die australische Temperaturgeschichte - ein Gesamtüerblick
en The Australian Temperature Record- The Big Picture - g de
Massenweise Fehler in den GHCN-Daten für Australien
en "Gross" Data Errors in GHCN V2. for Australia
↑
a GISS hat australische Temperaturmessungen manipuliert
en GISS manipulates climate data in Australia
de
-
Klimaskeptiker Info (Andreas Kreuzmann)
2010-02-11 de
GISS hat australische Temperaturmessungen manipuliert
Trotz gegenteiliger Versicherungen hat GISS die Temperaturaufzeichnungen von zwei benachbarten Wetterstationen in Mackay (Australien) "angepaßt", um einen Abkühlungstrend umzukehren und einen Erwärmungstrend bei der anderen Station zu verstärken.
Eine Untersuchung präsentiert Beweise dafür, daß diese Eingriffe nicht gerechtfertigt, sondern tatsächlich eine Manipulation der Daten waren.
en
-
kenskingdom Blog
2010-02-05 en GISS manipulates climate data in Mackay
Another Smoking Gun from Australia? How GISS adjusts temperature records in two adjacent sitesDespite its assurances, GISS has adjusted the temperature records of two sites at Mackay to reverse a cooling trend in one and increase a warming trend in another.
This study presents evidence that this is not supportable and is in fact an instance of manipulation of data.
↑ b en Australia: Darvin Airport
![]()
![]() Blue: Raw and Red: Adjusted Temperatures
Blue: Raw and Red: Adjusted Temperatures
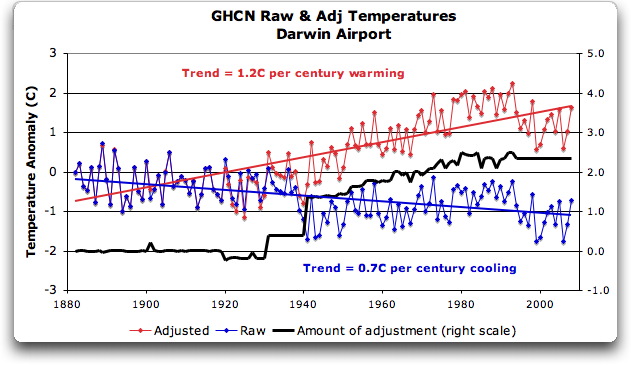
-
Watts Up With That? (Antony Watts)
2009-12-08 en The Smoking Gun At Darwin Zero
There is general agreement that the earth has warmed since then. Climategate doesn't affect that.
Before getting homogenized, temperatures in Darwin were falling at 0.7 Celcius per century ... but after the homogenization, they were warming at 1.2 Celcius per century.
And the adjustment that they made was over two degrees per century ... when those guys "adjust", they don't mess around. And the adjustment is an odd shape, with the adjustment first going stepwise, then climbing roughly to stop at 2.4C.
-
American Thinker
2010-01-22 en http://www.americanthinker.com/2010/01/climategate_cru_was_but_the_ti.html
The "adjustments" actually reversed the 20th-century trend from temperatures falling at 0.7°C per century to temperatures rising at 1.2°C per century. Eschenbach isolated a single station and found that it was adjusted to the positive by 6.0°C per century, and with no apparent reason, as all five stations at the airport more or less aligned for each period. His conclusion was that he had uncovered "indisputable evidence that the 'homogenized' data has been changed to fit someone's preconceptions about whether the earth is warming."
↑ c en Australian "homogenisation" of data
-
John O Sullivan
2010-01-20 en Top Australian Scientists Admit 'GIGO' (Garbage In, Garbage Out) On Climate Change
↑ d en Temperature data missing for Australia
-
Hide the decline
2010-03-25 en Temperature data missing for Australia
↑ e en Major new analysis by Aussies show IPCC manipulated data
-
CLIMATEGATE
2010-01-31 en Major new analysis by Aussies show IPCC manipulated data
-
Quadrant Online
2010-01-31 en The IPCC's flawed data
Climategate - IPCC's Flawed Temperature Picture Revealed
↑
f Die australische Temperaturgeschichte - ein Gesamtüerblick
en The Australian Temperature Record- The Big Picture
-
EIKE Europäisches Institut für Klima und Energie
2010-08-12 de Die australische Temperaturgeschichte - ein Gesamtüerblick!Was rief doch der geheimnisvolle Programmierer Harry* in der HARRY_READ_ME Datei, die mit den Climategate Dateien ans Licht kam?
"...allmählich habe ich die Nase voll vom Zustand der australischen Daten."
-
Watts Up With That? (Antony Watts)
2010-07-27 en The Australian Temperature Record- The Big Picture"...getting seriously fed up with the state of the Australian data."
(Harry the mystery programmer, in the HARRY_READ_ME file released with the Climategate files.)
↑
g Massenweise Fehler in den GHCN-Daten für Australien
en "Gross" Data Errors in GHCN V2. for Australia
-
Klimaskeptiker Info (Andreas Kreuzmann)
2010-11-10 de Massenweise Fehler in den GHCN-Daten für Australien
-
Watts Up With That? (Antony Watts)
2010-11-10 en "Gross" Data Errors in GHCN V2. for Australia
⇧ 24 Neuseeland / New Zealand / Nouvelle-Zélande
- a de
Klimadatenfälschung in Neuseeland
en The NIWA New Zealand data adjustment story - b en Now KiwiGate: New Zealand climatologists destroy nation's raw temperature data
- cde
Die Erwärmung, die es nicht gab
en NIWA's Kiwi Kaper - Crisis in New Zealand climatology: The warming that wasn't - d de
Neuseeländisches Institut wegen Temperatur-Datenmanipulation verklagt
en New Zealand's NIWA sued over climate data adjustments - e de
Neuseelands Wetterbehörde zieht Verantwortung für historische
Temperaturangaben zurück
en Observations on NIWA's Statement of Defence
↑
a de Klimadatenfälschung in Neuseeland
en The NIWA New Zealand data adjustment story
|
|
|
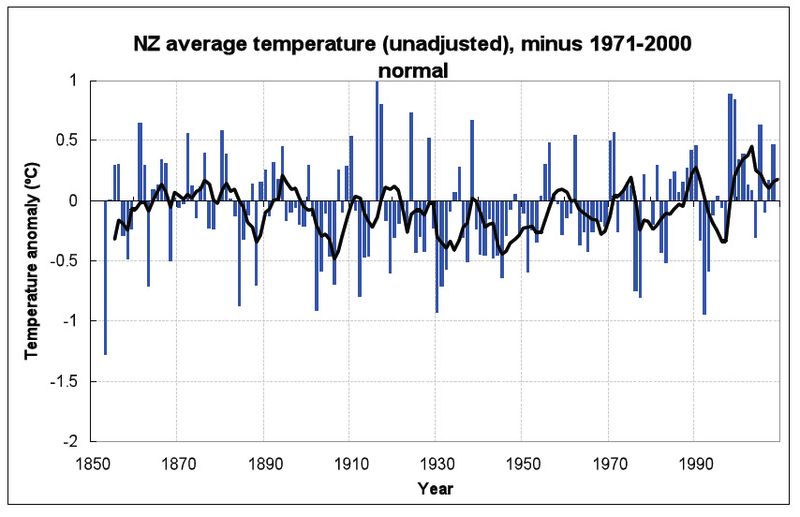
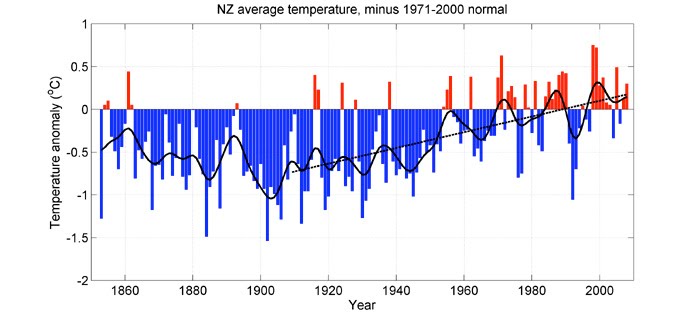
-
Alles Schall und Rauch
2009-11-26 de Weitere Klimadatenfälschung in Neuseeland
Der "Climategate-Skandal" weitet sich immer mehr aus. Wie TBR berichtet, ist die oberste klimaberatende Organistion der Neuseeländischen Regierung, NIWA, unter Kritik geraten, weil sie angeblich die rohen Temperaturdaten manipuliert hat, um eine globale Erwärmung zu zeigen die es gar nicht gibt.
-
Watts Up With That? (Antony Watts)
2009-11-25 en Uh, oh - raw data in New Zealand tells a different story than the "official" one.
2009-11-27 en More on the NIWA New Zealand data adjustment story
↑ b Now KiwiGate: New Zealand climatologists destroy nation's raw temperature data
-
CLIMATEGATE
2010-02-02 en Now KiwiGate: New Zealand climatologists destroy nation's raw temperature dataWith great embarrassment the National Institute of Water and Atmospheric Research (NIWA) in New Zealand has been forced to release it's raw temperature data, but they have no record of why and when any adjustments were made to this data.
Yet again, it appears climate scientists are re-writing the temperature history of the world.
-
Scoop Sci-Tech
2010-02-01 en NIWA Unable To Justify Official Temperature RecordThe National Institute of Water and Atmospheric Research (NIWA) has been urged by the New Zealand Climate Science Coalition (NZCSC) to abandon all of its in-house adjustments to temperature records.
This follows an admission by NIWA that it no longer holds the records that would support its in-house manipulation of official temperature readings.
In December, NZCSC issued a formal request for the schedule of adjustments under the Official Information Act 1982, specifically seeking copies of "the original worksheets and/or computer records used for the calculations".
On 29 January, NIWA responded that they no longer held any internal records, and merely referred to the scientific literature.
"The only inference that can be drawn from this is that NIWA has casually altered its temperature series from time to time, without ever taking the trouble to maintain a continuous record.
The result is that the official temperature record has been adjusted on unknown dates for unknown reasons, so that its probative value is little above that of guesswork.
In such a case, the only appropriate action would be reversion to the raw data record, perhaps accompanied by a statement of any known issues," said Terry Dunleavy, secretary of NZCSC.
"NIWA's website carries the raw data collected from representative temperature stations, which disclose no measurable change in average temperature over a period of 150 years.
But elsewhere on the same website, NIWA displays a graph of the same 150-year period showing a sharp warming trend. The difference between these two official records is a series of undisclosed NIWA-created 'adjustments'.
"Late last year our coalition published a paper entitled 'Are We Feeling Warmer Yet?' and asked NIWA to disclose the schedule detailing the dates and reasons for the adjustments.
The expressed purpose of NZCSC was to replicate the calculations, in the best traditions of peer-reviewed science.
"When NIWA did not respond, Hon Rodney Hide asked Oral and Written Questions in Parliament, and attended a meeting with NIWA scientists.
All to no avail, and the schedule of adjustments remained a secret. We now know why NIWA was being so evasive - the requested schedule did not exist.
"Well qualified climate scientist members of our coalition believe that NIWA has forfeited confidence in the credibility of its temperature recording procedures, and that it cannot be trusted to try to cover up its own ineptitude by in-house adjustments.
What is needed is open access in the public domain to all of the known reasons for post-reading adjustments to enable independent climate analysts to make their own comparative assessments of temperature variations throughout New Zealand since the middle of the 19th century," said Mr Dunleavy
↑
c Die Erwärmung, die es nicht gab
en NIWA's Kiwi Kaper - Crisis in New Zealand
climatology: The warming that wasn't
NIWA = National Institute of Water and Atmospheric Research
NSS = NIWA Seven-station Series
-
Klimaskeptiker Info (Andreas Kreuzmann)
2010-05-15 de Die Erwärmung, die es nicht gabIn Neuseeland stützt sich die lang verbreitete Darstellung der dortigen Temperaturentwicklung des 20. Jahrhunderts auf eine Temperaturreihe mit der Bezeichnung "NIWA Seven-station Series" (NSS), die bei dem National Institute of Water and Atmospheric Research (NIWA) geführt wird und für das 20. Jahrhundert eine Erwärmung um 0,92°C ausweist. Diese Temperaturreihe ist falsch.
Die Rohdaten der Instrumente zeigen im Gegensatz zur NSS-Reihe, daß die Durchschnittstemperaturen in Neuseeland seit rund 150 Jahren bemerkenswert konstant bei 12,6°C ±0,5°C liegen. Die von NIWA produzierten und verbreiteten Daten sind unhaltbar.
Die NSS-Serie wurde von einem einzelnen Regierungsbeamten produziert, ist nicht dokumentiert, es existieren keine Meta-Daten, es fand nie ein Peer-Review-Prozeß statt. Trotzdem haben seit 15 Jahren alle Verwaltungsstufen in Neuseeland die behauptete 0,92°C-Erwärmung benutzt und verbreitet, sie bildet einen wesentlichen Teil der Darstellungen im 3. und 4. IPCC-Bericht, die sich auf Australien und Neuseeland beziehen.
Auch hier hat sich wieder alarmistischer Schrott in den IPCC-Bericht eingeschlichen. Diesmal allerdings trifft das IPCC wohl nicht die Hauptschuld daran.
-
Watts Up With That? (Antony Watts)
2010-05-15 en NIWA's Kiwi Kaper - Crisis in New Zealand climatology: The warming that wasn'tThe official archivist of New Zealand's climate records, the National Institute of Water and Atmospheric Research (NIWA), offers top billing to its 147-year-old national mean temperature series (the "NIWA Seven-station Series" or NSS). This series shows that New Zealand experienced a twentieth-century warming trend of 0.92°C.
The official temperature record is wrong. The instrumental raw data correctly show that New Zealand average temperatures have remained remarkably steady at 12.6°C +/- 0.5°C for a century and a half. NIWA's doctoring of that data is indefensible.
The NSS is the outcome of a subjective data series produced by a single Government scientist, whose work has never been peer-reviewed or subjected to proper quality checking. It was smuggled into the official archive without any formal process. It is undocumented and sans metadata, and it could not be defended in any court of law. Yet the full line-up of NIWA climate scientists has gone to extraordinary lengths to support this falsified warming and to fiercely attack its critics.
For nearly 15 years, the 20th-century warming trend of 0.92°C derived from the NSS has been at the centre of NIWA official advice to all tiers of New Zealand Government - Central, Regional and Local. It informs the NIWA climate model. It is used in sworn expert testimony in Environment Court hearings. Its dramatic graph graces the front page of NIWA's printed brochures and its website.
Internationally, the NSS 0.92°C trend is a foundation stone for the Australia-New Zealand Chapter in the IPCC's Third and Fourth Assessment Reports. In 1994, it was submitted to HadleyCRUT, so as to influence the vast expanses of the South Pacific in the calculation of globally-averaged temperatures.
↑
d Neuseeländisches Institut wegen Temperatur-Datenmanipulation verklagt
en
New Zealand's NIWA sued over climate data adjustments
![]()
![]()

-
Klimaskeptiker Info (Andreas Kreuzmann)
2010-08-15 de Neuseeländisches Institut wegen Temperatur-Datenmanipulation verklagtDie staatliche neuseeländisches NIWA wird von der New Zealand Climate Science Coalition verklagt, weil das NIWA die Temperaturdaten auf der Grundlage einer unbelegten These dergestelt manipuliert hat, daß aus einer geringen Erwärmung im 20. Jahrhunderts eine weit überdurchschnittliche Erwärmung von 1°C wurde.
-
Watts Up With That? (Antony Watts)
2010-08-16 en New Zealand's NIWA sued over climate data adjustments
Quelle/Source:
-
Stuff.co.nz
2010-08-16 en Niwa sued over data accuracy
↑
e Neuseelands Wetterbehörde zieht Verantwortung für historische
Temperaturangaben zurück
en
Observations on NIWA's Statement of Defence
-
EIKE Europäisches Institut für Klima und Energie
2010-10-23 de Neuseelands Wetterbehörde zieht Verantwortung für historische Temperaturangaben zurück!Das NIWA (National Institute of Water & Atmospheric Research) hat eine hilflose Erklärung der Verteidigung veröffentlicht
- eine Verteidigung, die man vornimmt, wenn man beschlossen hat, sich zu ergeben.
-
Climate Conversation Group
2010-10-06 en Observations on NIWA's Statement of DefenceThey're not defending the temperature record or the mistakes in it, they're virtually saying: "You're right, the dataset could be shonky, so we're washing our hands of it."
Which gives us no confidence in the "science" they might have applied to it.
What the hell's going on?
I actually hope their lawyers know a cunning trick to get them out of this, and it's not what it seems.
Because it's my NIWA too!But it gets worse.
NIWA has formally stated that,
in their opinion, they are not required to use the best available information nor to apply the best scientific practices and techniques available at any given time.
They don't think that forms any part of their statutory obligation to pursue "excellence".
⇧ 25 China / China / Chine
↑ a en Chinese Data
-
Klimaskeptiker Info (Andreas Kreuzmann)
2010-01-22 de ClimateGate: Phil Jones und Wei-Chyung Wang vertuschten Datenfehler
Prof. Phil Jones, Direktor des CRU und einer der Hauptbeschuldigten des ClimateGate-Skandals, hat 1990 zusammen mit Professor Wei-Chyung Wang von der State University von New York in Albany ein einflußreiches Papier in Nature veröffentlicht, nach dem der Urbane-Hitzeinsel-Effekt (UHI) minimal sein sollte.Wie sich jetzt herausstellt, ging bei diesem Papier nicht alles mit rechten Dingen zu.
The Indipendent schreibt dazu:
Jones und Wei-Chyung führten in ihrem fraglichen Papier von 1990 lange Meßreihen von chinesischen Wetterstationen an, davon die Hälfte auf dem Land und die andere Hälfte in Städten.
Die Datenreihen stammten von Professor Wei-Chyung.
Der Nature-Artikel wurde im letzten IPCC-Bericht von 2007 als Beleg zitiert.
Jetzt wurde bekannt, daß als Klimaskeptiker nach den präzisen Standorten der 84 Stationen fragten, Prof. Jones zunächst ablehnte, die Details preiszugeben.
Und als er sie schließlich doch herausgab, waren für die Stationen, die angeblich auf dem Land lagen, keine Standorte angegeben.
-
Watts Up With That? (Antony Watts)
2010-02-01 en Climategate intensifies: Jones and Wang apparently hid Chinese station data issues
⇒ de Fortsetzung en Continuation fr Continuation
↑