4.2.3 Manipulationen III
en Manipulations Part III
fr Manipulations, partie III
| ⇨ | Manipulation: | Manipulation I | Manipulation II | Manipulation III | Kritik an IPCC‑Daten |
|---|
Mit folgenden Links wird von anderen Webseiten auf diese Seite verwiesen:
| de | en | fr |
|---|---|---|
|
Klima-Skandal Manipulationen III |
Climate Scandal Manipulations III |
Scandale climatique Manipulations III |
- a de
Müll im IPCC-Bericht 2007 - unqualifizierte Zitate
en Where does Greenpeace stop and the IPCC begin? - b en
The IPCC: 5,600 small white lies
fr Sur 18.531 références 5.587 sources citées par le GIEC ne sont pas scientifiques - c en Climate Model Deficiencies in IPCC AR4 PSB
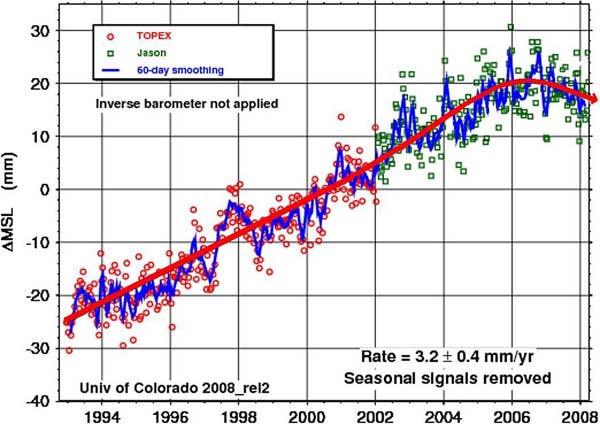
- a de Was ist dran am globalen Anstieg des Meeresspiegels?
- b en Oceangate: sea levels proven to have fallen for past six years
- a de
2010/2011: Das arktische Meereis hat zugenommen
en 2010/2011: Arctic Ice Volume Has Increased - b de Wird es in Grönland wärmer? Nein - kälter!
- c de
Subtropische Meeresströmungen lässt Grönlands Gletscher
schmelzen
en Greenland glaciers - melt due to sea current change, not air temperature - d en Is it possible that the IPCC is trying to rewrite the history books?
- a de
Ein weiterer Fehler des IPCC: Antarktis Eis um 50 % unterschätzt
en Another IPCC Error: Antarctic Sea Ice Increase Underestimated by 50%
fr Une autre erreur du GIEC: La glace de l'antarctique a été sous-estimée de 50% - b de
Weitere Falschdarstellung im IPCC-Bericht:
Ausdehnung des Meereises rund um die Antarktis
en Yet Another Incorrect IPCC Assessment: Antarctic Sea Ice Increase - c de
Temperaturtrend auf antarktischer Halbinsel nicht nachvollziehbar
en Antarctic Agreements and Disagreements - d de
Eis in der Ostantarktis wird von unten her dicker
en East Antarctic Ice Sheet getting thicker from underneath - e de
Klimamodelle können die Zunahme des antarktischen Meereises nicht
nachvollziehen
en Antarctic sea ice reaches record high while IPCC models predicted the opposite
⇧ 1 IPCC-Quellen / IPCC Sources
- a de
Müll im IPCC-Bericht 2007 - unqualifizierte Zitate
en Where does Greenpeace stop and the IPCC begin? - b en
The IPCC: 5,600 small white lies
fr Sur 18.531 références 5.587 sources citées par le GIEC ne sont pas scientifiques - c en Climate Model Deficiencies in IPCC AR4 PSB
↑
a Müll im IPCC-Bericht 2007 - unqualifizierte Zitate
en
Where does Greenpeace stop and the IPCC begin? -
Sometimes it's difficult to tell.
|
|
Donna Laframboise Considered the climate Bible by governments around the world, the UN's Intergovernmental Panel on Climate Change (IPCC) report is meant to be a scientific analysis of the most authoritative research. Instead, it references literature generated by Greenpeace - an organization known more for headline-grabbing publicity stunts than sober-minded analysis. The idea that 2,500 "scientific expert reviewers" provided feedback about the report during its pre-publication phase sounds awesome. But many of those people aren't scientists at all. They're professional activists in the employ of environmental organizations. |
-
Klimaskeptiker Info
2010-01-24 de Müll im IPCC-Bericht 2007 - unqualifizierte Zitate
-
Watts Up With That? (Antony Watts)
2010-01-29 en Gate du Jour - Now it's Greenpeace reports in the IPCC AR4
-
Watts Up With That? (Antony Watts)
2010-02-02 en Gate Du Jour: IPCC AR4 references NYT story
-
Watts Up With That? (Antony Watts)
2010-02-01 en Gate Du Jour: IPCC gets the boot (cleaned)
| de | en | fr |
|---|---|---|
|
Klima: Politik Es besteht kein Konsens über die Ursache des Klimawandels |
Climate: Politics There is no consensus on the origin of climate change |
Climat: Politique Il n'y a pas de consensus sur le changement climatique |
↑
b 1.2 en
The IPCC: 5,600 small white lies
fr
Sur 18.531 références 5.587 sources citées par le GIEC ne sont pas scientifiques
en
-
JoNova
en The IPCC: 5,600 small white lies
Rajendra Pachauri states:
IPCC studies only peer-review science. Let someone publish the data in a decent credible publication. I am sure IPCC would then accept it, otherwise we can just throw it into the dustbin.
... volunteers who have conscientiously tested the IPCC by going through 18,500 references.
And the final total?
Fully 5,600, or 30% of their references are not peer reviewed.
fr
-
Contrepoints
2010-04-20 fr Sur 18.531 références 5.587 sources citées par le GIEC ne sont pas scientifiquesMalgré le fait que Rajendra Pachauri, président du GIEC, assure que la Bible de l'alarmisme climatique n'utilise que des sources «peer-reviewed», plus de cinq mille sources citées dans le rapport font référence à des textes qui ne remplissent pas ce critère.
↑ c en Climate Model Deficiencies in IPCC AR4 PSB
-
Watts Up With That? (Antony Watts)
2010-10-21 en Climate Model Deception - See It for Yourself
| Climate Model Deficiencies in IPCC AR4 PSB | |||
| Chapter | Section | Page | Quotation |
| 6 | 6.5.1.3 | 462 | "Current spatial coverage, temporal resolution and age control of available Holocene proxy data limit the ability to determine if there were multi-decadal periods of global warmth comparable to he last half of the 20th century." |
| 6 | 6.7 | 483 | "Knowledge of climate variability over the last 1 to 2 kyr in the SH and tropics is severely limited by the lack of paleoclimatic records. In the NH, the situation is better, but there are important limitations due to a lack of tropical records and ocean records. Differing amplitudes and variability observed in available millennial-length NH temperature reconstructions, and the extent to which these differences relate to choice of proxy data and statistical calibration methods, need to be reconciled. Similarly, the understanding of how climatic extremes (i.e., in temperature and hydro-climatic variables) varied in the past is incomplete. Lastly, this assessment would be improved with extensive networks of proxy data that run up to the present day. This would help measure how the proxies responded to the rapid global warming observed in the last 20 years, and it would also improve the ability to investigate the extent to which other, non-temperature, environmental changes may have biased the climate response of proxies in recent decades." |
| 8 | Executive Summary | 591 | "The possibility that metrics based on observations might be used to constrain model projections of climate change has been explored for the first time, through the analysis of ensembles of model simulations. Nevertheless, a proven set of model metrics that might be used to narrow the range of plausible climate projections has yet to be developed." |
| 8 | Executive Summary | 593 | “ Recent studies reaffirm that the spread of climate sensitivity estimates among models arises primarily from inter-model differences in cloud feedbacks. The shortwave impact of changes in boundary-layer clouds, and to a lesser extent mid-level clouds, constitutes the largest contributor to inter-model differences in global cloud feedbacks. The relatively poor simulation of these clouds in the present climate is a reason for some concern. The response to global warming of deep convective clouds is also a substantial source of uncertainty in projections since current models predict different responses of these clouds. Observationally based evaluation of cloud feedbacks indicates that climate models exhibit different strengths and weaknesses, and it is not yet possible to determine which estimates of the climate change cloud feedbacks are the most reliable.” |
| 8 | 8.1.2.2 | 594 | “What does the accuracy of a climate model’s simulation of past or contemporary climate say about the accuracy of its projections of climate change” This question is just beginning to be addressed, exploiting the newly available ensembles of models.” |
| 8 | 8.1.2.2 | 595 | “The above studies show promise that quantitative metrics for the likelihood of model projections may be developed, but because the development of robust metrics is still at an early stage, the model evaluations presented in this chapter are based primarily on experience and physical reasoning, as has been the norm in the past.” |
| 8 | 8.3 | 608 | “Consequently, for models to predict future climatic conditions reliably, they must simulate the current climatic state with some as yet unknown degree of fidelity.” |
| 8 | 8.6.3.2.3 | 638 | “Although the errors in the simulation of the different cloud types may eventually compensate and lead to a prediction of the mean CRF in agreement with observations (see Section 8.3), they cast doubts on the reliability of the model cloud feedbacks.” |
| 8 | 8.6.3.2.3 | 638 | “Modelling assumptions controlling the cloud water phase (liquid, ice or mixed) are known to be critical for the prediction of climate sensitivity. However, the evaluation of these assumptions is just beginning (Doutraix-Boucher and Quaas, 2004; Naud et al., 2006). |
| 8 | 8.6.4 | 640 | “A number of diagnostic tests have been proposed since the TAR (see Section 8.6.3), but few of them have been applied to a majority of the models currently in use. Moreover, it is not yet clear which tests are critical for constraining future projections. Consequently, a set of model metrics that might be used to narrow the range of plausible climate change feedbacks and climate sensitivity has yet to be developed.” |
| 9 | Executive Summary | 665 | “Difficulties remain in attributing temperature changes on smaller than continental scales and over time scales of less than 50 years. Attribution at these scales, with limited exceptions, has not yet been established.” |
| 10 | 10.1 | 754 | “Since the ensemble is strictly an ‘ensemble of opportunity’, without sampling protocol, the spread of models does not necessarily span the full possible range of uncertainty, and a statistical interpretation of the model spread is therefore problematic.” |
| 10 | 10.5.4.2 | 805 | “The AOGCMs featured in Section 10.5.2 are built by selecting components from a pool of alternative parameterizations, each based on a given set of physical assumptions and including a number of uncertain parameters.” |
| de | en | fr |
|---|---|---|
|
IPCC Intergovernmental Panel on Climate Change Fundamental falsche Klima-Modelle |
IPCC Intergovernmental Panel on Climate Change Fundamentally wrong Climate Models |
GIEC Groupe d'experts intergouvernemental sur l'évolution du climat Modèles du climat erronés |
⇧ 2 Meeresspiegel / Sea levels
- a de Was ist dran am globalen Anstieg des Meeresspiegels?
- b en Oceangate: sea levels proven to have fallen for past six years
↑ de Was ist dran am globalen Anstieg des Meeresspiegels?
|
|
|
de
MeeresspiegelGate
en Sea Level Gate
-
EIKE Europäisches Institut für Klima und Energie / Prof. Dr. Nils-Axel Mörner
2011-12-16 de Der Meeresspiegel im Sumpf der SkandaleMalediven: Der Meeresspiegel war während der letzten 50 Jahre oder so stabil,
nachdem er um 20 cm um das Jahr 1960 gefallen war;
er lag im 18. Jahrhundert ein ganzes Stück unter dem heutigen Level
und im 17. Jahrhundert etwa 50 bis 60 cm über dem heutigen Niveau.Daraus wird deutlich, dass Anstieg und Rückgang des Meeresspiegels völlig unabhängig von der sog. "Klimaänderung" erfolgen.
Im Jahre 900 beispielsweise lag der Meeresspiegel in Tansania hoch und in Peru niedrig; ein Jahrhundert später ist es genau umgekehrt.
Oft wird auch vergessen, dass zwar Meeresspiegel steigen und fallen können ("Eustatik"), dass aber auch Landmassen selbst steigen und fallen können ("Isostasie").
-
Prof. em. Nils Axel Mörner
en THE GREAT SEA-LEVEL HUMBUG -
There Is No Alarming Sea Level Rise!
"While the IPCC and its boy scouts present wilder and wilder sea level predictions for the near future, the freal observational facts demonstrate that sea level has remained virtually stable for the last 40-50 years,"
New paper published in 21st Century Science & Technology by Professor Nils-Axel Morner, past president (1999-2003) of the INQUA Commission on Sea Level Changes and Coastal Evolution, and leader of the Maldives Sea Level Project.
(Source: The New Zeland Climat Science Coalition)
-
Prof. em. Nils Axel Mörner
en No Alarming Sea Level Rise / Nature against IPCC /
Observations vs Models
(PowerPoint Presentation)
-
Prof. em. Nils Axel Mörner
 ARCTIC ENVIRONMENT BY THE MIDDLE OF THIS CENTURY
-
Prof. em. Nils-Axel Mörner
2010-06-04 en The Maldives Are Not Sinking
An excerpt of the documentary "Global Warming Doomsday Called Off!"
In this clip professor Nils Axel Morner, from Stockholm University travels to the Maldives and finds out that the ocean levels have dropped in recent years.
|
Nils-Axel Mörner *1938 †2020-10-16 |
Dr., Head of the Paleogeophysics and Geodynamics department at
Stockholm University in Sweden. 2000-2007 Hauptberichterstatter beim IPCC für den Meeresspiegel-Anstieg. ▶Nils-Axel Mörner: Who is who (Skeptiker) ▶Nils-Axel Mörner: Who is who (Skeptische Wissenschaftler des IPCC) ▶Nils-Axel Mörner: Video (Präsentationen) ▶Ausschluss und Maulkorb für Kritiker (Nils-Axel Mörner und das IPCC) |
-
EIKE Europäisches Institut für Klima und Energie
2010-02-08 de Was ist dran am globalen Anstieg des Meeresspiegels?Das IPCC - häufig hochtrabend "Weltklimarat" genannt - scheut sich nicht auch noch die krudesten Zeitungsenten, sofern sie von Umweltgruppen wie dem WWF kommen und ins Panikkonzert passen, als "wissenschaftlichen" Beleg für seine Phantasien zu bezeichnen.
So wieder geschehen mit der Tartarenmeldung über die Niederlande im IPCC-Bericht 2007.
Dort steht: "Die Niederlande sind das Beispiel dafür, dass das Land sowohl von der Steigung des Meeresspiegels als auch durch Überschwemmungen der Flüsse gefährdet ist, denn 55 Prozent des Landes liegen unter dem Meeresspiegel."
Wie so häufig beim IPCC stimmt auch das nicht, denn nur 26 Prozent der Fläche der Niederlande, (die 41 525 Quadratkilometer beträgt), liegen unter dem Meeresspiegel.
Und bedroht sieht sich dort niemand. Selbst die niederländische Umweltministerin Jaqueline Kramer glaubt diesen Humbug nicht und fordert eine Untersuchung.
Man fragt sich allerdings wofür?
Was es wirklich mit dem Meeresspiegel auf sich hat, erklärt uns einer der weltweit besten Meeresspiegel Experten N.A. Mörner im Glashouse Interview.
-
EIKE Europäisches Institut für Klima und Energie
2010-06-07 de Anstieg des Meeresspiegels - welcher Anstieg?Eine der vielen Präsentationen auf der 4. Internationalen Klimakonferenz des Heartland Instituts (Heartland Institute's fourth International Conference on Climate Change) stammte vom Meeresspiegelexperten Nils Axel Mörner, dem inzwischen emeritierten Leiter des Fachbereichs Paläogeophysik und Geodynamik an der Universität von Stockholm.
Sein Vortrag konzentrierte sich auf den vermuteten Anstieg des Meeresspiegels und den Unterschied zwischen dem tatsächlichen Anstieg und dem vom IPCC stammenden diesbezüglichen Modellergebnissen.
Von den Alarmisten wurden Mörners Arbeiten immer wieder in Zweifel gezogen, z.T. versucht lächerlich zu machen.
Die jüngsten Medien-Berichte zur Ausweitung der Fläche von Bangladesh und des Anstiiegs der Südseeinseln von Tuvalu und den Malediven (s.u) geben ihm jedoch mal wieder eindrucksvoll Recht.
-
Welt Online/Michael Miersch
2010-06-05 de Die Drohkulisse der Untergangspropheten ist wegAngeblich versinkende Südseeinseln sind ein starkes Kapitel in der großen Erzählung von einer herannahenden Klimakatastrophe.
Wie schwindende Eisbären und die schmelzende Gletscher weckt die Botschaft von den untergehenden Tropenparadiesen heftigere Gefühle als dürre Temperaturkurven.
Dass die Bestände der Eisbären sich erfreulich vermehren, haben Zoologen schon vor Jahren dokumentiert (obwohl Al Gore und seine Freunde weiterhin das Gegenteil behaupten).
Dass die Gletscher im Himalaja längst nicht so schnell schmelzen wie der Weltklimarat behauptet, bewiesen indische Wissenschaftler vergangenen Herbst.
Und jetzt versinkt auch noch das Insel-Szenario.
Forscher von den Fidschi-Inseln und aus Neuseeland veröffentlichten diese Woche einen Vergleich historischer und aktueller Luftaufnahmen von 27 Pazifik-Inseln.
Ergebnis: 23 davon sind seit den 50er-Jaren gleich groß geblieben oder gewachsen.
Sogar der Inselstaat Tuvalu, der immer wieder als dem Untergang geweiht dargestellt worden war, besitzt heute mehr Landfläche als damals.
Sieben seiner neun Atolle wurden größer.
Ähnlich gut sieht es für Malediven im indischen Ozean aus, deren Ministerpräsident vor dem Kopenhagener Klimagipfel medienwirksam unter Wasser posiert hatte.
Und auch die Küstenlinie von Bangladesch weitet sich aus, statt zu schrumpfen.
-
Spiegel Online
2010-06-03 de Überraschendes Forschungsergebnis: Pazifikinseln werden trotz Meeresspiegel-Anstieg größer
2001-12-22 de Die Südsee-Ente: Wie der Pazifikstaat Tuvalu unterging - beinahe
-
DiePresse
2007-06-02 de "Tuvalu versinkt nicht, definitiv nicht"
-
The Heritage Foundation
2010-05-21 en Sea Level Rises... What Sea Level Rises?Another one of the standout presentations at the Heartland Institute's fourth International Conference on Climate Change was the one by Nils-Axel Morner, former emeritus head of the paleogeophysics and geodynamics department at Stockholm University.
His talk focused on sea level increases and the difference between observed data and the Intergovernmental Panel on Climate Change (IPCC) model's predictions.
-
Watts Up With That? (Antony Watts)
2010-06-02 en Tuvalu and many other South Pacific Islands are not sinking, claims they are due to global warming driven sea level rise are opportunistic
-
Telegraph UK
2010-03-28 en Rise of sea levels is 'the greatest lie ever told'The uncompromising verdict of Dr Mörner is that all this talk about the sea rising is nothing but a colossal scare story
-
Environment
2010-06-02 en Shape-shifting islands defy sea-level rise
↑ en Oceangate: sea levels proven to have fallen for past six years
|
| de | en | fr |
|---|---|---|
|
Auswirkungen des Klimawandels Auswirkungen auf den Meeresspiegel |
Impacts of Climate Change Effects on Sea level |
Impacts du changement climatique Effets sur le niveau des océans |
⇧ 3 Gletscher / Glaciers
↑
a Gletscher wachsen
en Glaciers are growing
fr Des glaciers grandissent
- 1 Himalayan glaciers are growing, not shrinking
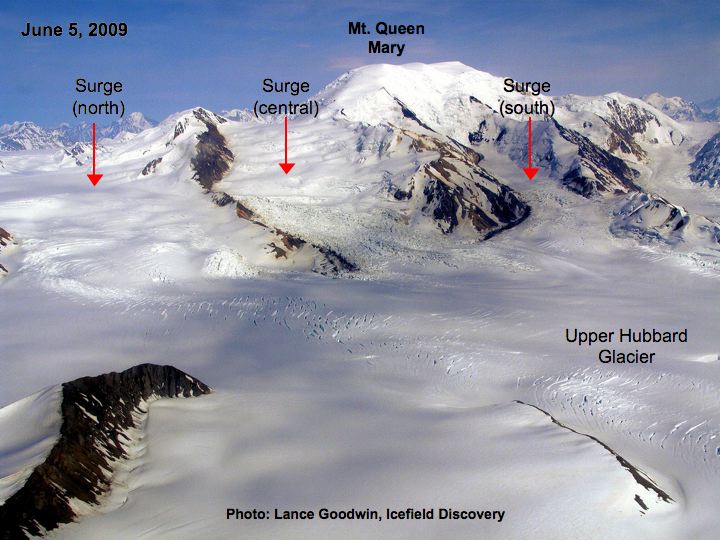
- 2 Alaska's Hubbard Glacier. Growing. A lot.
- 3 Norwegian glaciers. Growing again.
- 4 Glaciers growing on Canada's tallest mountain
- 5 North to Alaska and more growing glaciers
- 6 Glaciers are growing in California. California?
- 7 A glacier is growing on Washington's Mt. St. Helens.
- 8 Glaciers are growing in France and Switzerland, too
- 9 New Zealand's largest glaciers are growing
- 10 Russia's glaciers are growing, too
- 11 Argentina's Perito Moreno glacier is, you guessed it, growing
- 12 Iceland's Breidamerkurjokull glacier. Yup, it's growing, too.
- 13 Glaciers Growing In Northern Greenland
Funny how each time we read about another growing glacier, it's always "one of the only few" that are growing.
More than 90% of the worlds glaciers are growing, and still, each one is "one of the only few."
-
Ihatethemedia
2010-01-25 en 12 more glaciers that haven't heard the news about global warming
-
Not by Fire but by Ice
en Glaciers are growing around the world, including the United States
en Here's a (partial) list of the specific glaciers that are growing
-
The Conservative Papers
2010-02-15 en Glaciers Throughout the World Growing in Size
-
Die Weltwoche 09/10 / Von Hans Rentsch
2010-03-03 de Verzerrte Bilder
Schmelzende Gletscher rühren die Gemüter. Die Klima-Alarmisten bewirtschaften die Ängste und verdrängen wesentliche Fakten. Skepsis gegenüber der offiziellen Klimaforschung wird zur Bürgerpflicht.
|
|
Gebirgsgletscher / Glaciers / Glaciers | |||||
| ▷Die Kalte Sonne Blog‑Themen Vahrenholt/Lüning ▶Die kalte Sonne | de ▷Gebirgsgletscher | |||||
| Science Skeptical Blog | de Schnee und Eis | |||||
| ►Der Wasserplanet (Ernst-Georg Beck) | de ▷Pole, Gletscher, Meeresspiegel (Wayback ohne Bilder) | |||||
| NoTricksZone | en Glaciers | |||||
| Wikipedia |
de
Gletscher en Glacier fr Glacier |
|||||
| Vademecum |
▶Gletscher
▶Welt-Info |
|||||
| Siehe auch |
|
← 1. Himalayan glaciers are growing, not shrinking
|
Things are not as they seemed to be in the IPCC report. Not only are the Himalayan glaciers not shrinking, they're growing. |
↑ 2016
-
Die kalte Sonne (Fritz Vahrenholt & Sebastian Lüning)
2016-10-08 de Gletscher im Karakorum und Nordwest Himalaya seit den 1970er Jahren stabilNun hat ein Forscherteam um Tobias Bolch versucht, die Gletschergeschichte in der Region weiter zurück zu verfolgen.
Dazu untersuchten sie Gletscher im Hunza-Gebiet.
Gletscher im Hunza-Gebiet
Die Überraschung:
Seit den 1970er Jahren sind die Gletscher hier überaus stabil.
Hier die Kurzfassung der Studie, die am 9. September 2016 in The Cryosphere Discussions erschien:
Brief Communication:
Glaciers in the Hunza Catchment (Karakoram) are in balance since the 1970s.
Previous geodetic estimates of mass changes in the Karakoram revealed balanced budgets or a possible slight mass gain since the year ~?2000.
Indications for longer-term stability exist but no mass budget analyses are available before 2000.
Here, we show that glaciers in the Hunza River basin (Central Karakoram) were on average in balance since the 1970s based on analysis of stereo Hexagon KH-9, SRTM, ASTER and Cartosat-1 data.
Heterogeneous behaviour and frequent surge activities were also characteristic for the period before 2000.
Weiter gehts im Nordwest Himalaya, im Astore-Becken.
Dort haben die Gletscher im Zeitraum 1973-2013 ziemlich unterschiedlich auf den Klimawandel reagiert.
Laut Fahrhan et al. 2015 haben sich 28 Gletscher leicht vergrößert, 45 leicht verkleinert und die restlichen 25 waren eher stabil.
Insgesamt hat sich die Gesamtfläche der Gletscher kaum verändert.
Die Reduktion um 0,3% ist statistisch wenig signifikant, wenn man die Fehlerbreite der zur Verfügung stehenden Daten einbezieht.
Insgesamt blieben die Gletscher im Untersuchungsgebiet also ziemlich stabil.
Schließlich noch eine Studie von Hochreuther et al. 2015 in Palaeo3 zu Tibet.
Die Forscher konnten die Kleine Eiszeit in drei Vorstöße und dazwischenliegende Schmelzphasen unterteilen:
Ages of major Little Ice Age glacier fluctuations on the southeast Tibetan Plateau derived from tree-ring-based moraine dating
↑ 2013
-
Die kalte Sonne (Fritz Vahrenholt & Sebastian Lüning)
2013-09-04 de Überraschung im höchsten Gebirge der Erde: Karakoram-Gletscher wachsen seit Ende der 1980er Jahre
-
Die kalte Sonne (Fritz Vahrenholt & Sebastian Lüning)
2013-02-03 de Heftiger Schneefall der letzten drei Jahre lässt Himalaya-Gletscher anwachsen
Die Himalaya-Gletscher-Lüge von "Klimapapst" Schellnhuber am 30.10.2009
Auch Schellnhuber hatte im Vorfeld der Klimakonferenz von "Kopenhagen" über das Abschmelzen der "Himalaya"-Gletscher gelogen
...und zwar noch am 30.10.2009 in der ZDF-Sendung "Die lange Nacht des Klimas".
Im Januar 2010 wurde der Himalaya-Gletscher-Schwindel bekanntlich entlarvt.
↑ 2012
-
Die kalte Sonne (Fritz Vahrenholt & Sebastian Lüning)
2012-04-22 de Himalaya-Schmelzkatastrophe abgeblasen: Das Neueste aus der Welt der GletscherHimalaya-Gletscherschmelze neu bewertet
Ein internationales Forscherteam um Tobias Bolch von der Universität Zürich hat nun im Rahmen einer im Fachjournal Science veröffentlichten neuen Studie die Himalaya-Gletscherschmelze neu bewertet (siehe Berichte auf ORF, SF, scinexx, Hamburger Abendblatt, innovations-report).
Die Forscher fanden, dass die meisten der Himalaya-Gletscher zwar schrumpfen, dies aber deutlich weniger schnell als bisher in den alarmistischen Prognosen des Weltklimarats angenommen.
Überraschend: Die untersuchten Gletscher passen sich gut in das globale Mittel ein.
Die Karakorum-Gletscher
Dies wurde jetzt erneut für die Karakorum-Gletscher durch eine französische Wissenschaftlergruppe um Julie Gardelle von der Universität Grenoble bestätigt.
Die Gletscher-Massenbilanz in diesem Teil des Gebirgsmassivs war im Untersuchungszeitraum von 1999-2008 sogar leicht positiv.
Die Studie erschien jetzt in Nature Geoscience (siehe auch Berichte in der Welt, SZ, Spiegel Online und notrickszone.com).
Gletscher-Situation im argentinischen Patagonien
Auch die Gletscher-Situation im argentinischen Patagonien wird allmählich klarer.
Viele Gletscher schmelzen hier derzeit, jedoch wachsen auch einige an, wie etwa der Moreno-Gletscher.
Ein internationales Forscherteam um Sébastien Bertrand von der Woods Hole Oceanographic Institution fand nun, dass die Gletscher in Patagonien während der vergangenen 5000 Jahre in erster Linie auf Änderungen im Niederschlag reagierten und erst zweitrangig auf Temperaturschwankungen.
Die Studie erschien vor wenigen Monaten in der Fachzeitschrift Climate of the Past.
Allerdings gibt es gute Hinweise darauf, dass auch diese schneebringenden Feuchtigkeitsschwankungen im solar-gesteuerten Millenniumstakt schwanken
(siehe unseren kürzlichen Blog-Artikel "Sonnenaktivität steuerte den südamerikanischen Monsunregen während der letzten 1500 Jahre").
Die Alpen
Auch in den Alpen waren die Gletscher in den vergangenen 10.000 Jahren alles andere als stabil.
Während des sogenannten holozänen Klimaoptimums vor 6000 Jahren - als es wärmer war als heute - waren die Alpengletscher fast verschwunden.
Auch die durch Sonnenaktivitätsschwankungen bedingten Temperaturschwankungen im 1000-Jahres-Maßstab gingen nicht spurlos an den Alpengletschern vorüber.
Jedes Mal wenn es kälter wurde, wuchsen die Gletscher, und wenn es wieder wärmer wurde schrumpften sie.
Einen sehr guten Überblick über diese natürliche Eis-Dynamik in den Alpen gibt Gernot Patzelt von der Universität Innsbruck in seinen eindrucksvollen Vorträgen (Vortragsfolien und Artikel bei EIKE).
Bedenklich
Natürlich sind auch Heinz Wanner von der Universität Bern diese Fakten und Zusammenhänge bekannt. Wanner ist "Review Editor" des aktuell entstehenden 5. IPCC Berichts.
In einem kürzlichen Artikel in der Jungfrau Zeitung bestätigte er, dass sich die Alpengletscher vor 6000 Jahren deutlich weiter zurückgezogen hatten als heute.
Er erklärt dies korrekt mit einer Erdbahnparameter-Konstellation die von der heutigen abweicht, den sogenannten Milankovic-Zyklen.
Bedenklich ist jedoch, dass er im gleichen Artikel versäumt, auf die Temperaturschwankungen im 1000-Jahres-Maßstab einzugehen.
Den Lesern suggeriert dies, dass natürliche Schwankungen heute keine Rolle mehr spielen würden, was jedoch grob irreführend ist.
Natürlich kennt Wanner auch diese solar-angetriebenen Temperaturzyklen, die von Gerard Bond erstmals vor mehr als zehn Jahren eindrucksvoll dokumentiert wurden.
In einem anderen Beitrag war Wanner darauf bereits explizit eingegangen.
Es ist unklar, warum er dieses wichtige Thema nun wieder ausspart.
Hoffentlich ist nicht der Grund, die katastrophale Gebirgsgletscherschmelz-Vorhersage des Weltklimarats bis 2100 auf Basis der übertriebenen Erwärmungsszenarien des IPCC im neuen Klimabericht zu stützen...
| Heinz Wanner |
Schweizer Klimatologe
▶Heinz Wanner: Who is who (Aktivisten der anthropogenen Globalen Erwärmung) |
-
Die kalte Sonne (Fritz Vahrenholt & Sebastian Lüning)
2012-03-21 de Das Große Schmelzen: ZDF Info am 22.3.2012 (05:30-06:00)
-
Die kalte Sonne (Fritz Vahrenholt & Sebastian Lüning)
2012-02-09 de Überraschung: Himalaya-Gebirgsgletscher haben in den letzten 10 Jahren gar kein Eis verloren!Die neuen Ergebnisse sind auch deshalb pikant, da der Weltklimarat IPCC in seinem letzten Klima-Bericht von 2007 davor warnte, dass alle Himalaya-Gletscher bis zum Jahr 2035 abgeschmolzen sein würden.
↑ 2009
-
Discovery News
2009-05-05 en Himalayan Glaciers Seem to Be GrowingIn the Western Himalayas, a group of some 230 glaciers are bucking the global warming trend.
de Aus der Panik-Küche en From the panic laboratory fr De la marmite des alarmistes
-
2009-11-01 en
 Himalayan Glaciers Melting 100's of Million People Dependent on
River Ganges
Glaciers of the Himalayan Mountains are melting faster than anywhere else.
Parts of surrounding ecology are not growing, and the River Ganges which flows from the Himalayan snow and ice currently provides water for hundreds of millions of people.
-
THE TIMES OF INDIA
2009-11-01 en Beijing gets first snow after meteorologists seed cloudss
BEIJING: Beijingers woke up Sunday morning to a city turned white with snow that came far ahead of the winter.
It was only in the later part of the day that one learnt that 186 doses of silver iodide went into persuading the clouds to release snow flakes.
← 2. Alaska's Hubbard Glacier. Growing. A lot.
|
Alaska's Hubbard Glacier is advancing moving toward Gilbert Point near Yakutat at an average of seven feet per day.
|
-
Glacier Research
2009-05-05 en Recent Updates
The terminus of Hubbard glacier was significantly advanced this year in comparison to the last three years of measurement and to date continues to show continued activity but slightly back from it's seasonal maximum.
-
Watts Up With That? (Antony Watts)
2015-06-22 en The Hubbard Glacier defies 'climate change' - continues to growHubbard Glacier could permanently dam the entrance to Russell Fiord in as little as 10 years
From NOAA Earth Observatory:
Since measurements began in 1895, Alaska's Hubbard Glacier has been thickening and steadily advancing into Disenchantment Bay.
The advance runs counter to so many thinning and retreating glaciers nearby in Alaska and around the world.
According to Leigh Stearns, a glaciologist at the University of Kansas, Hubbard's advance is due to its large accumulation area; the glacier's catchment basin extends far into the Saint Elias Mountains.
Snow that falls in the basin either melts or flows down to the terminus, causing Hubbard to steadily grow.
In addition, Hubbard is building up a large moraine, shoveling sediment, rock, and other debris from Earth's surface onto the glacier's leading edge.
The moraine at the front gives the glacier stability and allows it to advance more easily because the ice does not need to be as thick to stay grounded. (If it is thin, it can start floating and will not necessarily advance.)
Twice in the past hundred years - in 1986 and again in 2002 - the moraine has made contact with Gilbert Point and blocked the entrance to Russell Fjord. With nowhere to drain, runoff caused the water level in the fjord to rise rapidly.
-
Real Science
2015-09-18 en 75% Of Alaska Stations Have Cooled Since 1977
← 3. Norwegian glaciers. Growing again.
|
After years of decline, glaciers in Norway are again growing. |
-
Not by Fire but by Ice
2008-11-27 en Glaciers in Norway Growing Again
The actual magnitude of the growth, which appears to have begun over the last two years, has not yet been quantified.
The flow rate of many glaciers has also declined. Glacier flow ultimately acts to reduce accumulation, as the ice moves to lower, warmer elevations.
-
DailyTech
2008-11-27 en Glaciers in Norway Growing AgainAfter years of decline, glaciers in Norway are again growing, reports the Norwegian Water Resources and Energy Directorate (NVE).
The flow rate of many glaciers has also declined. Glacier flow ultimately acts to reduce accumulation, as the ice moves to lower, warmer elevations.
The original trend had been fairly rapid decline since the year 2000.
Despite the recent growth, most glaciers in the nation are still smaller than they were in 1982. However, Elvehøy says that the glaciers were even smaller during the 'Medieval Warm Period' of the Viking Era, prior to around the year 1350.
Not all Norwegian glaciers appear to be affected, most notably those in the Jotenheimen region of Southern Norway.
← 4. Glaciers growing on Canada's tallest mountain
|
Canada's tallest mountain, the Yukon's towering Mount Logan, may have experienced a growth spurt. |
-
canada.com
2008-11-17 en Canada's highest peak growing, researcher finds
Canada's highest point -- the ice-covered peak of Yukon's soaring Mount Logan -- may be due for an official re-measurement after an American researcher on a neighbourly flyby took readings that suggest this country's superlative summit has experienced a growth spurt.
← 5. North to Alaska and more growing glaciers
|
Alaska's glaciers have been in retreat for nearly 200 years. |
-
MichNews.com
2008-10-28 en Alaska's Glaciers Are GrowingAlaska's glaciers grew this year, after shrinking for most of the last 200 years.
The reason? Global temperatures dropped over the past 18 months.The global mean annual temperature has been declining recently because the solar wind thrown out by the sun has retreated to its smallest extent in at least 50 years. This temperature downturn was not predicted by the global computer models, but had been predicted by the sunspot index since 2000.
The solar wind normally protects the earth from 90 percent of the high-energy cosmic rays that flash constantly through the universe.
Henrik Svensmark at the Danish Space Research Institute has demonstrated that when more cosmic rays hit the earth, they create more of the low, wet clouds that deflect heat back into outer space. Thus the earth's recent cooling.
Unusually large amounts of Alaskan snow last winter were followed by unusually chilly temperatures there this summer.
"In general, the weather this summer was the worst I have seen in at least 20 years," says Bruce Molnia of the U.S. Geological Survey, and author of The Glaciers of Alaska.
"It's been a long time on most glaciers where they've actually had positive mass balance (added thickness)."
Overall, Molnia figures Alaska had lost 10-12,000 square kilometers of ice since 1800, the depths of the Little Ice Age.
That's enough ice to cover the state of Connecticut.
Climate alarmists claim all the glaciers might disappear soon, but they haven't looked at the long-term evidence of the 1,500-year Dansgaard-Oeschger climate cycles. During the Little Ice Age-1400 to 1850-Muir Glacier filled the whole of Glacier Bay.
Since then, the glacier has retreated 57 miles.
But the Little Ice Age was preceded by the Medieval Warming, the cold Dark Ages, a Roman Warming, and a whole series of moderate warmings and coolings that extend back at least 1 million years based on the evidence of the microfossils in the world's seabed sediments.
The sunspots are now predicting a 30-year cooling of the earth. That would thicken the Alaskan glaciers somewhat, but probably wouldn't refill Glacier Bay with ice. That'll have to wait for the next icy age.
The sunspot index has a 59 percent correlation with our temperatures (with a roughly ten-year lag). CO2 has only an "accidental" 22 percent correlation with our temperatures, which should be grounds for dismissing CO2 as a major climate player.
All this is radically different from the 5-degree C warming predicted by the computer models.
However, the scientific rule says: if actual observations tell you something that's the opposite of your theory, change your theory.
-
DailyTech
2008-10-16 en Alaskan Glaciers Grow for First Time in 250 yearsA bitterly cold Alaskan summer has had surprising results. For the first time in the area's recorded history, area glaciers have begun to expand, rather than shrink.
Summer temperatures, which were some 3 degrees below average, allowed record levels of winter snow to remain much longer, leading to the increase in glacial mass.
"In mid-June, I was surprised to see snow still at sea level in Prince William Sound", said glaciologist Bruce Molnia. "In general, the weather this summer was the worst I have seen in at least 20 years".
"On the Juneau Icefield, there was still 20 feet of new snow on the surface [in] late July. At Bering Glacier, a landslide I am studying [did] not become snow free until early August."
Molnia, who works for the US Geological Survey, said it's been a "long time" since area glaciers have seen a positive mass balance - an increase in the total amount of ice they contain.
Since 1946, the USGS has maintained a research project measuring the state of Alaskan glaciers. This year saw records broken for most snow buildup. It was also the first time since any records began being that the glaciers did not shrink during the summer months.
Those records date from the mid 1700s, when the region was first visited by Russian explorers. Molnia estimates that Alaskan glaciers have lost about 15% of their total area since that time -- an area the size of Connecticut.
One of the largest areas of shrinkage has been at the national park of Glacier Bay. When Alexei Ilich Chirikof first arrived in 1741, the bay didn't exist at all - only a solid wall of ice. From that time until the early 1900s, the ice retreated some 50 miles, to form the bay and surrounding area.
Accordingly to Molnia, a difference of just 3 or 4 degrees is enough to shift the mass balance of glaciers from rapid shrinkage to rapid growth. From the 1600s to the 1900s, that's just the amount of warming that was seen, as the planet exited the Little Ice Age.
Molnia says one cold summer doesn't mean the start of a new climatic trend. At least years like this, however, might mark the beginning of another Little Ice Age.
← 6. Glaciers are growing in California. California?
|
You might be surprised to learn that the Golden State has glaciers. |
-
Fox News
2008-07-09 en Mysterious California Glaciers Keep Growing Despite Warming
Global warming is shrinking glaciers all over the world, but the seven tongues of ice creeping down Mount Shasta's flanks are a rare exception: They are the only known glaciers in the continental U.S. that are growing.
← 7. A glacier is growing on Washington's Mt. St. Helens.
|
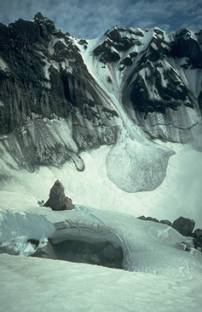
Mount Saint Helens has glaciers? But it's an active volcano. |
|
In the winter and early spring, snow tumbles down avalanche chutes on the crater walls. Notes cave entrance in front of picture. |
-
Glacier Caves (Charlie Anderson Jr.)
2000-12-15 en The beginning of a New Glacier Forming in the Crater of Mount St. Helens.
Snow Accumulation in the Crater of Mount St. Helens.On Mount St. Helens, we have had a unique opportunity to study the interaction of geothermal energy with the accumulation of alpine snowpack from its inception after a major eruption.
We began investigative work in the crater in 1981 (Anderson and others,2000).
Yearly surveys began in 1982 with mapping, description, and photography of cave passages, snow, firn, and ice. This investigation involved reconnaissance mapping and sampling from 1981 through 2000 by members of the International Glaciospeleological Survey (IGS) with the permission of the U.S. Forest Service and Mount St. Helens National Volcanic Monument.
Over the last 20 years snow, ice and rock debris have average in excess of 325 feet thick have and in places there are 450 to 600 feet deep, that have accumulated behind the lava dome.
A new glacier is now forming in the crater of Mount St. Helens.
A permanent body of ice has accumulated in the crater. IGS Crater Team Scientists FIND THE START OF A NEW GLACIER crater Leader Charles H. Anderson Jr. in 1999.
-
KATU COM
2008-05-14 en Against odds, glacier grows in cauldron of Mt. St. Helens"On May 18, 1980, the once bucolic ice-cream cone shape that defined Mount St. Helens in Washington state disappeared in monstrous blast of ash, rock, gas, and heat.
"Inside the volcano, which was once a soft dome of snow but is now a gaping, steaming menace with an unpredictable streak, an unexpected phenomenon is taking place: a glacier is growing.
"In these days of global warming concerns and scientists showing alarming then-and-now images of glaciers disappearing from mountainsides, it may be the only growing glacier in America - or maybe the world.
← 8. Glaciers are growing in France and Switzerland, too
|
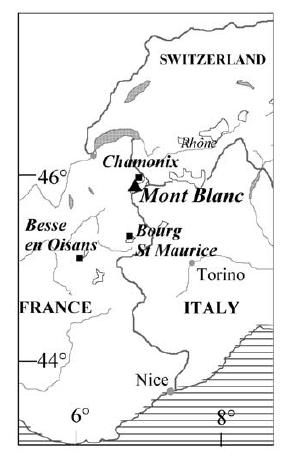
Another continent has reported in. According to an article in the Journal of Geophysical Research, glaciers are growing in France and Switzerland, to |
-
World Climate Report
2007-06-26 en Mont Blanc Glaciers Refuse to Shrink? -
If you have an interest in global warming and its effect on mountain glaciers, you will be thrilled to know that there are over one million websites on the subject.
Even before you get to the first site, you already know what you will find.
Burning fossil fuels increases atmospheric concentrations of greenhouse gases, the Earth is warming, mountain glaciers are in full retreat all over the planet, delicate ecosystems are in peril, and humans who rely on the freshwater from mountain glaciers better get creative fast.
Recall that in the Gore film, a great deal of attention was paid to the diminishing "snows of Kilimanjaro" - Gore has made hay in Glacier National Park as well pointing to shrinking glaciers.
Retreating mountain glaciers have become a poster-child of the global warming alarmists - no presentation on the subject is complete without one.
-
The Intergovernmental Panel on Climate Change (IPCC) says in their recent 2007 Summary for Policymakers "Mountain glaciers and snow cover have declined on average in both hemispheres.
Widespread decreases in glaciers and ice caps have contributed to sea level rise."
Someone in Europe missed the memo on this subject as a recent article has appeared in the Journal of Geophysical Research entitled "Very high-elevation Mont Blanc glaciated areas not affected by the 20th century climate change."
To say the least, we at World Climate Report were interested in what the authors had to say.
-
The research was conducted by six scientists from leading agencies and departments in France and Switzerland that deal with hydrology and glaciology.
Before you see the title of the article and immediately suspect some conspiracy funded by European coal companies, be aware that the research was funded by Observatoire des Sciences de l'Univers de Grenoble (OSUG), the European Programs ALPCLIM and CARBOSOL, and by the city of Chamonix Mont-Blanc.
Given the title of the article, we wonder if the six scientists will ever be funded again by any European agencies.
Mont Blanc is located on the border of Switzerland and France, and the summit of Mont Blanc is clearly visible from the United Nations complex in Geneva - the home of countless meetings of the IPCC and other international agencies addressing the climate change issue.
How ironic - based on the title of the article, we doubt the research will be prominently featured in any upcoming IPCC meeting in Geneva?
Vincent et al. state "The most striking features of these figures are the small thickness changes observed over the 20th century.
For both areas, thickness variations do not exceed ±15 m. The average changes are +2.6 m at Dôme du Goûter (please note that this glacier is growing) and -0.3 m (-12 inches) at Mont Blanc.
-
Considering the uncertainty interval, i.e., ±5 m, it can be concluded that no significant thickness change is detectable over most of these areas.
All these results suggest that the SMB at Dôme du Goûter and Mont Blanc did not experience any significant changes over the 20th century.
-
Not by Fire but by Ice
2007-10-15 en Mont Blanc glacier almost doubles in size in four years"The volume of ice on Mont Blanc's slopes over 4800 metres high was first calculated at 14,600 cubic metres in 2003.
It dropped to 14,300 cubic metres two years later, but then almost doubled to 24,100 cubic metres in 2007.
← 9. New Zealand's largest glaciers are growing
|
Growing may not be a strong enough word. They're surging. |
-
Not by Fire but by Ice
2007-01-31 en Fox, Franz Josef glaciers defy trend New Zealand's two best-known glaciers still on the march
Guides say the Franz Josef and the Fox glaciers continued advancing down their valleys in the past year and may soon be close to positions reached 40 years ago.
← 10. Russia's glaciers are growing, too
|
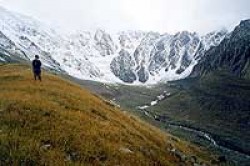
The Russians don't believe the IPCC forecasts, but they do believe their own eyes. |
-
Not by Fire but by Ice
2002-09-20 en Glaciers are growing around the world, including the United StatesRussian glaciers surging - On September 20, 2002, a huge 22-million ton piece of the gigantic Maili Glacier broke loose and crashed down a steep gorge into the village of Kami killing more than 150 people and injuring hundreds more.
The 500-foot wall of ice had been growing for six years.
The Maili Glacier is just one of several glaciers in the North Caucasus Mountains that have been EXPANDING at an alarming rate.
Other towns in the region have been partially buried by these advancing walls of ice.
One local scientist in southern Russia said, "we may be seeing the beginning of a new great ice age!!!"
-
Earth Observatory
2005-04-24 en On September 20, 2002, the Kolka Glacier in the Caucasus Mountains collapsed under the slopes of Mt. Dzhimarai-khokh.
← 11. Argentina's Perito Moreno glacier is, you guessed it, growing
|
Is there a continent where glaciers aren't growing? If so, South America isn't one of them. Consider Argentina's Perito Moreno glacier. |
-
Not by Fire but by Ice
2009-06-15 en Largest glacier in Argentina advancing"Nourished by Andean snowmelt, the glacier constantly grows even as it spawns icebergs the size of apartment buildings into a frigid lake, maintaining a nearly perfect equilibrium since measurements began more than a century ago."
Perito Moreno, a vast, 19-mile-long (30km) and 3-mile-wide (5 km) river of ice, is the largest glacier in Patagonia.
-
msnbc.com
2009-06-15 en Argentine glacier advances despite warmingArgentina's Perito Moreno glacier is one of only a few ice fields worldwide that have withstood rising global temperatures.
Nourished by Andean snowmelt, the glacier constantly grows even as it spawns icebergs the size of apartment buildings into a frigid lake, maintaining a nearly perfect equilibrium since measurements began more than a century ago.
"We're not sure why this happens," said Andres Rivera, a glacialist with the Center for Scientific Studies in Valdivia, Chile. "But not all glaciers respond equally to climate change."
-
Gilbert Ashoff
2007-0-22 en Gore's glacial lieAn interesting footnote and one of the major lies in the movie "An Inconvenient Truth" is that Mr. Gore and Co. show the Perito Moreno Glacier in So. Argentina as an example of the result of global warming.
In fact my wife Marjorie and I have visited this glacier 3 times. First in 1973 and again in 2004 and 2006.
It is growing. It is visibly larger and pushing further across Lago Argentina.
They used this in the movie twice all the while misrepresenting its growth and in fact stating it is shrinking showing a huge chunk falling off as it does every 30 minutes or so. It is a dramatic glacier that yields tremendous photo ops to just about anyone who visits it, which I must presume is why it was used.
-
Google Images Search
2007-0-22 en perito moreno
← 12. Iceland's Breidamerkurjokull glacier. Yup, it's growing, too.
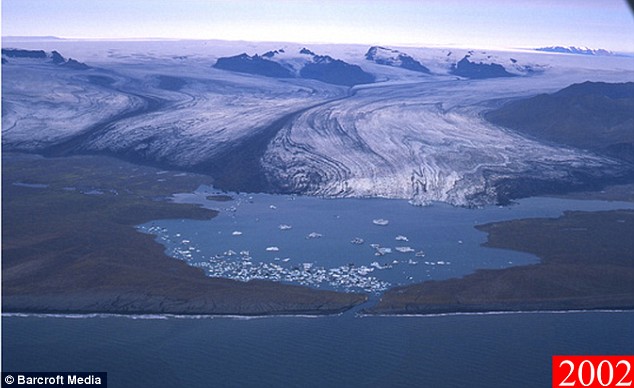
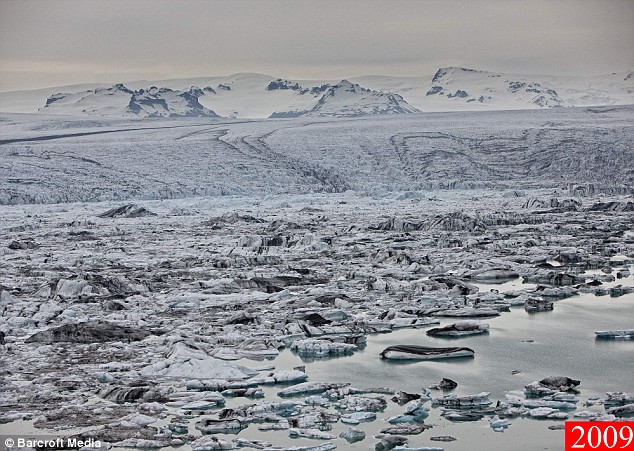
The Daily Mail UK ran a story on July 31, 2009 about the horrors of global warming. It was accompanied, for some inexplicable reason, by contradictory photos that showed the remarkable growth of Iceland's Breidamerkurjokull glacier.
Their headline screamed, "How global warming is changing the face of the northern hemisphere."
The photos and caption told a story that was, you'll pardon the expression, the polar opposite of what the article described.
|
Chilling reminder: An aerial view shows huge ice towers and crevasses on the glacier. "The drastic alterations have been blamed on greenhouses gases." |
-
Mail Online
2009-07-31 en In pictures: How global warming is changing the face of the northern hemisphereSlowly but surely the Breidamerkurjokull glacier is melting away.
This 60 mile long expanse of ice has edged from the mountains into a lagoon and over the past 30 years has shown no sign of moving back.
Over this time professional photographer Ragnar Sigurdsson has been documenting the alarming phenomenon that has been taking place.
In the past, the beautiful lagoon remained unfrozen even in winter except for the occasional drifting iceberg. But now, as these aerial images show, it appears like a solid mass even in the summer.
'It is perfectly natural for a glacier to move. They tend to recede or advance in cycles but this time the tongue of the Breidamerkurjokull has come all the way down into the lagoon.'
The disturbing changes pose little threat to structures or human life, with the nearest town over 60 miles away. But the rapid influx of ice is seen as a chilling reminder that greenhouses gases are altering the planet.
Ragnar, 51, from Reykjavik, said: 'There is no threat of a disaster. The rate that the water rises, it would take more than 50 years for it to take the bridge but people in the area still feel it's global warming that's doing it.
'The end result is this extra freshwater is pouring into the sea at an alarming rate.'
Despite the beautiful appearance of the contrast in water types, the pictures will worry environmentalists across the world.
← 13. Glaciers Growing In Northern Greenland
-
Real Science
2015-09-18 en Glaciers Growing In Northern Greenland
| de | en | fr |
|---|---|---|
|
Auswirkungen des Klimas Gletscher |
Impacts of Climate Change Glaciers |
Impacts du changement climatique Glaciers |
⇧ 4 Arktis / Arctic / Arctique
- a de
2010/2011: Das arktische Meereis hat zugenommen
en 2010/2011: Arctic Ice Volume Has Increased - b de Wird es in Grönland wärmer? Nein - kälter!
- c de
Subtropische Meeresströmungen lässt Grönlands Gletscher
schmelzen
en Greenland glaciers - melt due to sea current change, not air temperature - d en Is it possible that the IPCC is trying to rewrite the history books?
↑
a 2010/2011: Das arktische Meereis hat zugenommen
en 2010/2011: Arctic Ice Volume Has Increased
-
Klimaskeptiker Info
2011-11-06 de Fläche des mindestens drei Meter dicken Eises hat sich gegenüber dem letzten Jahr verdoppeltNach daten der US Navy hat sie die Fläche des mindestens 3 Meter dicken Eises im arktischen Ozean seit dem letzten Herbst verdoppelt.
Dies stimmt auch mit Graphiken des NSIDC überein, die eine Flächenzunahme des dicken mehrjährigen Eises zeigen.
-
Real Science (Steven Goddard)
2011-11-06 en Three Metre Thick Ice Area Has Doubled Since Last Year
According to the US Navy, the area of 3+ metre thick ice has doubled since last autumn.
This agrees with NSIDC graphs which show an increase in the area of thick multi-year ice.
↑
2010-12: Dickes arktisches Meereis bedeckt jetzt eine Fläche, die doppelt
so groß ist wie vor zwei Jahren
en 2010-12: Area Of Thick Arctic Ice Has Doubled
In The Last Two Years
-
Klimaskeptiker Info
2011-01-01 de Dickes arktisches Meereis bedeckt jetzt eine Fläche, die doppelt so groß ist wie vor zwei JahrenNach den PIPS-Daten der US-Navy hat sich die Fläche in der Arktis, die von Eis mit einer Dicke von 2,50 Metern oder mehr bedeckt ist, im Vergleich zum Zustand vor zwei Jahren verdoppelt.
-
Real Science (Steven Goddard)
2010-12-31 en Area Of Thick Arctic Ice Has Doubled In The Last Two Years
US Navy PIPS data shows that the area of ice greater than 2.5 metres thick - has doubled since the same date in 2008.
↑
2010-05: Das arktische Meereis hat in zwei Jahren um 24% zugenommen
en 2010-05: Arctic Ice Volume Has Increased 25% Since May, 2008
-
Klimaskeptiker Info
2010-05-29 de Das arktische Meereis hat in zwei Jahren um 25% zugenommenIm Gegensatz zu anderslautenden Behauptungen vieler Alarmisten hat das arktische Meereis in den letzten zwei Jahren deutlich zugenommen.
-
Watts Up With That? (Antony Watts)
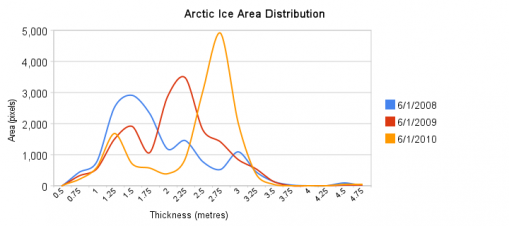
2010-05-29 en Arctic Ice Volume Has Increased 25% Since May, 2008Comments of the author Steven Goddard:
I should mention that I measured this just inside the Arctic Basin - excluding the Greenland Sea, Baffin Bay, Hudson Bay and anywhere south of 70N.
When the entire Arctic is included, the increase in volume is close to 40% since 2008.
So the numbers presented here are quite conservative
|
The blue line represents 2008, and the most abundant ice that year was less than 1.5 metres thick.
That thin ice was famously described by NSIDC as "rotten ice." In 2009 (red)
the most common ice had increased to more than 2.0 metres, and by 2010 (orange) the most common ice had increased to in excess of 2.75 metres thick.
↑
Untersuchung des arktischen Eises widerlegt Schmelz-Szenarien
en Scan of Arctic ice dispels melting gloom: Researcher
-
Klimaskeptiker Info
2010-06-16 de Untersuchung des arktischen Eises widerlegt Schmelz-SzenarienEine eingehende Untersuchung der Eisdicke in der Arktis, die unter der Leitung von Christian Haas von der Univeristät von Alberta durchgeführt wurde, hat unerwartet dickes Eis gefunden - und keine Spur von einem schnellen Verschwinden des Meereises.
-
Watts Up With That? (Antony Watts)
2010-06-16 en Scan of Arctic ice dispels melting gloom: ResearcherAn electromagnetic "bird" dispatched to the Arctic for the most detailed look yet at the thickness of the ice has turned up a reassuring picture.
The meltdown has not been as dire as some would suggest, said geophysicist Christian Haas of the University of Alberta. His international team flew across the top of the planet last year for the 2,412-kilometre survey.
They found large expanses of ice four to five metres thick, despite the record retreat in 2007.
↑ b Wird es in Grönland wärmer? Nein - kälter!
- de
Grönlandtemperaturen
en Greenland Temperatures - de Wird es in Grönland wärmer ? Nein - kälter !
- de
Eine 4000-jährige Geschichte über Grönlands Oberflächentemperatur
en A 4000-Year History of Greenland Surface Temperature
↑
Grönlandtemperaturen
en Greenland Temperatures
![]()
![]() Temperature variations from the Greenland Glacier Ice Core
Temperature variations from the Greenland Glacier Ice Core
![]() Image from Internet Archive's Wayback Machine
Image from Internet Archive's Wayback Machine

-
Watts Up With That? (Antony Watts)
2009-03-01 en Limitations on Anthropogenic Global Warming
![]()
![]() Central Greenland surface temperature for the last millennium
Central Greenland surface temperature for the last millennium

-
CO2 Science
2010-09-01 en Greenland Temperatures of the Past Millennium Based on Nitrogen and Argon Isotopic Ratios
↑ Wird es in Grönland wärmer ? Nein - kälter !
|
-
Die Weltwoche / Hans Rentsch
2010-03-03 de Verzerrte BilderGrönland 0,4 Prozent Eisverlust - pro Jahrhundert
Aus «Climate of Extremes» stammen auch die folgenden Informationen.
In der Fernsehsendung «Larry King Live» mit Al Gore als Gast im Jahr 2007 wollte eine Frau wissen, wie sich der Klimawandel auf die Sicherheit der USA in den kommenden zehn Jahren auswirken würde.
Die Horrorgeschichte, die Gore der armen Frau auftischte, klang so:
«Wenn Grönland auseinanderbräche oder die Westantarktis oder die Hälfte von einem der beiden oder von beiden, hätten wir einen
Anstieg des Meeresspiegels von über sechs Metern,
und das würde zu mehr als 450 Millionen Klimaflüchtlingen führen.»
Was sagt die Klimaforschung zum «Auseinanderbrechen von Grönland»?
Der Vierte Sachstandsbericht des IPCC enthält eine Schätzung aus einem Computermodell, das eine im Vergleich zu heute fast dreimal höhere CO2-Pt-Konzentration annimmt.
Die Schätzung ergibt, dass es unter den genannten extremen Bedingungen für einen Eisverlust von fünfzig Prozent fast tausend Jahre brauchte.
Was sagen Satellitenbeobachtungen, die effektive Veränderungen messen?
Im Wissenschaftsjournal Science lieferten der Nasa-Forscher Scott Luthcke und seine Co-Autoren im Jahr 2006 Zahlen.
Satelliten massen für Grönland einen Eisverlust von 100 km3 pro Jahr.
Die gesamte Eismasse Grönlands beträgt 2,85 Millionen km3.
Das ergibt eine Verlustrate von 0,4 Prozent - nicht pro Jahr, sondern pro Jahrhundert.
Auch Grönland eignet sich nicht als Ikone des Klimawandels.
↑
Eine 4000-jährige Geschichte über Grönlands Oberflächentemperatur
en A 4000-Year History of Greenland Surface Temperature
-
Science Skeptical / Michael Krueger
2012-02-15 de Eine 4000-jährige Geschichte über Grönlands OberflächentemperaturVor kurzem ist in den Geophysical Research Letters, einem Fachjournal, welches von der American Geophysical Union (AGU) herausgegeben wird, ein Artikel über die Temperaturgeschichte Grönlands erschienen, welcher die aktuelle Klimaerwärmung, in Relation zu den vergangenen 4000 Jahren, in ein neues Licht setzt.
Eine Gruppe von acht Polar- und Klimaforschern aus Japan, den USA, Frankreich und Dänemark hat sich zusammengetan und anhand eines neuen Verfahrens die Temperaturgeschichte Zentral-Grönlands der letzten 4000 Jahre rekonstruiert. Argon- und Stickstoff-Isotopenverhältnisse von eingeschlossenen Luftblasen im Eisbohrkern GISP2 aus Zentral-Grönland wurden dabei untersucht, um die Schneeoberflächentemperatur der letzten 4000 Jahre zu rekonstruieren.
Die Rekonstruktion (untererer Teil der Abbildung) startet mit einer kälteren Periode in der Bronzezeit, gefolgt von einer wärmeren Periode, dem Klimaoptimum der Bronzezeit.
Eine 1000jährige Abkühlung folgt während der Eisenzeit.
Über die nächsten 1300 Jahre hinweg folgen weitere Warm- und Kaltzeiten, wie das Klimaoptimum der Eisen/Römerzeit, dass Klimapessimum der "dunklen" Völkerwanderungszeit und das Klimaoptimum des Mittelalters (im 11. bis 12.Jahrhundert).
Es schließt sich die kälteste Zeit der letzten 4000 Jahre an, die sogenannte "Kleine Eiszeit" (im 17. bis 18. Jahrhundert), welche dann in die aktuelle Klimaerwärmung übergeht.
Der mittlere und obere Teil der Abbildung zeigen, dass es während des Klimaoptimums des Mittelalters (1140er Jahre) und in der Zeit zwischen 1930-1950 genauso warm war, wie im letzten Jahrzehnt.
Weiter zurückliegend, in den ersten 3000 Jahren der Rekonstruktion, zeigen sich sogar deutlich wärmere Zeiten, als heute.
Dort sind 72 Jahrzehnte zu finden die wärmer waren (um 1-1,5°C), als das heutige.
In diesen Zusammenhang eingeordnet ist die heutige Warmzeit also nichts Außergewöhnliches.
-
CO2 Science
2012-02-15 de A 4000-Year History of Greenland Surface TemperatureBackground
The authors write that, supposedly, "Greenland recently incurred record high temperatures and ice loss by melting, adding to concerns that anthropogenic warming is impacting the Greenland ice sheet and in turn accelerating global sea-level rise."
However, they state that "it remains imprecisely known for Greenland how much warming is caused by increasing atmospheric greenhouse gases versus natural variability."
What was done
In rigorously exploring this question of recent warmth attribution, Kobashi et al. reconstructed "Greenland surface snow temperature variability over the past 4000 years at the GISP2 site (near the Summit of the Greenland ice sheet; hereafter referred to as Greenland temperature) with a new method that utilizes argon and nitrogen isotopic ratios from occluded air bubbles," as described in detail by Kobashi et al. (2008a,b).
What was learned
The eight researchers report that "the temperature record starts with a colder period in 'the Bronze Age Cold Epoch'," which they say was followed by "a warm period in 'the Bronze Age Optimum'," which was followed by a 1000-year cooling that began "during 'the Iron/Roman Age Optimum'," which was followed by "the Dark Ages," which was followed by "the Medieval Warm Period," which was followed by "the Little Ice Age" - which they describe as "the coldest period of the past 4000 years" - which was followed, last of all, by "the recent warming."
For comparative purposes, they also note that "the current decadal average surface temperature at the summit is as warm as in the 1930s-1940s, and there was another similarly warm period in the 1140s (Medieval Warm Period)," indicating that "the present decade is not outside the envelope of variability of the last 1000 years."
In fact, they say that "excluding the last millennium," there were fully "72 decades warmer than the present one, in which mean temperatures were 1.0 to 1.5°C warmer," and that during two centennial intervals, average temperatures "were nearly 1.0°C warmer than the present decade"
What it means
Since the Greenland summit's decadal warmth of the first ten years of the 21st century was exceeded fully six dozen times over the prior four millennia, it is clear that it was in no way unusual, unnatural or unprecedented; and, therefore, it is clear that none of Greenland's recent warming need have been caused by increasing greenhouse gases.
Indeed, it is far more likely that its recent warmth is nothing more than the next expected phase of the natural oscillation of climate that has produced several-hundred-year periods of alternating warmth and cold over the past four thousand years.
See Climate Oscillations (Millennia Variability) in our Subject Index for more on this important topic.
| de | en | fr |
|---|---|---|
|
Auswirkungen des Klimas Arktis (Nordpol) |
Effects of Climate Change Arctic (North Pole) |
Conséquences climatiques Arctique (Pôle Nord) |
| Temperaturen in der Arktis | Arctic Temperatures | Températures dans l'arctique |
| Meereis in der Arktis | Arctic Sea Ice | Banquise arctique |
↑
c 4.3 Subtropische Meeresströmungen lässt Grönlands
Gletscher schmelzen
en Greenland glaciers - melt due to sea
current change, not air temperature
fr Courants subtropiques font fondre les glaciers
au Groenland
|
|
|
|
|
| de | en | fr |
|---|---|---|
|
Auswirkungen des Klimas Arktis (Nordpol) |
Effects of Climate Change Arctic (North Pole) |
Conséquences climatiques Arctique (Pôle Nord) |
| Temperaturen in der Arktis | Arctic Temperatures | Températures dans l'arctique |
| Meereis in der Arktis | Arctic Sea Ice | Banquise arctique |
↑ d 4.4 en Is it possible that the IPCC is trying to rewrite the history books?
-
Watts Up With That? (Antoy Watts)
2010-06-28 en Sea Ice News #11Is it possible that the IPCC is trying to rewrite the history books?
The New York Times 1969
-
Published: February 20, 1969
Copyright © The New York Times en The New York Time 1969-02-19: Expert Says Arctic Ocean Will Soon Be an Open Sea
From The New York Times, 1969
From the 9th century to the 13th century almost no ice was reported there. This was the period of Norse colonization of' Iceland and Greenland.Then, conditions worsened and the Norse colonies declined.
After the Little Ice Age of 1650 to 1840 the ice began to vanish near Iceland and had almost disappeared when the trend reversed, disastrously crippling Icelandic fisheries last year.
de Aus der Panik-Küche en From the panic laboratory fr De la marmite des alarmistes
The New York Times 2000
Dr. James J. McCarthy, IPCC
-
The New York Times
2008-08-19 en Ages-Old Icecap at North Pole Is Now Liquid, Scientists FindThe North Pole is melting.
The thick ice that has for ages covered the Arctic Ocean at the pole has turned to water, recent visitors there reported yesterday. At least for the time being, an ice-free patch of ocean about a mile wide has opened at the very top of the world, something that has presumably never before been seen by humans and is more evidence that global warming may be real and already affecting climate.
The last time scientists can be certain the pole was awash in water was more than 50 million years ago.
'It was totally unexpected,' said Dr. James J. McCarthy, an oceanographer, director of the Museum of Comparative Zoology at Harvard University and the co-leader of a group working for the Intergovernmental Panel on Climate Change, which is sponsored by the United Nations.
The panel is studying the potential environmental and economic consequences of marked climate change.
⇧ 5 Antarktis / Antarctic / Antrctique
- a de
Ein weiterer Fehler des IPCC: Antarktis Eis um 50 % unterschätzt
en Another IPCC Error: Antarctic Sea Ice Increase Underestimated by 50%
fr Une autre erreur du GIEC: La glace de l'antarctique a été sous-estimée de 50% - b de
Weitere Falschdarstellung im IPCC-Bericht:
Ausdehnung des Meereises rund um die Antarktis
en Yet Another Incorrect IPCC Assessment: Antarctic Sea Ice Increase - c de
Temperaturtrend auf antarktischer Halbinsel nicht nachvollziehbar
en Antarctic Agreements and Disagreements - d de
Eis in der Ostantarktis wird von unten her dicker
en East Antarctic Ice Sheet getting thicker from underneath - e de
Klimamodelle können die Zunahme des antarktischen Meereises nicht
nachvollziehen
en Antarctic sea ice reaches record high while IPCC models predicted the opposite
↑
a Ein weiterer Fehler des IPCC: Antarktis Eis um 50 % unterschätzt
en Another IPCC Error:
Antarctic Sea Ice Increase Underestimated by 50%
fr Une autre erreur du GIEC:
La glace de l'antarctique a été sous-estimée de 50%
|
|
|
|
↑
b Weitere Falschdarstellung im IPCC-Bericht:
Ausdehnung des Meereises rund um die Antarktis
en Yet Another Incorrect IPCC Assessment:
Antarctic Sea Ice Increase
-
Klimaskeptiker Info
2010-03-08 de Weitere Falschdarstellung im IPCC-Bericht:
Ausdehnung des Meereises rund um die Antarktis
-
MasterResource
2010-03-08 en Yet Another Incorrect IPCC Assessment: Antarctic Sea Ice Increase
↑
c Temperaturtrend auf antarktischer Halbinsel nicht nachvollziehbar
en Antarctic Agreements and Disagreements
|
↑
d Eis in der Ostantarktis wird von unten her dicker
en East Antarctic Ice Sheet getting thicker from underneath
-
Klimaskeptiker Info
2011-03-08 de Eis in der Ostantarktis wird von unten her dickerEine genaue Eisschild-Untersuchung in der Ostantarktis hat ergeben, daß die Eismasse nicht nur durch Schneefall wächst, sondern ein wesentlicher Teil des Eises von unten anfriert.
Diese neue Erkenntnis bedeutet, daß die Größe der Eismasse sich anders verhält, daß das Fließverhalten des Eisschildsanders ist und daß der Eisschild nach oben gebogen wird.
Alle diese Auswirkungen wurden in bisherigen Modellrechnungen nicht berücksichtigt.
Ein weiterer Beleg für die Tatsache, daß die bisher benutzten Zirkluations- und Klimamodelle die Realität nicht angemessen wiedergeben und damit wertlos sind - und ein Schlag ins Gesicht derer, die der Öffentlichkeit einreden wollen, das polare Eis sei wegen der "globalen Erwärmung" in Gefahr, zu verschwinden.
-
Watts Up With That? (Antony Watts)
2011-03-08 en East Antarctic Ice Sheet getting thicker from underneath
Quelle/ Source:
-
Science
2011-03-03 en Widespread Persistent Thickening of the East Antarctic Ice Sheet by Freezing from the BaseAbstract
An International Polar Year aerogeophysical investigation of the high interior of East Antarctica reveals widespread freeze-on that drives significant mass redistribution at the bottom of the ice sheet.
While surface accumulation of snow remains the primary mechanism for ice sheet growth, beneath Dome A 24% of the base by area is frozen-on ice.
In some places, up to half the ice thickness has been added from below.
These ice packages result from conductive cooling of water ponded near the Gamburtsev Subglacial Mountain ridges and supercooling of water forced up steep valley walls.
Persistent freeze-on thickens the ice column, alters basal ice rheology and fabric and upwarps the overlying ice sheet, including the oldest atmospheric climate archive, and drives flow behavior not captured in present models.
↑
e Klimamodelle können die Zunahme des antarktischen Meereises nicht
nachvollziehen
en
Antarctic sea ice reaches record high while
IPCC models predicted the opposite
-
Die kalte Sonne (Fritz Vahrenholt & Sebastian Lüning)
2012-10-22 de Klimamodelle können die Zunahme des antarktischen Meereises nicht nachvollziehenEine neue Studie des British Antarctic Survey hat sich jetzt angeschaut, zu welchen Ergebnissen die gängigen IPCC-Klimamodelle bei der antarktischen Meereisbedeckung kommen.
Leitautor John Turner und seine Kollegen veröffentlichte ihre Studie im September 2012 im Journal of Climate.
Das Ergebnis ist erschreckend:
Die meisten Klimasimulationen modellierten für die vergangenen 30 Jahre fälschlicherweise einen Rückgang des antarktischen Meereises.Reale Satellitendaten hingegen dokumentierten eine deutliche Zunahme des antarktischen Meereises.
-
The Hockey Schtick
2012-09-17 en Antarctic sea ice reaches record high while IPCC models predicted the opposite
Quelle / Source;
-
Journal of Climate
John Turner, Tom Bracegirdle, Tony Phillips, Gareth J. Marshall, J. Scott Hosking
British Antarctic Survey, National Environment Research Council, Cambridge, UK
2012 en An Initial Assessment of Antarctic Sea Ice Extent in the CMIP5 ModelsAbstract
We examine the annual cycle and trends in Antarctic sea ice extent (SIE) for 18 Coupled Model Intercomparison Project 5 models that were run with historical forcing for the 1850s to 2005.
Many of the models have an annual SIE cycle that differs markedly from that observed over the last 30 years.
The majority of models have too small a SIE at the minimum in February, while several of the models have less than two thirds of the observed SIE at the September maximum.
In contrast to the satellite data, which exhibits a slight increase in SIE, the mean SIE of the models over 1979-2005 shows a decrease in each month, with the greatest multi-model mean percentage monthly decline of 13.6% dec-1 in February and the greatest absolute loss of ice of -0.40 × 10⁶ km2 dec-1 in September.
The models have very large differences in SIE over 1860-2005.
Most of the control runs have statistically significant trends in SIE over their full time span and all the models have a negative trend in SIE since the mid-Nineteenth Century.
The negative SIE trends in most of the model runs over 1979-2005 are a continuation of an earlier decline, suggesting that the processes responsible for the observed increase over the last 30 years are not being simulated correctly.
| de | en | fr |
|---|---|---|
|
Auswirkungen des Klimas Antarktis (Südpol) |
Effects of Climate Change Antarctic (South Pole) |
Conséquences climatiques Antarctique (Pôle Sud) |
⇧ 6 Hurrikane / Hurricans / Ouragans
↑
a Hurrikane
en Hurricans
fr Ouracans
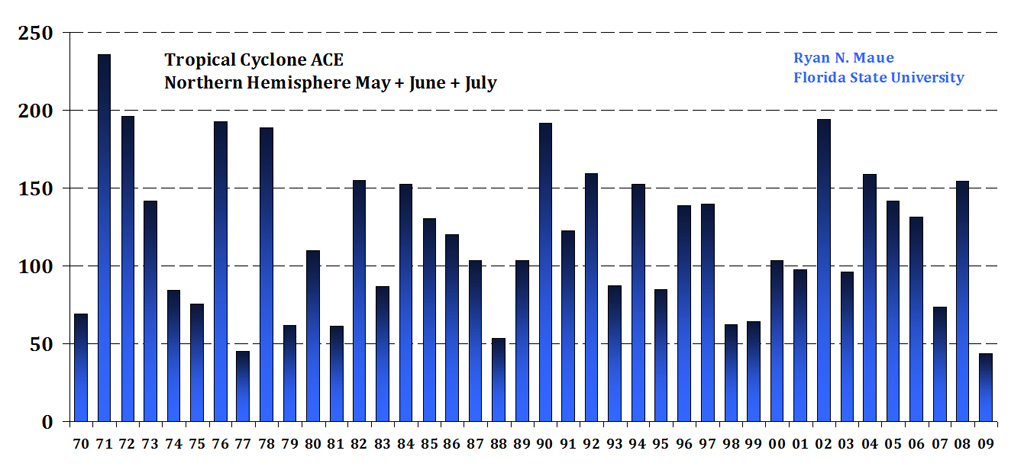
← Global accumulated cyclone energy

|
|
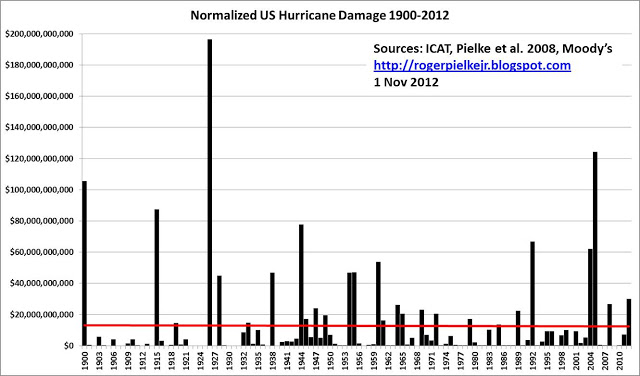
← Normalized US Hurricane Damage 1900-2012, Including Sandy
|
|
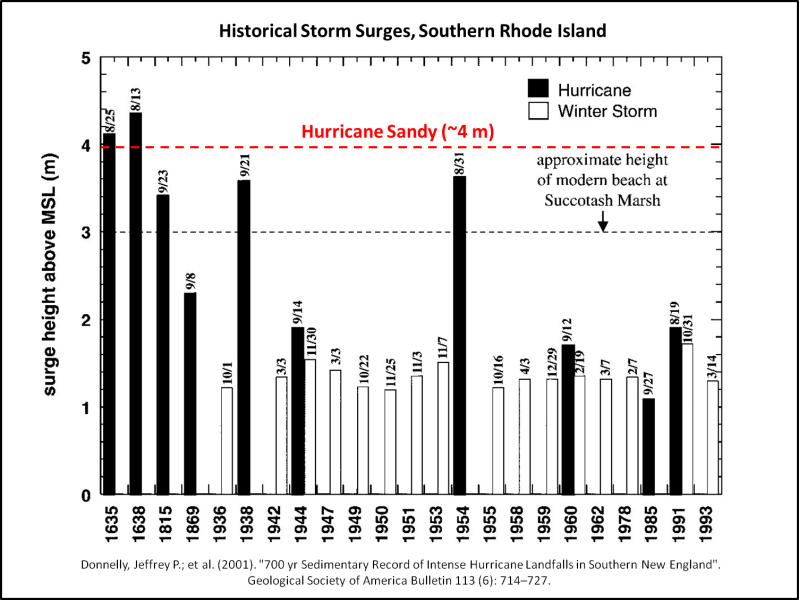
← Historical Storm Surges, South Rhode Island
|
|
-
Die kalte Sonne (Fritz Vahrenholt & Sebastian Lüning)
2012-08-02 de Ein unerwarteter Rekord: Noch nie mussten die Vereinigten Staaten während der letzten 100 Jahre so lange auf einen starken Hurrikan warten!
(mit neuem Diagramm)In den USA wird man langsam unruhig.
Noch vor wenigen Jahren hatte der IPCC vorhergesagt, dass die Hurrikane durch die Klimaerwärmung immer häufiger und auch stärker werden würden.Aber die Realität hat offenbar andere Pläne:
Seit nunmehr fast 2500 Tagen hat das Land jetzt keinen Monster-Hurrikan mehr erlebt.Das ist absoluter Rekord seit Beginn des 20. Jahrhunderts.
Noch nie musste man in dieser Zeit länger auf einen starken Hurrikan der Kategorie 3-5 warten.
2012-08-03 de Vorhersage für die Atlantische Hurrikansaison 2012: Die Hurrikan-Flaute hält wohl weiter an
|
|
|
| de | en | fr |
|---|---|---|
|
Klimawandel: Wissenschaft Ozeanzyklen & Ozeanische Oszillationen |
Climate change: Science Ocean Cycles & Ocean Oscillations |
Changement climatique: Science Cycles et oscillations océaniques |
| Ozeanzyklen steuern das Klima / El Niño (der Knabe/warm) & La Niña (das Mädchen/kalt) / ENSO: El Niño-Southern Oscillation / AMO: Atlantic Multidecadal Oscillation / NAO: North Atlantic Oscillation / AO: Arctic Oscillation / IOD: Indischer Ozean Dipol / PDO: Pacific decada oscillation | ||
-
Welt Online
2010-01-25 de Weltklimarat gerät erneut ins Zwielicht
-
Klimaskeptiker Info
2010-02-15 de Weitere IPCC-Behauptung in Frage - Globale Hurrikan-Aktivität ist nicht gestiegen
Neuer Ärger kommt auf das IPCC zu. Diesmal werden die Behauptungen des "Weltklimarats" über die angebliche globale Zunahme der Hurrikan-Aktivität in Frage gestellt.
Eine statistische Analyse der Rohdaten zeigt, daß die Behauptung, die globale Hurrikan-Aktivität habe zugenommen, nicht haltbar ist.
-
Watts Up With That? (Antony Watts)
2009-07-19 en Employment slump at NHC 2010-02-16 en IPCC Gate Du Jour - now IPCC hurricane data questioned 2010-02-24 en WMO: "... we cannot at this time conclusively identify anthropogenic signals in past tropical cyclone data." 2012-05-16 en Hurricane drought days at an all time high - Katrina Karma?
(with updated diagrams)
-
The Register
2010-02-15 en Now IPCC hurricane data is questioned
| de | en | fr |
|---|---|---|
|
Wetterphänomene Hurrikan |
Weather phenomena Hurricane |
Phénomènes météorologiques Ouragan |
⇧ 7 Wassermangel / Water Shortage / Pénurie d'eau
↑
a Allgemeine Betrachtungen
en General considerations
fr Considerations générales
⇧ de Verzeichnis en Contents fr Sommaire
- 2016
- de Klimamodelle hinterfragt: Wasserhaushalt schwankte im 20. Jahrhundert weniger stark als erwartet
- 2015
- de Der Tag, an dem es einen ganzen Zürichsee regnete
- 2010
- de
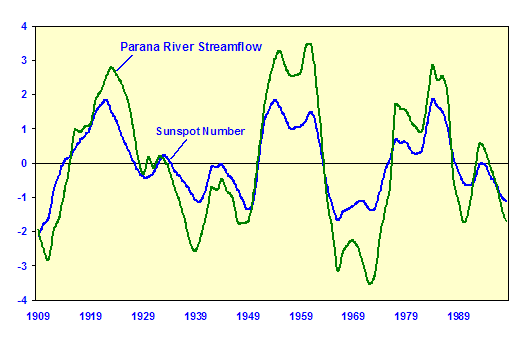
Sonnenaktivität und Wassermengen in Flüssen und Seen
en Solar to river flow and lake level correlations - de
IPCC unterschlägt die Abnahme der Gefahr von Wassermangel in der
Zukunft
en The IPCC: Hiding the Decline in the Future Global Population at Risk of Water Shortage
⇧ de Allgemein en General fr Générale
|
| de | en | fr |
|---|---|---|
| Wasser, Land, Nahrung Wasser |
Water, Land, Food Water |
Eau, terre, nourrit Eau |
| Wassermangel | ||
⇧ de Text en Text fr Texte
⇧ 2016
↑ Klimamodelle hinterfragt: Wasserhaushalt schwankte im 20. Jahrhundert weniger stark als erwartet
-
Die kalte Sonne (Fritz Vahrenholt & Sebastian Lüning)
2016-04-14 de Klimamodelle hinterfragt: Wasserhaushalt schwankte im 20. Jahrhundert weniger stark als erwartet
⇧ 2015
↑ Der Tag, an dem es einen ganzen Zürichsee regnete
-
Zürichsee-Zeitung / Martin Steinegger
2015-05-08 de Der Tag, an dem es einen ganzen Zürichsee regneteWie viel Wasser kann es in der Schweiz an einem Tag regnen?
Meteoschweiz gibt in einem aktuellen Blogbeitrag dazu die Antwort:
Einmal den ganzen Zürichsee.Der regenreichste Tag seit 1961 war der 7. August 1978.
An diesem Tag fielen gemäss der Berechnung von Meteoschweiz 3,6 km3 (Kubikkilometer) Wasser.
Das entspricht 3,6 Milliarden Kubikmeter. Oder anders umgerechnet:
es entspricht ziemlich genau dem Wasservolumen des Zürichsees, der etwa 3,9 Kubikkilometer fasst.Güterzug, 16-Mal um die Erde gewickelt
In der Schweiz kann es also an einem Tag einen ganzen Zürichsee regnen. Meteoschweiz bietet dazu eine anschauliche Umrechnung:
Würde man diese Wassermenge auf Kesselwagen der SBB verteilen, die 85000 Liter fassen und gut 15 Meter lang sind, benötigte man rund 42 Millionen Wagen.Aneinandergereiht würden diese einen 640000 Kilometer langen Zug bilden.
Diesen könnte man 16-Mal um die Erde «wickeln».
Auf Rang zwei der niederschlagsreichsten Tage folgen übrigens der 21. Dezember 1991 und der 8. August 2007.
An diesen beiden Tagen fielen aber gemäss Meteoschweiz deutlich geringere Wassermengen.
Oder anders ausgedrückte: es regnete keinen ganzen Zürichsee - sondern eher einen Walensee.
⇧ 2010
↑
Sonnenaktivität und Wassermengen in Flüssen und Seen
en
Solar to river flow and lake level correlations
|
|
|
|
de Korrelation zwischen der Sonnenaktivität (gemessen an der Zahl der Sonnenflecken) und der Wassermenge, die der südamerikanische Fluß Parana führt. Der Parana ist der zweitgrößte Fluß Südamerikas. Der gewaltige Itaipu-Damm mit einer installierten Kraftwerksleistung von 14.000 MW staut den Parana. |
en The figure above is after a figure from Maus et al 2010 "Long term solar activity influences on South American rivers". It shows a very good correlation between solar activity, as measured by sunspot number, and the flow rate of the Parana River, the second largest river in South America. The Parana River now hosts the Itaipu Dam with installed capacity of 14,000 MW. |
|
|
Die AGW-Anhänger behaupten, der Einfluß der Sonne auf das Klima sei gering, da sich der Betrag der Sonnenstrahlung nur gering mit dem Sonnenfleckenzyklus ändere. Wenn aber die Sonnenaktivität offenbar die Wassermengen in Flüssen und Seen steuert, ist ein Einfluß auf andere Aspekte des Wettergeschehens mindestens plausibel. |
|
de Der nur sehr zögerlich gestartete und sich schwach entwickelnde Zyklus 24 läßt angesichts des Einflusses auf die Flüsse verschiedene Folgen erwarten:
Wenn diese vorhergesagte Folgen eines schwachen Sonnenfleckenzyklus 24 eintreten, werden die CAGW-Anhänger zweifellos versuchen, sie als Konsequenzen der vermeintlichen globalen Erwärmung zu vermarkten - selbst wenn es bis dahin global kälter werden sollte. |
en Given the link between East African and central South American rainfall and solar activity, the list of economic impacts from the current solar minimum (Solar Cycles 24 and 25) can be expanded to:
This list is by no means exhaustive. The last time the world witnessed mass starvation was the 1965-67 drought in India which killed 1.5 million people. Things don't look pretty. |
↑
IPCC unterschlägt die Abnahme der Gefahr von Wassermangel in der
Zukunft
en
The IPCC: Hiding the Decline in the Future Global Population at Risk of
Water Shortage
-
Watts Up With That? (Antony Watts)
2010-01-18 en The IPCC: Hiding the Decline in the Future Global Population at Risk of Water ShortageThis is an error, based not on blunders or poor scholarship but on selective reporting of results, where one side of the story is highlighted but the other side is buried in silence.
In other words, it's a sin of omission, that is, it results, literally, from being economical with the truth.
It succeeds in conveying an erroneous impression of the issue - similar to what "hide the decline" did successfully (until Climategate opened and let the sunshine in).
-
IPCC Figure SPM.2
en Key impacts as a function of increasing global average temperature change
-
Arnell (2004), Table 10
en Number of people (million) with an increase or decrease in water stress
⇧ 8 IPCC Rapporte korrumpiert? / IPCC Reports corrupted?
↑
a Sind die IPCC Rapporte korrumpiert?
en Are the IPCC Reports corrupted?
fr Les rapport du GIEC sont-ils corrompus?
de IPCC Rapporte - Korruption?
-
"Dieser Report enthält nicht, was die auf der Titelseite des Rapports angegebenen Wissenschaftler angenommen haben."
-
"Mindestens 15 Schlüssel-Abschnitte wurden gestrichen", wie zum Beispiel:
-
"Keiner der obenerwähnten Studien zeigt einen klaren Beweis, dass der Klimawandel der Erhöhung der Treibhausgase zugeordnet werden kann."
-
"Die Änderungen seien auf die Antwort von Regierungen, individuellen Wissenschaftlerrn und NGO's vorgenommen worden."
en IPCC Reports - Corruption?
-
"This report is not what was approved by the contributing scientists listed on the title page."
-
"At least 15 key sections have been deleted." These include statements as:
-
"None of the studies cited above has shown clear evidence that we can attribute the observed [climate] changes to the specific cause of increases in greenhouse gases".
-
"No study to date has positively attributed all or part of the climate change observed to date to anthropogenic [manmade] causes."
-
Professor Seitz concluded:
"I have never witnessed a more disturbing corruption of peer-review process than the events that led to this IPCC report." -
"In his reply IPCC did not deny making these deletions but stated:
There has been no dishonesty, no corruption of the peer-review process and no bias and that uncertainties have not been suppressed." -
"Changes were in response to comments from governments, individual scientifists and non-governmental organizations."
fr Rapports du GIEC - Corrompu?
-
"Ce n'est pas la version qui a été approuvée par les scientifiques participants listés en première page."
-
"Au moins 15 parties de la section science ont été supprimées", comprenant des sections comme:
-
"Aucune des études citées ci-dessus n'a montré de preuve claire que nous pouvons attribuer les changement climatiques observée à la cause spécifique de l'augmentation des gaz à effet de serre."
-
"Aucune étude à ce jour n'a attribué de manière positive, tout ou une partie des changements climatiques observés aux causes humaines."
-
La conclusion de Professeur Seitz:
"Je n'ai jamais été témoins d'une corruption plus dérangeante du processus de relecture par des pairs que dans ce rapport du GIEC." -
"Dans sa réponse, le GIEC n'a pas nié avoir fait ces suppressions mais il disait qu'il n'y avait pas de malhonnêteté ou biais dans le rapport et que les incertitudes sur les causes du réchauffement global ont été incluses."
-
"Les changements ont été faits, dit le GIEC, en réponse aux commentaires venant des gouvernements, des scientifiques individuels et des ONG."
| de | en | fr |
|---|---|---|
|
IPCC Intergovernmental Panel on Climate Change Kritik am IPCC |
IPCC Intergovernmental Panel on Climate Change Criticism of IPCC |
GIEC Groupe d'experts intergouvernemental sur l'évolution du climat Critiques du GIEC |

