3.11.2 Bilder & Grafiken
en Figures & Charts
fr Images & graphiques
| Präsentationen: | Siehe auch Who is who, Ausschluss und Maulkorb für Kritiker, , Webseiten, Videos. | |||||||
| ⇨ | Allgemein | Bilder & Grafiken | Artikel & Vorträge | Video‑Präsentationen | Bücher | Literatur | Glossar | Diverses |
Mit folgenden Links wird von anderen Webseiten auf diese Seite verwiesen:
| de | en | fr |
|---|---|---|
|
Präsentationen Bilder & Grafiken |
Presentations Figures & Charts |
Présentations Images & graphiques |
de Verzeichnis en Contents fr Sommaire
-
Norm Kalmanovitch / Friends of Science
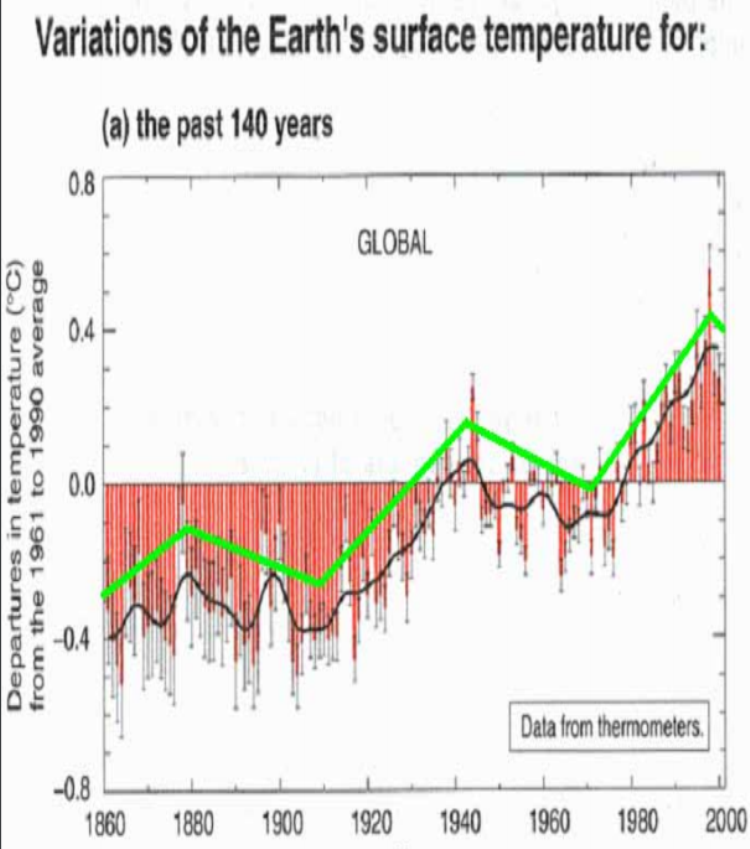
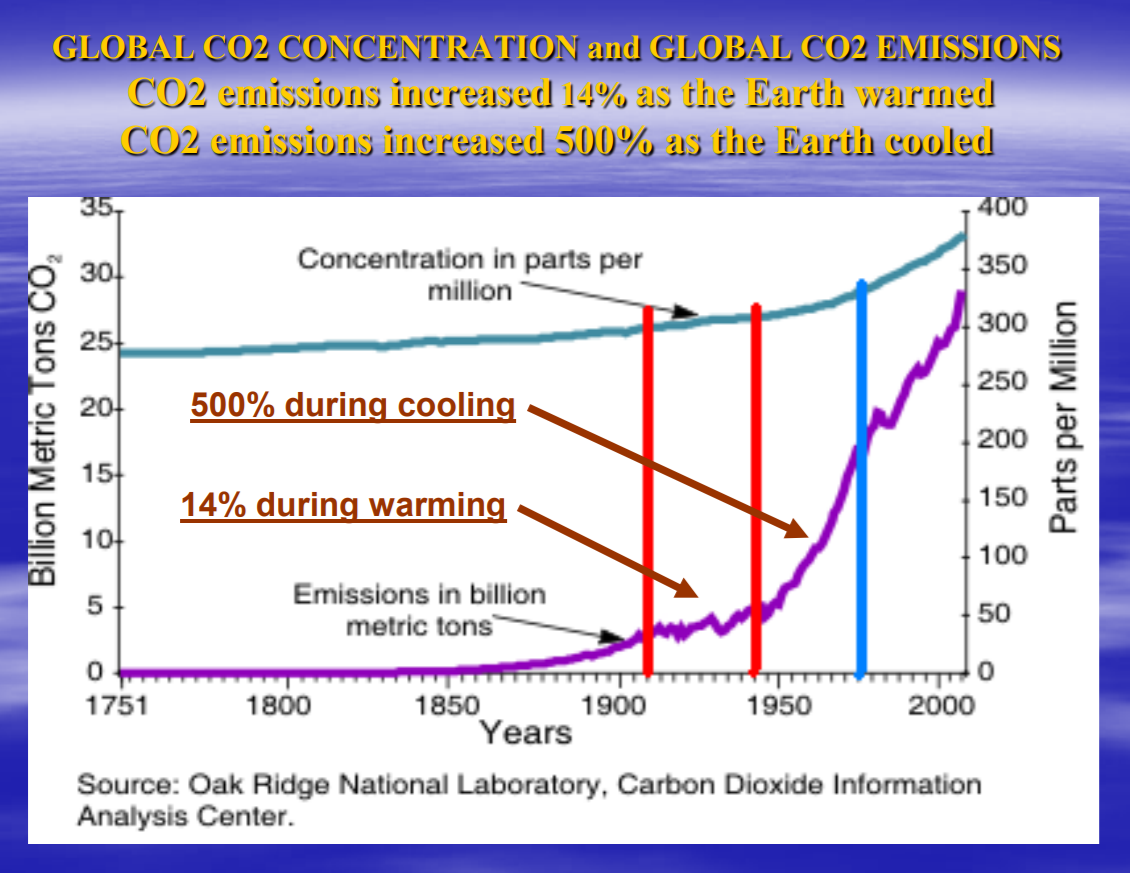
en The IPCC's Contradictory Global Temperature Data -
Leon Ashby
en The Truth About Global Warming -
Joanne Nova
de Das Skeptiker-Handbuch
en The Skeptic's Handbook
fr Manuel du Sceptique -
NIPCC-Report
en Nature, Not Human Activity, Rules the Climate
fr C'est la nature et non l'activité humaine qui détermind le climat -
Ernst-Georg Beck
de Global Cooling - Eine Präsentation vom 25.10. 2008 in Köln
en Global Cooling - evidence of the global cooling that has taken place over the last 7 years. -
Arthur B. Robinson, Noah E. Robinson, Willie Soon
en Environmental Effects of Increased Atmospheric Carbon Dioxide -
Joël Cambre
fr Le changement climatique est-il d'origine humaine? -
Richard Keen
en Global warming quiz -
Tim Patterson
en Is Global Warming a Threat? -
Yvon Dionne
fr Mes notes sur le réchauffement -
Warren Meyer
en Catastrophe Denied -
Christopher Monckton of Brenchley
en Apocalypse? No! Some selected slides from the presentation
en The heavy cost of a non-problem -
Fritz Vahrenholt
de Sonne und Treibhausgase - Ursachen des Klimawandels
en Global Warming: Second Thoughts of an Environmentalist -
Friedrich Karl Ewert
de Die Fallgruben der Klimawandler- Eine Dokumentation der wichtigsten Fakten für eilige Leser
de Text en Text fr Texte
↑ Präsentationen (Bilder & Grafiken)
Norm Kalmanovitch / Friends of Science
Mit folgenden Links wird von anderen Webseiten auf diese Seite verwiesen:
▶Norm Kalmanovitch: Präsentationen (Bilder & Grafiken)
| Norm Kalmanovitch |
Canadian Geophysicist
▶Norm Kalmanovitch: Who is who (Skeptiker) ▶Norm Kalmanovitch: Präsentationen (Bilder & Grafiken) |
en The IPCC's Contradictory Global Temperature Data
-
Friends of Science / Norm Kalmanovitch
2010-06-09 en "The IPCC's Contradictory Global Temperature Data"
SUMMARY
-
The current atmospheric CO2 concentration is 390ppmv
-
The concentration is increasing at a rate of 2ppmv/year
-
A doubling of atmospheric CO2 will take 195 years
-
This may produce 0.0448°C of increased global warming
-
To prevent this 0.0448°C warming, we are denying people basic food staples which are being used as feed stocks for biofuels
-
To prevent this 0.0448°C warming, we are doubling our energy costs with inefficient and very expensive wind and solar power initiatives
-
To prevent this 0.0448°C warming, we are creating a multi-billion dollar carbon trading market which has no physical basis and will ultimately collapse undermining any economic recovery
-
![]()
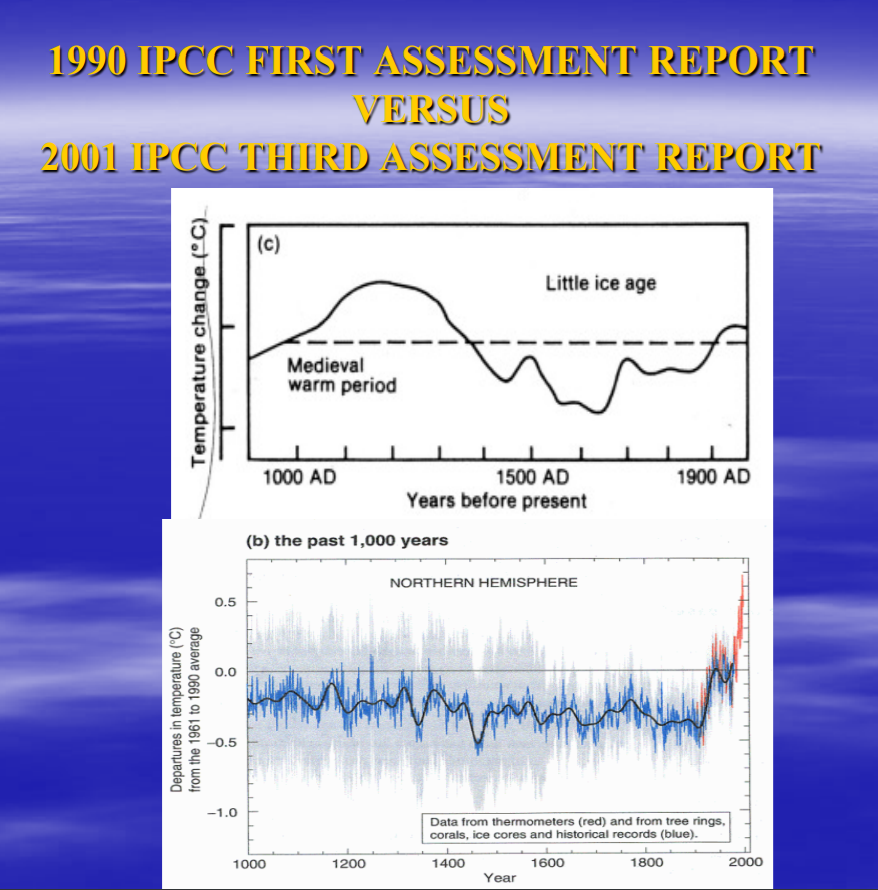
![]() Medieval warm period ?
Medieval warm period ?
This drawing of a graph in the IPCC's 1990 report shows it clearly

↑ Präsentationen (Bilder & Grafiken)
Leon Ashby
Mit folgenden Links wird von anderen Webseiten auf diese Seite verwiesen:
| Leon Ashby |
Presdent of the "Climate Sceptics"
▶Leon Ashby: Who is who (Skeptiker) ▶Leon Ashby: Präsentationen (Bilder & Grafiken) |
en The Truth About Global Warming
-
Klimaskeptiker Info
2009-10-25 de In Australien hat sich eine Partei der Klimaskeptiker gegründet (Wayback‑Archiv)Auf der Website der Partei finden sich viele nützliche und interessante Informationen.
Auf Umwegen wurde jetzt eine Powerpoint-Datei (3 MB groß)des Vorsitzenden Leon Ashby zur Erläuterung und Begründung der Anliegen der Partei verfügbar.
Sie faßt prägnant und anschaulich wesentliche Kritikpunkte an der AGW-Ideologie zusammen.
-
The Climate Sceptics (Australia)
en The world's first up-front poitical party representing climate sceptics (Wayback‑Archiv)
-
Leon Ashby
en The Truth About Global Warming
↑ Präsentationen (Bilder & Grafiken)
Joanne Nova
Mit folgenden Links wird von anderen Webseiten auf diese Seite verwiesen:
▶Joanne Nova: Das Skeptiker-Handbuch
| Joanne Nova |
Bachelor of Science from the University of Western Australia.
▶Joanne Nova: Who is who (Skeptiker) ▶Das Skeptiker-Handbuch (Joanne Nova): Präsentationen (Bilder & Grafiken) ▶Ausschluss und Maulkorb für Kritiker (Exile for non-believers) ▶Joanne Nova: Webseiten (Deutsch) ▶Joanne Nova: Webseiten (English) ▶Joanne Nova: Webseiten (français) |
↑ de Das deutsche Skeptiker-Handbuch
-
EIKE Europäisches Institut für Klima und Energie
2009-05-16 de Skeptiker-Handbuch für den Rest von uns!!Frau Nova ist jahrelang überzeugte Anhängerin der Treibhausthese gewesen, bevor sie endlich Argumente und Gegenargumente auf die Waagschale legte und erkannte, daß Begriffe wie "Treibhauseffekt", "Extremwetter", "Klimaschutz" etc. reine Fiktionen sind, die aus politischen und finanziellen Beweggründen von Interessengruppen in die Welt gesetzt wurden.
-
ef-online / Robert Grözinger
de CO2 und Klima: Handbuch für SkeptikerBerufshysteriker müssen sich warm anziehen
- Das Treibhaus-Signal bleibt aus.
- Der stärkste Beweis waren die Eisbohrkerne, aber neuere, detaillierte Daten haben die Theorie auf den Kopf gestellt.
- Die Temperaturen steigen nicht an.
- Kohlendioxid kann kaum noch mehr zur Erwärmung beitragen als schon jetzt.
-
Des weiteren zitiert Nova eine ganze Reihe von Naturwissenschaftlern, die in den letzten Jahren ihre Meinung hinsichtlich einer CO2-Theorie der Klimaerwärmung geändert haben.
Sie verweist auch auf das "Petition Project", wo bereits 30.000 Wissenschaftler die Aussage unterzeichnet haben, dass es keinen überzeugenden wissenschaftlichen Beweis dafür gebe, dass von Menschen freigesetztes Kohlendioxid oder andere Treibhausgase eine katastrophale Erwärmung des Klimas verursachen werden und dass es dagegen erhebliche wissenschaftliche Beweise gebe, dass sich Kohlendioxid vielfach vorteilhaft auf die Pflanzen- und Tierwelt auswirke.
Damit ist der vielbeschworene Konsens der Klimawissenschaftler ad acta gelegt.
↑ en The Skeptic's Handbook
-
Joanne Nova
en Das Skeptiker-Handbuch has arrived!
-
Friends of Science
en Consensus & Skeptics -
Joanne Nova
en About the Skeptics Handbook
↑ fr Manuel du Sceptique
Ce manuel illustré très pédagogique, entièrement gratuit, constitue une bonne base pour un débat grand public sur la question du réchauffement anthropique.
-
Skyfall / Changement Climatique
fr Manuel du Sceptique ClimatiqueCe manuel illustré très pédagogique, entièrement gratuit, constitue une bonne base pour un débat grand public sur la question du réchauffement anthropique.
↑ Präsentationen (Bilder & Grafiken)
NIPCC-Report
|
Nongovernmental International Panel on Climate Change (Internationale Nichtregierungskommission zum Klimawandel) ▶NIPCC: Organisation ▶NIPCC: Who is who (Skeptische Institute & Organisationen) ▶NIPCC: Präsentationen (Bilder & Grafiken) ▶NIPCC: Webseiten (Deutsch) ▶NIPCC: Webseiten (English) |
en
Nature, Not Human Activity, Rules the Climate
fr
C'est la nature et non l'activité humaine qui
détermind le climat
-
S. Fred Singer
2010-02-14 en Nature, Not Human Activity, Rules the Climate
Prof. S. Fred Singer discusses Nature-Not Human Activity-Rules the Climate, lecture given in the Faculty of Physics on Feb. 14, 2010
-
NIPCC-Report / S. Fred Singer
2008-04 en Nature, Not Human Activity, Rules the Climate
-
2008-04 fr
 C'est la nature et non l'activité humaine qui détermind le climat
|
Nongovernmental International Panel on Climate Change (Internationale Nichtregierungskommission zum Klimawandel) ▶NIPCC: Organisation ▶NIPCC: Who is who (Skeptische Institute & Organisationen) ▶NIPCC: Präsentationen (Bilder & Grafiken) ▶NIPCC: Webseiten (Deutsch) ▶NIPCC: Webseiten (English) |
|
S. Frederic (Fred) Singer *1924-09-27 †2020-04-20 |
de
Prof. Dr. S. Fred Singer stammt aus Wien und ist Atmosphären-
und Raumfahrtphysiker und Gründer und Vorsitzender des Science
and Environmental Policy Project (SEPP) en PhD, Professor Emeritus of Environmental Sciences, University of Virginia; Former director Weather Satellite Service; Founder and President of the Science & Enviromental Policy Project ▶S. Frederic (Fred) Singer: Who is who (Skeptiker) ▶S. Frederic (Fred) Singer: Video (Präsentationen) ▶S. Frederic (Fred) Singer: Wikipedia (Opfer) ▶Ausschluss und Maulkorb für Kritiker (Jean-Pascal van Ypersele ⬌ Prof. Dr. Fred Singer) |
↑ Präsentationen (Bilder & Grafiken)
Ernst-Georg Beck
|
Ernst-Georg Beck *1948 †2010-09-21 |
Dipl. Biologe, Biesheim, Frankreich
|
de
Global Cooling - Eine Präsentation vom 25.10. 2008 in Köln
en
Global Cooling - evidence of the global cooling that has taken
place over the last 7 years
Ernst-Georg Beck Dipl. Biol.
-
de Die nachfolgende Präsentation dokumentiert die klaren Anzeichen für eine Globale Abkühlung seit ca. 7 Jahren.
Entgegen aller hysterischen Alarmmeldungen von Hitzewellen und arktischer Eisschmelze: Die Erde kühlt sich seit ca. 7 Jahren dramatisch ab. Eine Präsentation anläßlich der Jahreshauptversammlung des BLS (Bundesverbandes für Landschaftsschutz) am 25. Oktober 2008 zeigt die Fakten und Ursachen auf.
en The following presentation documents the evidence of the global cooling that has taken place over the last 7 years.
EIKE Europäisches Institut für Klima und Energie
2008-10-25 de Global Cooling - Eine Präsentation vom 25.10. 2008 in Köln (BLS)
de
![]() Global Cooling (de)
(Seite gelöscht, kein Wayback)
Global Cooling (de)
(Seite gelöscht, kein Wayback)
Global Cooling
Ernst-Georg Beck, Dipl. Biol. 25 October 2008
The Heiligenroth Climate Manifesto
EIKE, European Institute for Climate and Energy
The following presentation documents the evidence of the global cooling that has taken place over the last 7 years.
Slide:
-
Status quo: The current doctrine: man-made climate change, reduction of CO₂, political and scientific responsibilities (p. 2).
-
Evidence of global cooling taking place over the last 7 years (~2001); CO₂ is rising, temperature is going down (p. 3).
-
In 2008 prominent scientists and IPCC-coworkers confirm the global cooling (Prof. Mojib Latif, p. 4).
-
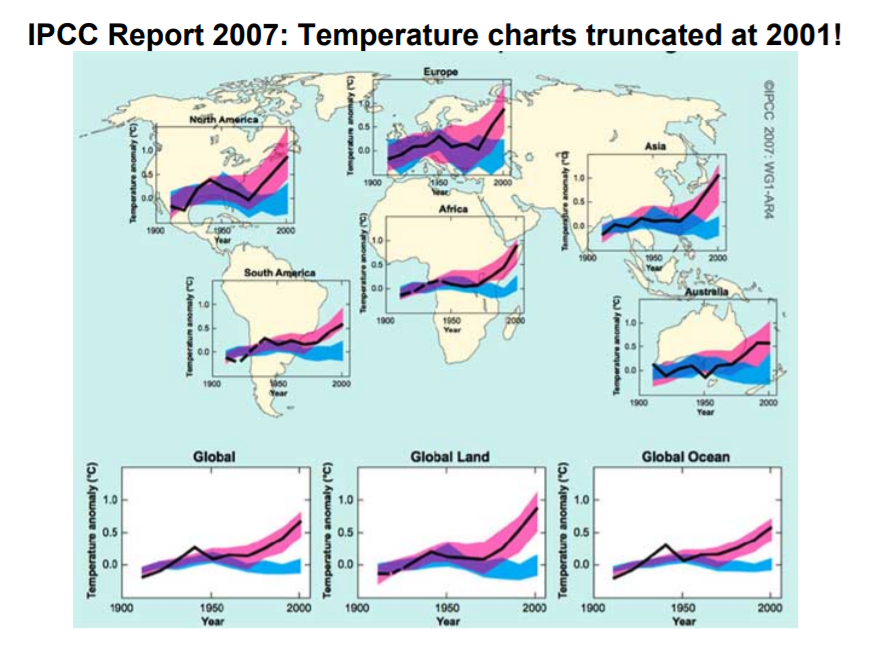
In 2007 the IPCC misled the world by publishing only temperature data up to 2001 (p. 5).
-
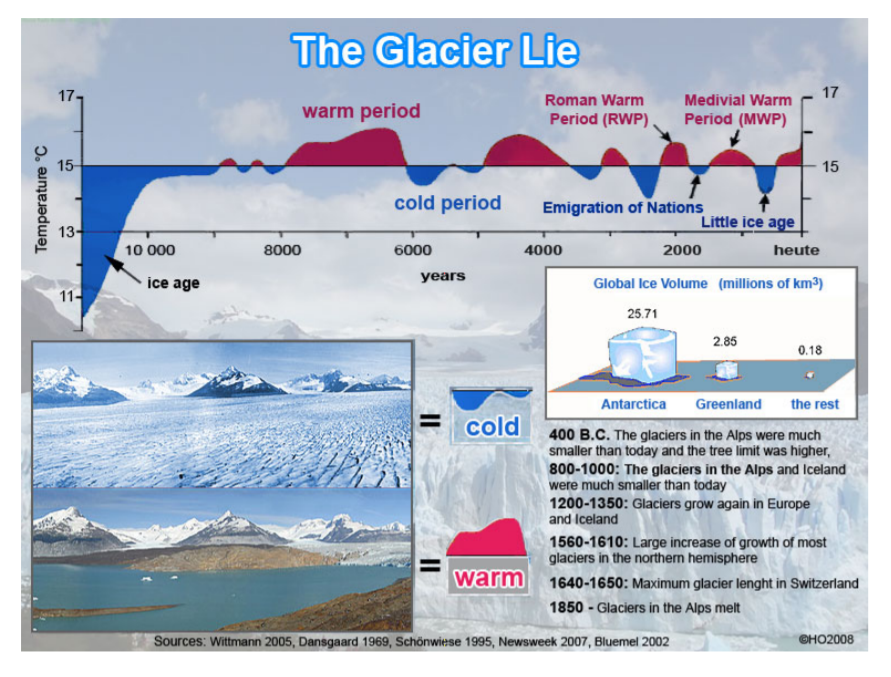
Evidence that the recent climate change is within natural variability: 10,000 years of changing warm and cold periods.
Glaciers retreated in warmer periods and grew during colder periods (p. 6).
-
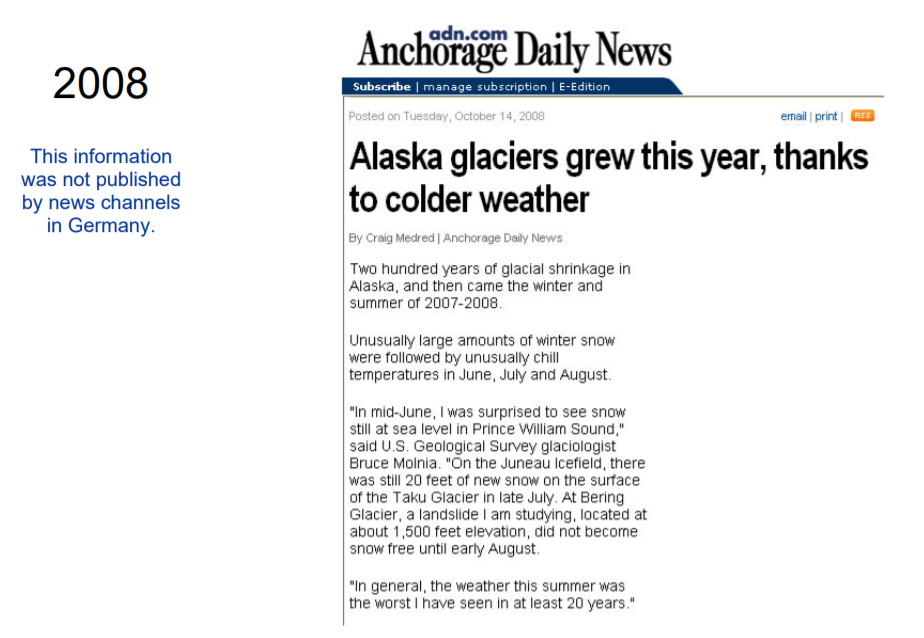
The glaciers of Alaska have started to grow again.
This was not news in German newspapers (p. 7).
-
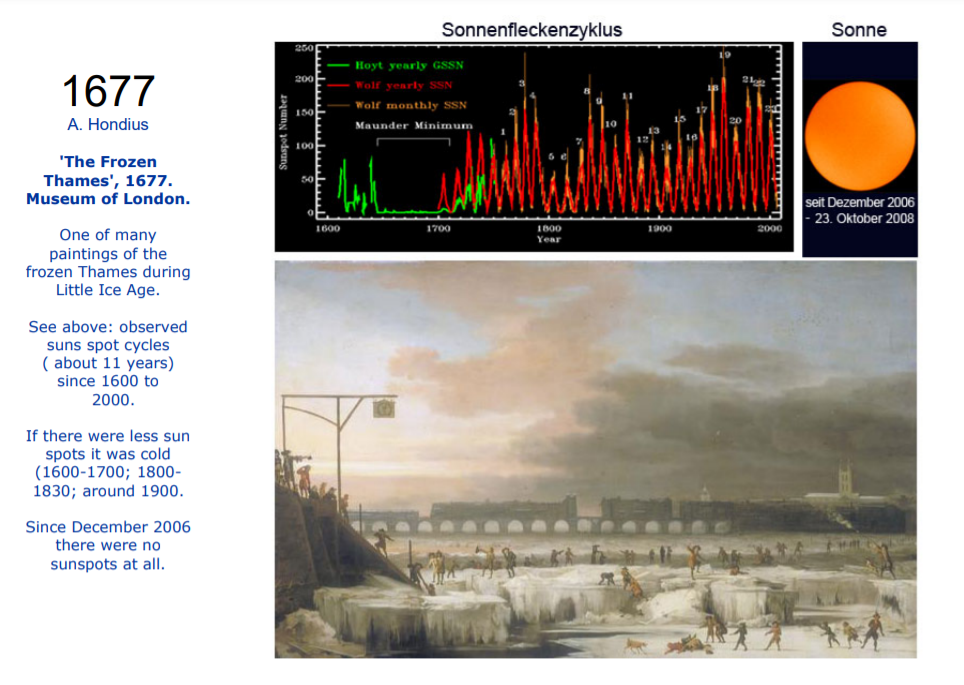
What's going on in the future? 350 years ago we experienced the Little Ice Age (LIA).
Rivers throughout Europe froze, the Baltic Sea froze during several months and harvests were bad.
Heaven forbid!
No sunspots were to be seen at any time.
Today we have not observed any sunspots since December 2006 (p. 8).
-
As news goes round the world: Arctic Temperatures Climb to a Record High (p. 9).
-
But: This is untrue: Arctic temperatures had risen to much higher levels around 1938, and the polar bears survived.
A climate cycle of warmer sea currents melts the Arctic sea ice cover every 65 years (p. 10).
-
Evidence: The ice cover at the polar circle has indeed grown (See satellite data 23 Oct 2008, Cryosphere today) (p. 11).
-
The cause of cooling: The Pacific Decadal Oscillation (PDO) has just entered its cold phase (p. 12).
-
Evidence: the Arctic Ocean has cooled down (p. 13).
Slide 1
![]()
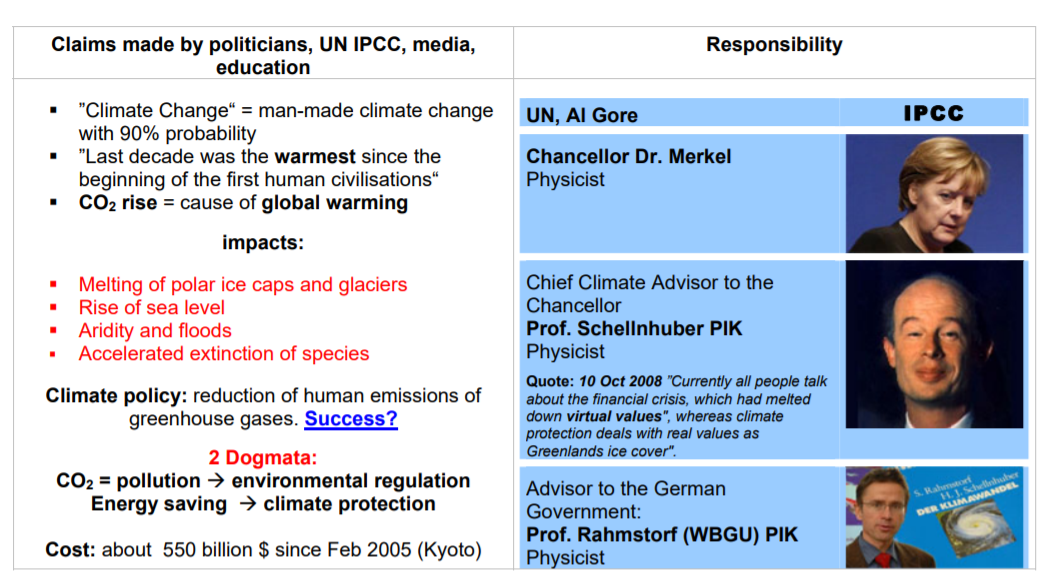
![]() The current doctrine: man-made climate change,
The current doctrine: man-made climate change,
reduction of CO₂, political and scientific responsibilities
| de | en | fr |
|---|---|---|
|
Klima Skandal: Profiteure Politiker |
Climate Scandal: Profiteurs Politics |
Scandale climatique: Profiteurs Politiciens |
Slide 2
![]()
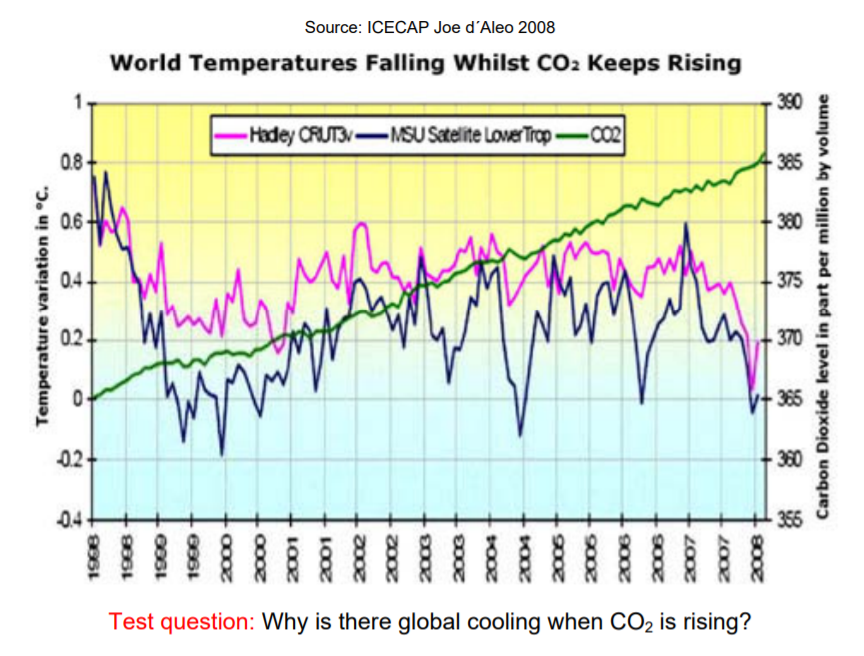
![]() Evidence of global cooling taking place over the last 7
years (~2001);
Evidence of global cooling taking place over the last 7
years (~2001);
CO₂ is rising, temperature is going down
| de | en | fr |
|---|---|---|
| Das CO2 steigt und die Temperaturen fallen | CO2 is rising and the temperatures are falling | Le CO2 monte et les températures baissent |
Slide 3
![]()
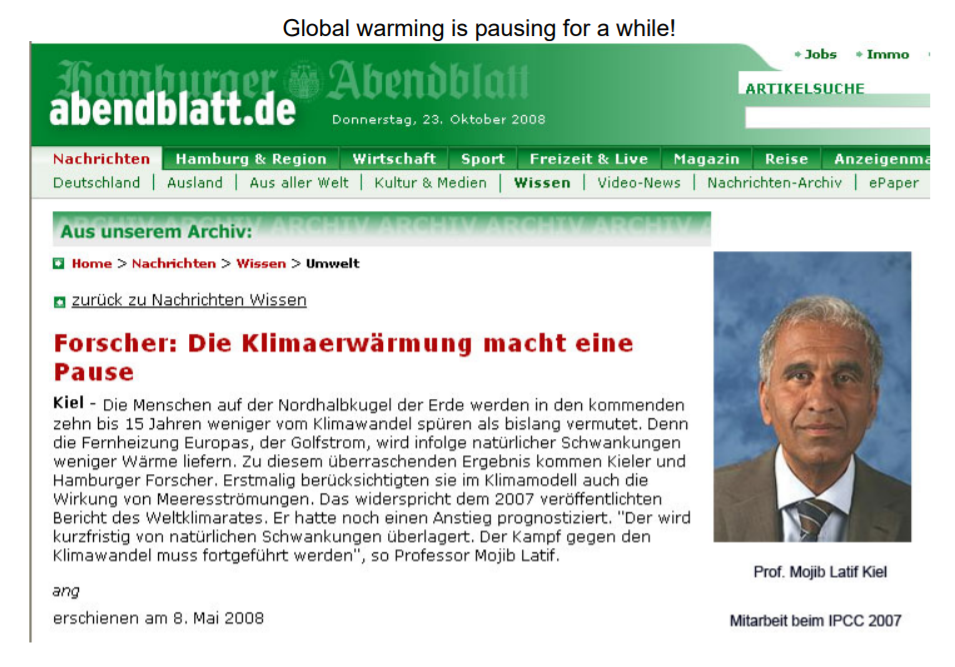
![]() In 2008 prominent scientists and IPCC-coworkers confirm
the global cooling
In 2008 prominent scientists and IPCC-coworkers confirm
the global cooling
(Prof. Mojib Latif)
| Mojib Latif |
Dr. rer. nat.,
Professor für Meteorologie am Leibniz-Institut für
Meereswissenschaften (IFM-GEOMAR) an der Universität Kiel.
▶Mojib Latif: Who is who (Aktivisten der anthropogenen Erwärmung) |
| de | en | fr |
|---|---|---|
| Neuste Informationen über den Klimawandel | News on Climate Change | Nouvelles informations sur le changement climatique |
| Die Erwärmungspause | The Hiatus | La pause du réchauffement climatique |
Slide 4
![]()
![]() In 2007 the IPCC misled the world by publishing only
temperature data up to 2001
In 2007 the IPCC misled the world by publishing only
temperature data up to 2001
by publishing only temperature data up to 2001
| de | en | fr |
|---|---|---|
|
IPCC Intergovernmental Panel on Climate Change IPCC-Szenarien: Prognosen oder Science Fiction? |
IPCC Intergovernmental Panel on Climate Change IPCC Szenarios: Prognostics or Scince Fiction? |
GIEC Groupe d'experts intergouvernemental sur l'évolution du climat GIEC-scenarios: prognostiques ou sience fiction? |
Slide 5
![]()
![]() Evidence that the recent climate change is within natural
variability:
Evidence that the recent climate change is within natural
variability:
10,000 years of changing warm and cold periods.
| de | en | fr |
|---|---|---|
|
Auswirkungen des Klimas Gletscher |
Impacts of Climate Change Glaciers |
Impacts du changement climatique Glaciers |
Slide 6
![]()
![]() The glaciers of Alaska have started to grow again.
The glaciers of Alaska have started to grow again.
This was not news in German newspapers
| de | en | fr |
|---|---|---|
|
Auswirkungen des Klimas Pole, Arktis, Antarktis |
Effects of Climate Change Pols, Arctic, Antarctic |
Conséquences climatiques Pôles, Arctique, Antarctique |
Slide 7
![]()
![]() What's going on in the future?
What's going on in the future?
350 years ago we experienced the Little Ice Age (LIA).
Rivers throughout Europe froze, the Baltic Sea froze during
several months and harvests were bad.
Heaven forbid!
No sunspots were to be seen at any time.
Today we have not observed any sunspots
since December 2006
| de | en | fr |
|---|---|---|
|
Klima Geschichte Klima in der Zukunft |
Climate History Climate in the future |
Histoire du climat Climat dans le futur |
|
|
weitere Bilder:
|
↑ Präsentationen (Bilder & Grafiken)
| Arthur B. & Noah E. Robinson |
Dr. Arthur Robinson is a distinguished chemist,
cofounder of the Oregon Institute of Science and Medicine (OISM).
He received a Ph.D. in chemistry from the University of California
at San Diego.
Dr. Robinson, along with his son Noah and others, organized the
Petition Project, a statement firmly rejecting global warming
alarmism.
▶Arthur B. & Noah E. Robinson: Who is who (Skeptiker) ▶Arthur B. & Noah E. Robinson: Präsentationen (Bilder & Grafiken) |
| Willie Soon |
Dr. Harvard-Smithsonian Center for Astrophysics
▶Willie Soon: Who is who (Skeptiker) ▶Willie Soon: Präsentationen (Bilder & Grafiken) ▶Willie Soon: Video (Präsentationen) |
Arthur B. Robinson, Noah E. Robinson, Willie Soon
en Environmental Effects of Increased Atmospheric Carbon Dioxide
-
Arthur B. Robinson, Noah E. Robinson, Andwillie Soon
en Environmental Effects of Increased Atmospheric Carbon Dioxide
en Environmental Effects of Increased Atmospheric Carbon Dioxide
![]()
![]() Fig.1: Surface temperatures
Fig.1: Surface temperatures
in the Sargasso Sea
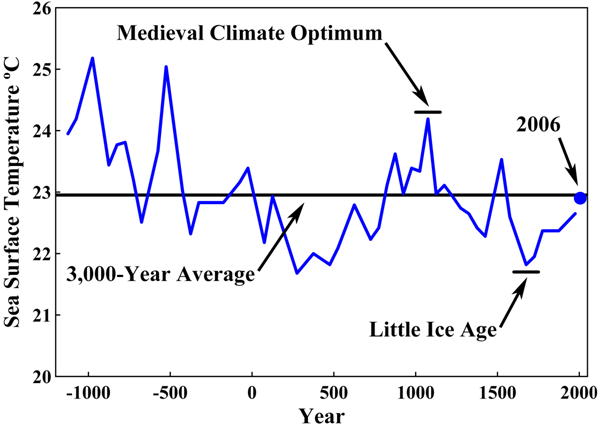
▶Verlauf: Sea Surfache Temperaturen
|
de
Gletscherschwund vor Kohlenwasserstoff-Anstieg:
en
Glacier shortening before Hydrocarbon use increase:
fr
Font des glaciers avant l'augmentation des hydrocarbures: |
▶Gletscher: Wann begannen die Gletscher zu schmelzen!
|
|
weitere Bilder:
|
↑ Präsentationen (Bilder & Grafiken)
↑ Joël Cambre
fr Le changement climatique est-il d'origine humaine?
-
Joël Cambre
2015-10-28 fr Le changement climatique est-il d'origine humaine?
↑ Präsentationen (Bilder & Grafiken)
Dr. Richard Keen
en Global warming quiz
Is Kyoto working?
-
Global warming quiz by Dr. Richard Keen, University of Colorado, Boulder
en Global warming quiz
According to Keen, "The global temperature for 2007 was the coldest in a decade and the coldest of the millennium."
After noting the recent cooling temps, Keen wrote "which is why 'global warming' is now called 'climate change.'"
Keen also pointed out that the most Antarctic sea ice on record was recorded in 2007 and then he rhetorically asked: "Did you see [that fact] reported in the news?"
Keen's quiz also showed that 10 out of 11 "wacky weather" events occurred in the U.S. before 1957.
Wacky Weather: When did most of the following events occur?
- Alaskan glaciers melt at the rate of 1 mile per year 1900
- Alaska bakes at 100 degrees north of the Arctic Circle 1915
- North Dakota bakes at 120 degrees 1936
- Hurricane hits Boston with Category 5 winds (180 mph) 1938
- Hurricane kills half the population of a large southern city Galveston 1900
- Hurricane destroys most of Los Angeles 1839
- Half a dozen hurricanes hit the East Coast of the US 1954-1955
- A dozen tornadoes strike Los Angeles 1983
- A major US city hit by a hurricane, tornado & earthquake Charleston 1886
- U.S. warmest year ever; 20 states set new all time heat records 1934
- Greenland warms - Farmers raise crops and brew beer 1000 A.D.
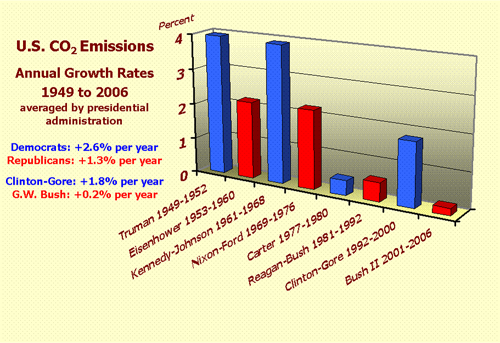
Keen's global warming PowerPoint also asks: "Since 1949, which [presidential] administration has overseen the smallest increase of greenhouse gas (mostly CO2) emissions?" Keen shows a chart revealing that the answer is President George W. Bush. "U.S. carbon emission growth rate has slowed to 0.2 % per year since 2000," Keen wrote.
Keen's PowerPoint asks is "Kyoto is working?" and then provides data showing the treaty is failing. "Between 1997 and 2004 (the most recent year for which we have complete statistics), carbon dioxide emissions rose as follows:
-
Worldwide Emissions increased 18.0 %
-
Countries that ratified the protocol increased 21.1 %
-
Non-ratifiers of the protocol increased 10.0 %
-
U.S. (a non-ratifier) increased 6.6 %
-
75 % of Kyoto signers had more CO2 growth than the U.S.
-
U.S. emissions have risen only 0.2 % per year since 2000."
Keen concludes his PowerPoint by stating:
"Enjoy the warm climate while it lasts, and please make enough CO2 to feed a tree."
↑ Präsentationen (Bilder & Grafiken)
Dr. Tim Patterson
| R. Timothy (Tim) Patterson |
PhD, Professor & Director, Ottawa-Carleton Geoscience Center Department of Earth Sciences, Carleston University ▶R. Timothy (Tim) Patterson: Who is who (Skeptiker) ▶R. Timothy (Tim) Patterson: Präsentationen (Bilder & Grafiken) ▶R. Timothy (Tim) Patterson: Video (Präsentationen) |
en Is Global Warming a Threat?
-
Friends of science / Dr. Tim Patterson, Professor of earth science at Carleston University
en Is Global Warming a Threat?
↑ Präsentationen (Bilder & Grafiken)
Yvon Dionne
fr Mes notes sur le réchauffement
-
Yvon Dionne
2009-10-04 fr Mes notes sur le réchauffement
↑ Präsentationen (Bilder & Grafiken)
Warren Meyer
| Warren Meyer |
MBA, with High Distinction, Harvard Business School. BSE Magna Cum Laude, Mechanical Engineering, with emphasis in control theory, Princeton University. ▶Warren Meyer: Who is who (Skeptiker) ▶Warren Meyer: Präsentationen (Bilder & Grafiken) ▶Warren Meyer: Video (Präsentationen) ▶Warren Meyer: Websites (English) |
en Catastrophe Denied
-
Climate Skeptic (Warren Meyer)
en Home
2008-07-19 en Why Does NASA Oppose Satellites?
2008-11-18 en Your One-Stop Climate Panic Resource
2008-09-14 en Retreating Glaciers
2009-12-02 en A Total Bluff
2009-12-08 en Why the Historical Warming Numbers Matter
2010-02-05 en The Madness of Prince Charles
2010-03-16 en Oh, Maybe Ocean Oscillations are Important
2010-03-17 en The Single Most Important Point
2010-03-18 en Freaking AmazingCatastrophe Denied (Warren Meyer)
2009-11-10 en A Critique of Catastrophic Man-Made Global Warming Theory
 Presentation (PDF)
 Presentation (PPT)
en
Google Docs.
en
Source
↑ Präsentationen (Bilder & Grafiken)
Christopher Monckton of Brenchley
|
Lord Christopher Walter Monckton *1952 |
Lord, Third Viscount Monckton of Brenchley Journalist, Science advisor to Britain's Thatcher administration, British politician and business consultant, policy advisor, writer, and inventor. ▶Lord Christopher Monckton: Who is who (Skeptiker) ▶Lord Christopher Monckton: Who is who (Skeptische Politiker & Regierungen) ▶Lord Christopher Monckton: Präsentationen (Bilder & Grafiken) ▶Lord Christopher Monckton: Video (Präsentationen) ▶Ausschluss und Maulkorb für Kritiker (Alongside Al Gore - Lord Christopher Monckton is refused) |
en Apocalypse? No! Some selected slides from the presentation
en The heavy cost of a non-problem
-
Christopher Monckton of Brenchley
California State Assembly
2012-03-21 en The heavy cost of a non-problem
Quelle / Source:
-
Watts Up With That? (Antony Watts)
2012-03-23 en Monckton's Slide Presentation to the California Assembly
↑ Präsentationen (Bilder & Grafiken)
Fritz Vahrenholt
|
Fritz Vahrenholt
Homepage
KlimaNachrichten/Die Kalte Sonne
Wikipedia
|
Professor, Dr., Deutscher Politiker (SPD), Manager, Wissenschaftler
und Buchautor. ►Fritz Vahrenholt: Who is who (Skeptiker) ▶Fritz Vahrenholt: Präsentationen (Bilder & Grafiken) ▶Fritz Vahrenholt: Video-Präsentationen ▶Fritz Vahrenholt: Wikipedia (Opfer von Wikipedia) |
de
Sonne und Treibhausgase - Ursachen des Klimawandels
en
Global Warming: Second Thoughts of an Environmentalist
de
![]() Sonne und Treibhausgase - Ursachen des Klimawandels
Sonne und Treibhausgase - Ursachen des Klimawandels
(
Quelle 1,
Quelle 2)
en
![]() Global Warming: Second Thoughts of an Environmentalist
Global Warming: Second Thoughts of an Environmentalist
A) Total Solar Irradiance (TSI)
B) Temperature Development

Two things are noteworthy:
-
Every time when solar activity was low, there were periods of cold weather.
Whenever the sun was strong (like in the current warm period, the Roman Warm Period and the Medieval Warm Period), there were warm periods.
-
Secondly, there is obviously a 1,000-year cycle with alternating hot and cold periods.
↑ Präsentationen (Bilder & Grafiken)
Friedrich Karl Ewert, em. Professor für Geologie
| Friedrich-Karl Ewert |
Prof. em. Dr. Universität Paderborn, i.R. Beiratsmitglied von EIKE ▶Friedrich-Karl Ewert: Who is who (Skeptiker) ▶Friedrich-Karl Ewert: Präsentationen (Bilder & Grafiken) ▶Friedrich-Karl Ewert: Video (Präsentationen) |
Die Fallgruben der Klimawandler -
Eine Dokumentation der wichtigsten Fakten für eilige Leser
-
EIKE Europäisches Institut für Klima und Energie
Friedrich Karl Ewert, em. Professor für Geologie
2012-07-31 de Teil 1

 Die sich ändernden CO2-Gehalte der
Atmosphäre waren seit 600 Mill. Jahren zumeist sehr viel höher als heute,
was weder der Biosphäre geschadet noch Eiszeiten verhindert hat
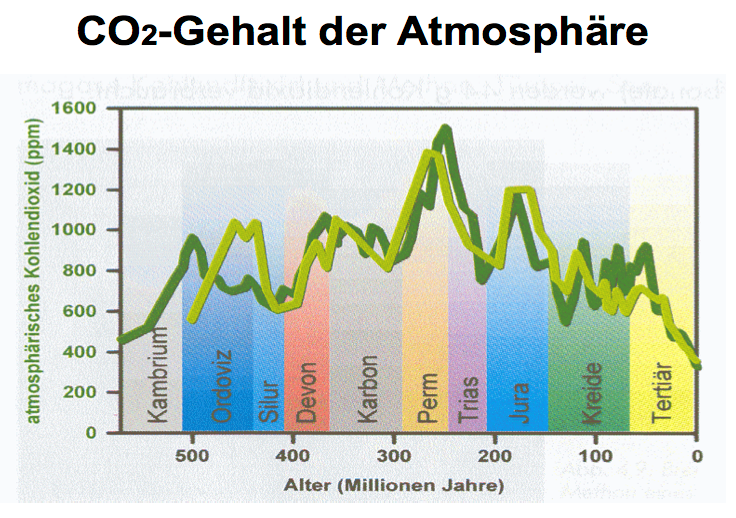
-
2012-08-02 de Teil 2


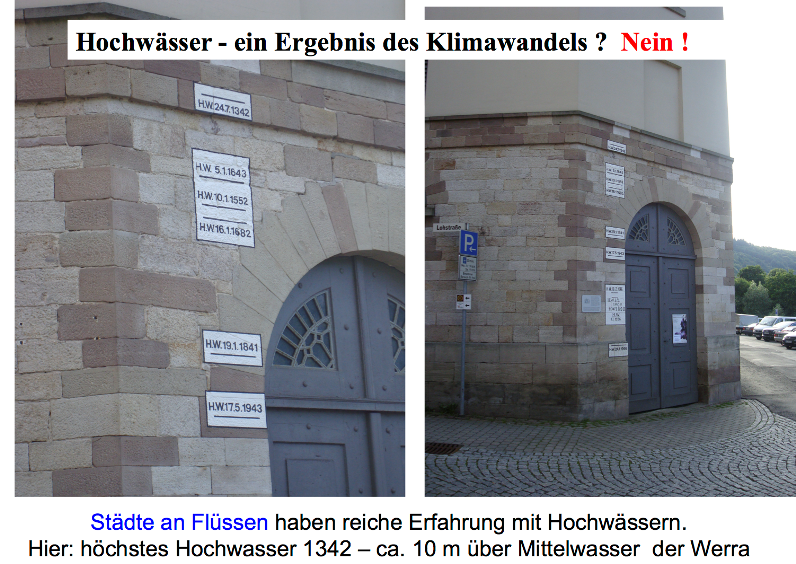
Am Zusammenfluss von Werra und Fulda dürfte 1342 das Hochwasser mindestens 10 m über den Mittelwasser-Pegel gereicht haben.
