3.1.4 Neuste Informationen über den Klimawandel
en
News on Climate Change
fr
Nouvelles informations sur le changement climatique
| ⇨ | Klima: Wandel│ Fragen│ Wissenschaft│ Probleme│ Beurteilung│ Diskurse│ Auswirkungen | |||
| ⇩ | Klima-Skandal: Manipulation│ Realität│ Angst | |||
| ⇩ | Neue Kälteperiode: Kaltzeit│ Auswirkung | |||
Mit folgendem Link wird von anderen Webseiten auf diese Seite verwiesen.
▶Neuste Informationen zum Klimawandel| de | en | fr |
|---|---|---|
| Neuste Informationen über den Klimawandel | News on Climate Change | Nouvelles informations sur le changement climatique |
| Die Erwärmungspause | The Hiatus | La pause du réchauffement climatique |
- 1 de
Die Erwärmungspause
en Global warming hiatus
fr La pause du réchauffement climatique Weltinfo:
Neuste Informationen über den Klimawandel
Weltinfo:
Neuste Informationen über den Klimawandel
- 2 Globale Temperaturen
- a
de
Land-Oberflächentemperaturen
en Land air temperatures - b
de
Temperaturen in der Arktis
en Arctic Temperatures - c
de
Temperaturen in der Antarktis
en Antarctic Temperatures - d
de
Vergleich von Oberflächen- und Satelliten-Temperaturen
en Comparing Surface and Satellite Temperatures - e
de
Baumringdaten
en Tree ring data
- a
de
Land-Oberflächentemperaturen
- 3 Meerestemperaturen
- a Oberflächentemperaturen der Meere
- b Wärmeinhalt Nord-Atlantik
- c de
Suche nach der angeblich im Ozean versunkenen Wärme endet mit Fehlschlag:
Tiefe Meeresschichten kühlten sich in den letzten 20 Jahren ab
en The "heat went to the oceans" excuse and Trenberth's missing heat is AWOL - deep ocean has not warmed since 2005
- 4 Temperaturen der Troposphäre
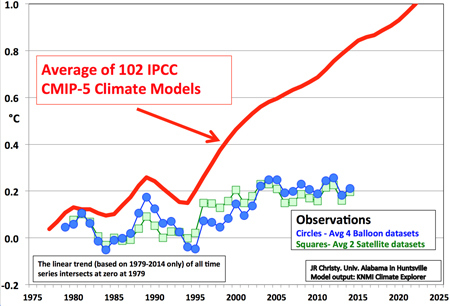
- 5 Das Versagen der offiziellen Temperaturvoraussagen
- 6 Fehlerhafte Temperaturmessungen
- 7 de
Temperatur-Manipulationen
en Temperature Manipulations
fr Manipulation des températures- a de
Die GISS-Daten werden nachträglich verändert
en USHCN and GISS decided to "adjust" the temperature record - b de
Gitterpunktsabstand
en Smoothing Radius - c de
NOAA hat alle ausser 1,500 von 6,000 Thermometern gelöscht
en NOAA had deleted all but 1,500 of the 6,000 thermometers - d en Black Swan Climate Theory
- e de
NOAA in Not: Erwärmungspause der letzten 15 Jahre lässt sich nicht
so einfach wegtricksen
en NOAA erases 'pause' in warming - f de
NASA/GISS Hansen: Drei Jahrzente Temperaturdaten-Anpassung
en NASA/GISS Hansen: Three decades of Temperature Adjustments - g de
1940 wärmer als 1998? - Ja!
en 1940 warmer than 1998? - Yes!
fr 1940 plus chaud que 1998? - Oui! - h en UK Met Office Hadley Centre / Professor Phil Jones
- i de
Das Hockeyschläger Diagramm
en The Hockey stick curve
fr La courbe en crosse de hockey - j de
Als das IPCC das Mittelalterliche Klimaoptimum verschwinden ließ
en IPCC changed viewpoint on the MWP in 2001
fr Comme le GIEC avait disparu le Optimum médiéval climatique
- a de
Die GISS-Daten werden nachträglich verändert
- 8 Sonnenaktivität / Solar activity / Activité solaire
- 9 Sonnenzyklen / Solar cycles / Cyckes solaire
- 10 Ozeanische Oszillationen / Ocean oscillations / Oscillations océaniques
- 11 Klima-Zyklen und ihre Extrapolation in die Zukunft
- 12 Kohlenstoffdioxid (CO2
- 13 Methan (CH14 )
- 14
Die wichtigsten Auswirkungen des Klimas
- a Arktis (Nordpol) / Arctic / Arctique
- b Grönland / Greenland / Grœnland
- c Antarktis (Südpol) / Antarctic / Antarctique
- d Gletscher / Glaciers / Glaciers
- e Meeresspiegel / Sea level/ Niveau des océans
- f Hurrikane / Hurricanes / Ouragans
- g Extremwetter / Extreme Weather Events / Intempéries extrèmes
- h Biosphäre / Bioshphere / Biosphère
- 15 Begriffe, Definitionen und Referenz-Seiten
- 16 Globaler Erwärmungs-Stillstand seit 1998
- 17 Prognosen für die Zukunft
- 18 Aus der Vergangenheit
- a
de
IPCC liess das Mittelalterliche Klimaoptimum und die Kleine Eiszeit
verschwinden
en IPCC changed viewpoint on the MWP in 2001
fr Le GIEC fait disparaître l'optimum climatique médiéval - b
de
Die Mittelalterliche Warmzeit -
Erwärmung oder Datenmanipulation?
en The Medieval Warm Period - warming or data manipulation? - c
de
Das römische Klimaoptimum in Nordamerika
en Roman Warm Period (North America) - d
de
Klimamodelle können nicht erklären, warum es vor 800 Jahren
wärmer war
en Climate models don't know why it was warmer 800 years ago - e
de
Eiszeiten in der Vergangenheit
en Ice ages in the past
fr Période glaciaires dans le passé
- a
de
IPCC liess das Mittelalterliche Klimaoptimum und die Kleine Eiszeit
verschwinden
- 19 Panikmeldungen und Antwort in dieser Website
- 20 Publikationen
- a de
Mythos Treibhauseffekt: Der Klima-Schwindel
Rettung vor den Klimarettern - Gibt es die "Gefahr für das Weltklima"? - b en The Climate Skeptics Party launch 4 television ads in Australia
- c en Current Global Temperatures Impossible According to IPCC 'Science'
- d de Das wissenschaftliche Ende der Klimakatastrophe?
- e de Klimawandel durch Kohlendioxid? Wissenschaftsskandal oder Abzockerei?
- f de Horst Malberg: Langfristiger Klimawandel auf der globalen, lokalen und regionalen Klimaskala und seine primäre Ursache
- g en Not Evil Just Wrong
- h de Augenmaß beim Klimaschutz
- i de IPCC-Experte Richard Courtney lehnt "Klimaschutz" ab
- j de Zur künstlich herbeigeführte Klimapsychose: Cui Bono?
- k de CO2 - und Klimahysterie
- l de Wird jemand die globale Abkühlung bemerken?
- m de Wird alles immer schlimmer? - Kommt die Klimakatastrophe?
- n de "Klimaschutz" ist schädlich
- o en Name just three clear signs the planet is warming
- p de Was bedeutet der globale CO2-Anstieg für das Klima? - Nichts!
- q de
Freispruch für CO2
en Disproving The Anthropogenic Global Warming (AGW) Problem
- a de
Mythos Treibhauseffekt: Der Klima-Schwindel
- 21 Hoffnung auf Vernunft
⇧
1 Die Erwärmungspause
en The Hiatus
fr La pause du réchauffement climatique
Mit folgenden Links wird von anderen Webseiten auf diese Seite verwiesen:
▶Die Erwärmungspause| de | en | fr |
|---|---|---|
| Neuste Informationen über den Klimawandel | News on Climate Change | Nouvelles informations sur le changement climatique |
| Die Erwärmungspause | The Hiatus | La pause du réchauffement climatique |
Siehe Klimaschau in Welt-Info
⇧ de Verzeichnis en Contents fr Sommaire
- 2023
- en
NOAA makes it official
Last 8 years... global cooling... at a rate of 0.11°C/decade....
despite 450+ billion tons of emissions worth 14% of total manmade CO2 in the atmosphere.
Steve Milloy (2023-01-13) - de
Siebt-wärmstes Jahr 2022: Erwärmung verlangsamt sich
Javier Vinós / EIKE (2023-01-10) - de
Globale Erwärmung wird eine Pause einlegen
Fritz Vahrenholt / Vaherholts Newsletter (2023-01-07)
neueste wissenschaftliche Untersuchungen zeigen für Europa,
dass es erst einmal 15-20 Jahre leicht bergab gehen wird.
- 2019
- de
Phänologie: Pflanzen bestätigen Erwärmungs-Hiatus zu Beginn des
21. Jahrhunderts
en No trends in spring and autumn phenology during the global warming hiatus
Slowdown in Earth's Temps Stabilized Nature's Calendar - de
 Sven Plöger und das 5-fache Motiv ein Grad Celsius aus dem
Treibhauseffekt verschwinden zu lassen !!
Sven Plöger und das 5-fache Motiv ein Grad Celsius aus dem
Treibhauseffekt verschwinden zu lassen !!
- en Not a Single Environmental Prediction of the Last 50 Years Has Come True
- en Planet-Sized Experiments - we've already done the 2°C test
- 2018
- de
Klimasensitivität - Wer rechnet hier falsch ?
Die Milchmädchen-Rechnung, die Klima-Politiker, Journalisten und etliche Klimatologen nicht machen können oder wollen, lautet wie folgt:
Bis zur Verdoppelung des CO2-Gehaltes von heute 400 auf 800 ppm vergehen bei den aktuellen Emissionen mit einem Anstieg von ca. 2 ppm pro Jahr noch 200 Jahre.
Das bedeutet real in 100 Jahren ca. + 1,5°C - genau das, was sich Politiker bei der Pariser Konferenz so vorgestellt haben, aber ohne kostspielige und risikoreiche CO2-Verminderungsmaßnahmen.
- en Secrets about the 1.5°C world temperature limit
- de Der September zeigt seit über 100 Jahren keine Erwärmung. Wo bleibt die Wirkung der Treibhausgase?
- de Klimawandel in Österreich: So veränderte sich die Temperatur
- de
"Anthropozän" fällt bei Kommission zur Stratigraphie glatt
durch
en Blow to warmists, the proposed 'Anthropocene' epoch has been denied by ICS - de Wir sollten jetzt die realen und nachteiligen Folgen von Abkühlung fürchten
- de Hamburger Forsythie muss wohl auf die schwarze Klimaleugnerliste
- en Don't Tell Anyone, But We Just Had Two Years Of Record-Breaking Global Cooling
- de Die WikiManufaktur
- de
Schnee- und Temperaturtrends in den Alpen: 120 Jahre
Klimageschichte rund um den Arlberg
- de Ach wie gut, dass niemand weiß, dass ich PDO heiß'
- 2017
- de
Kein neuer Rekord: Globale Mitteltemperatur 2016 erreichte lediglich
das Niveau von 1998
en @NOAA data demonstrates that 2016 was not the 'hottest year ever' in the USA - 2016
- de
Beginnt die globale Abkühlung?
Globale Mitteltemperatur stürzt um mehr als 1 °C steil ab.
en Steepest drop in global temperature on record - de Was ist da los? Der Hochsommermonat August wird in Deutschland nicht mehr wärmer
- de
Mogeln, tricksen, täuschen
Bei Harald Lesch sind Hopfen (und Malz) verloren - en Say Hello to La Niña Conditions
- de Globale Mitteltemperatur! Abschluss-Statistik 2015: jetzt einschließlich Dezember 2015
- de
Wissenschaftler entlarvt schonungslos die Klima
Behauptung der NOAA
en In defense of satellite temperature data - Dr. John Christy's powerful Senate testimony - 2015
- de Solares Paradoxon Deutschlands, Teil I: Solare Zyklen in der deutschen und der globalen Temperaturmessreihe
- de Klimawandel: Warum es in den Bergen trotzdem kälter wurde
- de
DWD widerspricht seinen eigenen Messungen
"Der Trend zu einem wärmeren Klima ist ungebrochen" (?)
en German DWD Weather Services Own Data Contradict Its Alarmist Claims Of "Uninterrupted Warming" - en No global warming for 18 years 9 months
- de Deutschland Temperaturen 2015
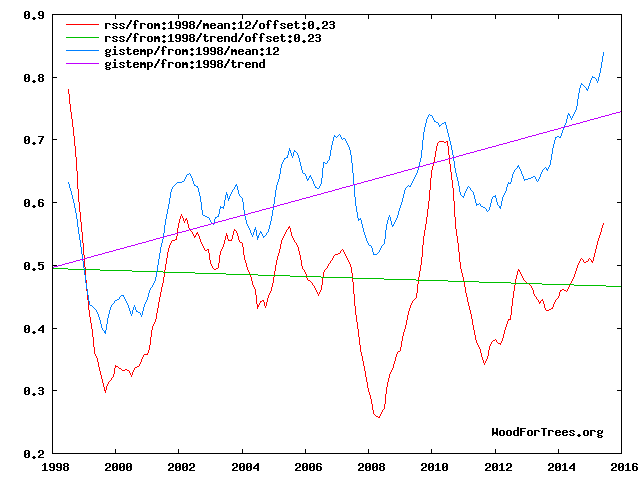
- en WoodForTrees.org 1985-2015
- 2014
- de
Erwärmungspause seit 1998
en Hiatus in Global Warming since 1998 - en
100 Year Snow Records broken across the South Eastern US on October
31st and November 01st
2015-2035 Mini Ice Age
Agricultural Losses 2014 from Cold Temperatures - 2012
- de
Globale Temperatur seit 16 Jahren nicht mehr angestiegen
en Global warming stopped 16 years ago - de Langfristiger Abkühlungstrend Nordeuropas über die letzten Jahrtausende
- de
Klaus-Eckart Puls:
G l o b a l C o o l i n g : Wo bleibt die Erderwärmung
en "Goodbye Warming - Hello Cooling"
⇧ Welt-Info
⇧ de Allgemein en General fr Générale
Topics

![]()
![]() ▶Globale Absoluttemperaturen 2014-2018 [WMO Genf]
▶Globale Absoluttemperaturen 2014-2018 [WMO Genf]

![]()
![]() ▶Not a Single Environmental Prediction of the Last 50 Years
Has Come True
▶Not a Single Environmental Prediction of the Last 50 Years
Has Come True

de Panik-Küche en Panic laboratory fr Marmite alarmiste
-
Wikipedia
de
Pause der globalen Erwärmung
en Global warming hiatus
fr -
| de |
▶ Internet-Terror: Manipulation von Wikipedia durch einen Administrator ▶ Das Lexikon der Lügen ▶ Vom Onlinelexikon zur Propagandamaschine: Zensur, Einschüchterung und arglistige Täuschung ▶ Wikipedia: Klima-Fälscher Connolley: Der Mann, der unser Weltbild umschrieb ▶Die dunkle Seite von WIKIPEDIA: EIKE Zensur - kurz und knapp [Who is who (Skeptische Institute): EIKE; Wikipedia: Websites, Opfer: EIKE, Manipulatoren: Andol] |
|||||
|---|---|---|---|---|---|---|
| en |
▶ At Wikipedia, one man engineers the debate on global warmingator |
|||||
| fr |
▶ A Wikipedia, un homme dirige le débat sur le réchauffement climatique et à sa manière |
| de | en | fr |
|---|---|---|
|
Klima: Diskussion Aussagen Klima Skandal: Evaluation Aussagen |
Climate change: Discussion Declarations Climate Scandal: Evaluation Declarations |
Climat: Discussion Déclarations Scandale: Évaluations Déclarations |
| de | en | fr |
|---|---|---|
|
Neue Kälteperiode Kaltzeit |
New Cold Period Cold Period |
Nouvelle periode froide Periode froide |
| Voraussagen | Predictions | Prédictions |
| Kälte: Warnungen | Cooling: Warnings | Refroidissement: Avertissements |
| Erwärmung: Entwarnung | Warming: All-Clear | Réchauffement: Fin de l'alerte |
| Eiszeiten | Ice Ages | Glaciations |
| de | en | fr |
|---|---|---|
|
Klimawandel: Probleme Prognosen und deren Probleme |
Climate change: Problems Predictions and their problems |
Climat: Problèmes Prédictions et leurs difficultées |
| de | en | fr |
|---|---|---|
| Das CO2 steigt und die Temperaturen fallen | CO2 is rising and the temperatures are falling | Le CO2 monte et les températures baissent |
⇧ de Text en Text fr Texte
⇧ 2023
↑
NOAA makes it official
Last 8 years... global cooling... at a rate of 0.11°C/decade....
despite 450+ billion tons of emissions worth 14% of total
manmade CO2 in the atmosphere.
![]()
![]()

↑ Siebt-wärmstes Jahr 2022: Erwärmung verlangsamt sich
-
EIKE Europäisches Institut für Klima und Energie
Javier Vinós
2023-01-10 de Siebt-wärmstes Jahr 2022: Erwärmung verlangsamt sich
↑ Globale Erwärmung wird eine Pause einlegen
-
Klimanachrichten / Vahrenholts Newsletter
2023-01-07 de Globale Erwärmung wird eine Pause einlegen
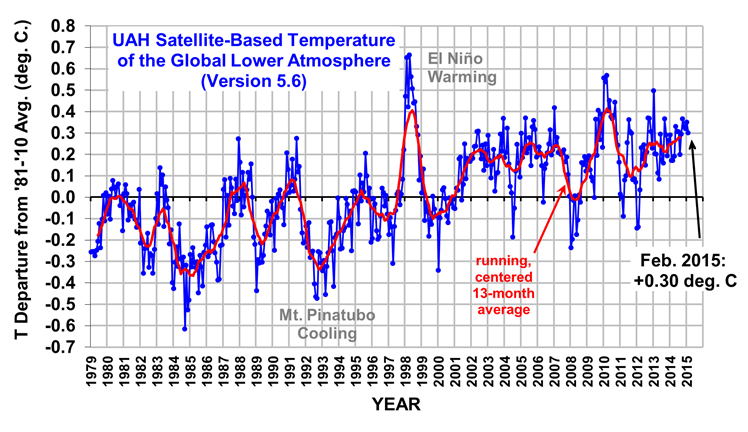
 Satellitengestützten Messungen der University of Alabama (UAH)
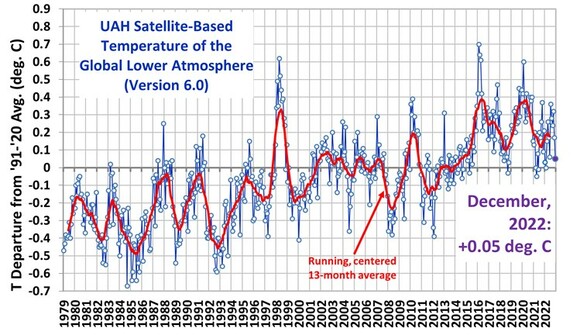
Bildet man den Durchschnitt der letzten Jahre,
so ist die globale Temperatur seit 8 Jahren und 4 Monaten konstant.
Im Dezember ist die Abweichung der globalen Temperatur
vom 30-jährigen Mittel der satellitengestützten Messungen
der University of Alabama (UAH)erneut gesunken und zwar auf 0,05 Grad Celsius. (siehe Grafik oben).
Zwar gibt es bis 2015 eine langjährige Temperatursteigerung.
Aber sie beträgt im Durchschnitt pro Jahrzehnt seit 1979 lediglich 0,13 Grad Celsius.
[also 13 tausendstel Grad pro Jahr, während den letzten 43 Jahren !]
Aber es kommt noch besser:
neueste wissenschaftliche Untersuchungen zeigen für Europa,
dass es erst einmal 15-20 Jahre leicht bergab gehen wird.
Studie in "Nature": Nord-Atlantik kühlt sich ab
Es sind klimawissenschaftliche Schwergewichte, die kürzlich im Nature Journal "climate and atmospheric science" Aufsehen erregten.
Katja Matthes, Direktorin des GEOMAR Helmholtz-Zentrums für Ozeanforschung in Kiel,
Johann Jungclaus vom Max-Planck Institut für Meteorologie in Hamburg
und Nour-Eddine Omrani vom norwegischen Bjerknes centre for climate research
veröffentlichten eine Untersuchung, die zeigt, dass wir
vor einer Abschwächung der Nordatlantischen Oszillation,
einer Abkühlung des Nord- Atlantiks
und damit verbunden einer globalen Temperaturentwicklung wie zwischen 1950 und 1970 stehen
( so die Autoren in ihrer Zusammenfassung).
npj Climate and Atmospheric Science volume
2022-07-13 en Coupled stratosphere-troposphere-Atlantic multidecadal oscillation and its importance for near-future climate projectionThis coupled variability improves the performance of statistical models, which project further weakening of North Atlantic Oscillation, North Atlantic cooling and hiatus in wintertime North Atlantic-Arctic sea-ice and global surface temperature just like the 1950s1970s.
Die Grafik zeigt den Rückgang der Temperaturen des Nordatlantiks bis 2040.
Wegen des globalen Erwärmungstrends fallen die Temperaturen nicht wieder auf das Niveau der Jahre 1950 bis 1970 zurück, erläutert einer der Autoren, Eddine Omrani.
Die zu erwartende Erwärmungspause gibt uns Zeit - so Omrani-, um technische, politische und ökonomische Lösungen zu erarbeiten
vor der nächsten Erwärmungsphase, die etwa ab 2050 wieder Oberhand gewinnt.
Die Grafik zeigt den Rückgang der Temperaturen des Nordatlantiks
bis 2040.
Die nächste Erwärmungsphase wird erst ab 2050 wieder Oberhand gewinnen.

Die Veröffentlichung der Klimaforscher aus Kiel, Hamburg, Bergen, Venedig und Houston bringt uns eine weitere wichtige Erkenntnis.
Die Erwärmung der Jahre 1980 bis 2015 war massgeblich von der warmen Phase des Atlantiks geprägt.
Wir können abschätzen, dass ein bedeutender Teil der Erwärmung diesem natürlichen Zyklus zuzuschreiben ist.
Dieser Zeitraum wird aber u.a. zugrundegelegt um Temperaturprognosen in die Zukunft vorzunehmen.
Die Modelle schlagen aber den natürlichen Erwärmungsbeitrag dem CO₂-Effekt zu.
Dieser falsch berechnete, höhere CO₂-Effekt wird in die Zukunft fortgeschrieben.
Modelle, die die natürlichen zyklischen Einflüsse nicht berücksichtigen - und das können die Modelle noch nicht - kommen so zu viel zu starken Erwärmungsprognosen.
Es soll nicht unerwähnt bleiben, dass es eine Vielzahl von Veröffentlichungen gibt (etwa diese, an der Matthes und Omrani beteiligt waren, Solar forcing synchronizes decadal North Atlantic climate variability), die eine Kopplung der Stärke der Solarzyklen mit der Nordatlantischen Oszillation für wahrscheinlich halten.
Nature Communications
2015-09-15 en Solar forcing synchronizes decadal North Atlantic climate variabilityDer letzte Solarzyklus von 2008 bis 2019 war der schwächste seit 100 Jahren.
Der augenblickliche Zyklus entwickelt sich bislang genauso schwach.
Die Eindimensionalität der Klima- und Energiedebatte, die darin gipfelt,
dass allein die CO₂-Emissionen unsere Klima bestimmen, ist schon erschreckend.
▶Voraussagen einer neuen Kälteperiode
Mit folgendem Link wird von anderen Webseiten auf diese Seite verwiesen.
▶ Globale Erwärmung wird eine Pause einlegen
neueste wissenschaftliche Untersuchungen zeigen für Europa,
dass es erst einmal 15-20 Jahre leicht bergab gehen wird.
Fritz Vahrenholt / Vaherholts Newsletter (2023-01-07)
⇧ 2019
↑
Phänologie: Pflanzen bestätigen Erwärmungs-Hiatus zu Beginn des
21. Jahrhunderts
en
No trends in spring and autumn phenology during the global
warming hiatus
Slowdown in Earth's Temps Stabilized
Nature's Calendar
-
Die kalte Sonne (Fritz Vahrenholt & Sebastian Lüning)
2019-07-06 de Phänologie: Pflanzen bestätigen Erwärmungs-Hiatus zu Beginn des 21. Jahrhunderts1: Zwischen 1998 und 2015 gab es ein Jahrzehnt, in dem die Temperaturen nicht weiter anstiegen.
Die Zeit wurde in der Fachwelt auch "Hiatus" genannt (Abb. 1) und war Thema zahlreicher Fachpublikationen.

2: Erst der El Nino 2015/16 brachte dann wieder eine Erwärmung.
Seit der El Nino-Spitze sacken die Temperaturen aber wieder ab (Abb. 2).

Phänologen haben den Hiatus jetzt auch in den Blühzeiten der Pflanzen nachgewiesen.
In der Zeit der Erwärmungspause veränderten sich die Blühzeiten kaum, wie eine Studie von Xufeng Wang und Kollegen dokumentiert, die am 3. Juni 2019 in Nature Communications erschien.
Hier der dazugehörige Abstract:
-
Nature Communications
2019-06-03 de No trends in spring and autumn phenology during the global warming hiatusNo trends in spring and autumn phenology during the global warming hiatus
Phenology plays a fundamental role in regulating photosynthesis, evapotranspiration, and surface energy fluxes and is sensitive to climate change.
The global mean surface air temperature data indicate a global warming hiatus between 1998 and 2012, while its impacts on global phenology remains unclear.
Here we use long-term satellite and FLUXNET records to examine phenology trends in the northern hemisphere before and during the warming hiatus.
Our results based on the satellite record show that the phenology change rate slowed down during the warming hiatus.
The analysis of the long-term FLUXNET measurements, mainly within the warming hiatus, shows that there were no widespread advancing (or delaying) trends in spring (or autumn) phenology.
The lack of widespread phenology trends partly led to the lack of widespread trends in spring and autumn carbon fluxes.
Our findings have significant implications for understanding the responses of phenology to climate change and the climate-carbon feedbacks.
Die University of New Hampshire (UNH) gab dazu die folgende Pressemitteilung heraus:
-
University of New Hampshire
2019-06-03 de NUNH Researchers Find Slowdown in Earth's Temps Stabilized Nature's CalendarSometimes referred to as nature's calendar,
phenology looks at the seasonal life cycle of plants and animals and is one of the leading indicators of climate change.
It's the observance of natural occurrences like the first formation of buds and flowers in the spring and the changing colors of leaves in the fall.
According to researchers at the University of New Hampshire, when the rate of the Earth's air temperature slows down for a significant amount of time, so can phenology.
|
|
Phänologie: Pflanzen bestätigen Erwärmungs-Hiatus zu Beginn des 21. Jahrhunderts Die Erwärmungspause: Pflanzen bestätigen Erwärmungs-Hiatus zu Beginn des 21. Jahrhunderts |
↑ en Sven Plöger und das 5-fache Motiv ein Grad Celsius aus dem Treibhauseffekt verschwinden zu lassen !!
![]()
![]() ▶Globale Absoluttemperaturen 2014-2018 [WMO Genf]
▶Globale Absoluttemperaturen 2014-2018 [WMO Genf]
Heftig !! Sven Plöger lässt in der WDR-Sendung "Ihre Meinung" als er den Treibhauseffekt erklärt, 1°C verschwinden.
Denn wir wissen, dass Sven Plöger in Vergangenheit andere Werte vertreten hatte, was wir in diesem Video öffentlich machen und auch das Motiv erklären, warum Sven Plöger 1°C hat "verschwinden" lassen.
Denn Sven Plöger will "retuschieren", dass ein Temperaturwert von 15°C aus dem natürlichen Treibhauseffekt keine gefährliche Erdwärmung ausweist, wenn der jährliche globale Absoluttemperaturwert den Wert von 15°C nicht überschreitet...
-
EIKE Europäisches Institut für Klima und Energie
Rainer Hoffmann
2019-04-29 de Sven Plöger und das 5-fache Motiv ein Grad Celsius aus dem Treibhauseffekt verschwinden zu lassen !!
-
Das Klimamanifest von Heiligenroth
2019-04-25 de Es war VORSATZ(!), als Sven Plöger (@DasErste) am 11.04.2019 im @WDR ein Grad Celsius aus dem #Treibhauseffekt verschwinden liess!!

↑ en Not a Single Environmental Prediction of the Last 50 Years Has Come True
![]()
![]() ▶Not a Single Environmental Prediction of the Last 50 Years
Has Come True
▶Not a Single Environmental Prediction of the Last 50 Years
Has Come True
-
Watts UP With That? (Anthony Watts) / Nicolas Loris, Bangor Daily News
2019-04-22 en Earth Day: Not a Single Environmental Prediction of the Last 50 Years Has Come TrueWe should be thankful that the gloom-and-doom predictions made throughout the past several decades havent come true.
Fear-mongering about
explosive population growth,
food crises
and the imminent depletion of natural resources
have been a staple of Earth Day events since 1970.
And the common thread among them is that they've stirred up a lot more emotions than facts.
↑ en Planet-Sized Experiments - we've already done the 2°C test
![]()
![]() ▶ Planet-Sized Experiments -
we've already done the 2°C test
▶ Planet-Sized Experiments -
we've already done the 2°C test

-
Watts UP With That? (Antony Watts) / Willis Eschenbach
2019-03-17 en Planet-Sized Experiments - we've already done the 2°C test
Berkeley Earth average European temperature, 1743 - 2013
Red/yellow line is an 8-year Gaussian average.
Horizontal red and blue lines are 2°C apart.
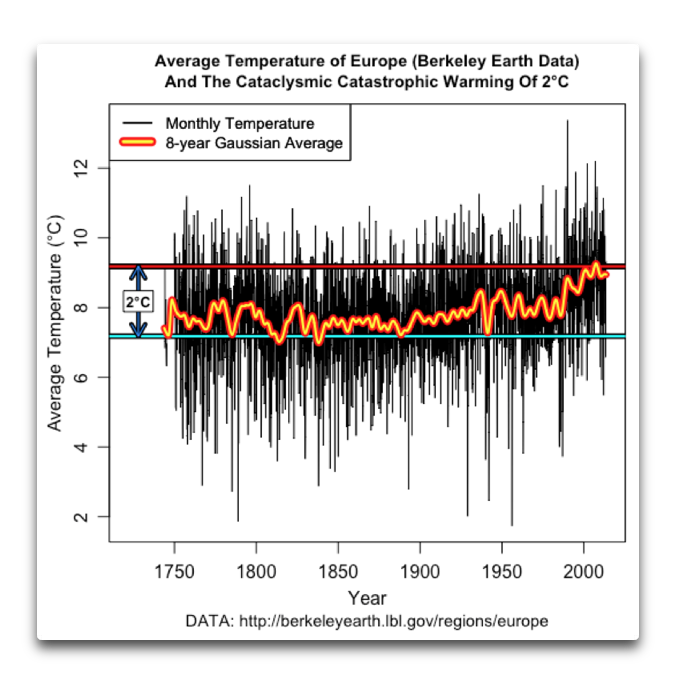
People often say that we're heading into the unknown with regards to CO2 and the planet.
They say we can't know, for example, what a 2°C warming will do because we can't do the experiment.
This is seen as important because
for unknown reasons, people have battened on to "2°C" as being the scary temperature rise
that we're told we have to avoid at all costs.
But actually, as it turns out, we have already done the experiment.
Below I show the Berkeley Earth average surface temperature record for Europe.
Europe is a good location to analyze, because some of the longest continuous temperature records are from Europe.
In addition, there are a lot of stations in Europe that have been taking record for a long time.
This gives us lots of good data.
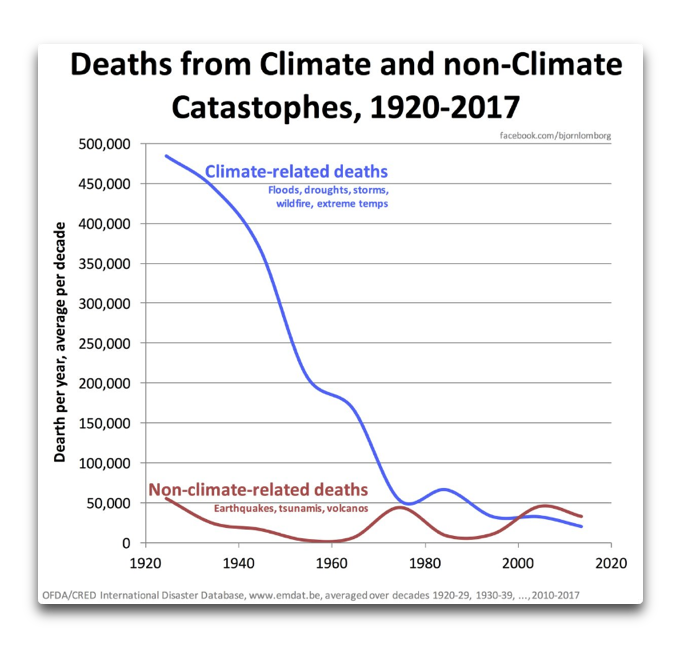
Average annual climate-related (blue line)
and non-climate-related (red line) deaths in natural disasters
 Results of the UN "My World" poll. Further analytic data

|
|
Planet-Sized Experiments - we've already done the 2°C test |
⇧ 2018
↑ Klimasensitivität - Wer rechnet hier falsch ?
-
EIKE Europäisches Institut für Klima und Energie
Dr. D.E. Koelle
2018-12-17 de Klimasensitivität - Wer rechnet hier falsch?Der IPCC basiert seine Hypothese der Klimasensitivität immer noch auf der alten Charney-Studie von 1979:
Eine CO2-Verdoppelung soll demnach einen Temperaturanstieg um 3°C bewirken.
Diese Annahme wird auch bei den Klimamodellen verwendet.
Neuere Studienergebnisse zu diesem Thema mit einem wesentlich geringeren Anstieg
wurden vom IPCC ignoriert.
Wie auch jüngst wieder durch PIK Professor Anders Levermann beim öffentlichen Fachgespräch im Umweltausschuss des Deutschen Bundestages am 28.11.18.
Doch auch Prof. Marotzke (MPI) gab kürzlich zu, dass die bisherige Annahme offenbar zu hoch ist.
Dies wird durch den Vergleich des berechneten Temperaturanstieges mit der Realität der letzten 20 Jahre bestätigt.
Bis heute konnte der angebliche CO2-Effekt auf die Globaltemperatur nicht durch historische Fakten belegt werden,
sondern ist laut IPCC-Bericht eine Sache von "confidence", d.h. von Glauben oder Vertrauen.
Die Milchmädchen-Rechnung, die Klima-Politiker, Journalisten und etliche Klimatologen nicht machen können oder wollen, lautet wie folgt:
Bis zur Verdoppelung des CO2-Gehaltes von heute 400 auf 800 ppm vergehen bei den aktuellen Emissionen mit einem Anstieg von ca. 2 ppm pro Jahr noch 200 Jahre.
Das bedeutet real in 100 Jahren ca. + 1,5°C - genau das, was sich Politiker bei der Pariser Konferenz so vorgestellt haben, aber ohne kostspielige und risikoreiche CO2-Verminderungsmaßnahmen.
Das international anerkannte Modtran-Programm der Atmosphärenphysik
zeigt zwischen 400 und 800 ppm einen Temperaturanstieg von nur 1,7°C (anstelle von den 3°C des IPCC) mit Berücksichtigung des Sättigungseffektes, der ansonsten oft ignoriert wird.
Das wäre dann in 100 Jahren nur ein Anstieg um ca. +0,85°C.

Tatsächlich ist aber kein weiterer Anstieg der mittleren Globaltemperatur zu erwarten, sondern das Gegenteil:
sie wird in den nächsten 400 Jahren aller Wahrscheinlichkeit nach wieder um ca. 1,5°C absinken
- so, wie dies schon seit 8000 Jahren regelmäßig alle 1000 Jahre der Fall war,
zuletzt in der mittelalterlichen Kaltzeit (auch " Little Ice Age" genannt).
Dieser natürliche Klimazyklus basiert auf solaren und astrophysikalischen Faktoren und kann von Menschen nicht beeinflusst werden - genauso wenig wie andere Natur-Ereignisse wie Erdbeben und Vulkanausbrüche.
↑ en Secrets about the 1.5°C world temperature limit
-
Fabius Maximus website / Larry Kummer
2018-11-09 en Secrets about the 1.5°C world temperature limitThere has been a daily drumbeat of dark climate news to accompany the IPCCs new report, "Global Warming of 1.5 °C."
Millions of people are terrified that climate change will wreck or destroy the world.
Here is some information they probably do not know, because journalists do not mention it.
-
Frontiers / Sebastian Lüning and Fritz Vahrenholt
2017-12-12 de Paleoclimatological Context and Reference Level of the 2°C and 1.5°C Paris Agreement Long-Term Temperature LimitsThe Paris Agreement adopted in December 2015 during the COP21 conference stipulates that the increase in the global average temperature is to be kept well below 2°C above "pre-industrial levels" and that efforts are pursued to limit the temperature increase to 1.5°C above "pre-industrial levels."
In order to further increase public acceptance of these limits it is important to transparently place the target levels and their baselines in a paleoclimatic context of
the past 150,000 years (Last Interglacial, LIG)
and in particular of the last 10,000 years (Holocene; Present Interglacial, PIG).
Intense paleoclimatological research of the past decade has firmed up that pre-industrial temperatures have been highly variable which needs to be reflected in the pre-industrial climate baseline definitions.
The currently used reference level 1850-1900 represents the end of the Little Ice Age (LIA).
The LIA represents the coldest phase of the last 10,000 years when mean temperatures deviated strongly negatively from the Holocene average and which therefore are hard to justify as a representative pre-industrial baseline.
The temperature level reached during the interval 1940-1970 may serve as a better reference level as it appears to roughly correspond to the average pre-industrial temperature of the past two millennia.
Placing the climate limits in an enlarged paleoclimatic context will help to demonstrate that the chosen climate targets are valid and represent dangerous extremes of the known natural range of Holocene temperature variability.
| Studie | Lüning, S., F. Vahrenholt (2017) |
|---|---|
| Paleoclimatological context and reference level of the 2°C and 1.5°C Paris Agreement long-term temperature limits. | |
|
Frontiers in Earth Science, 12 December 2017, doi: 10.3389/feart.2017.00104 |
Dieser Literaturhinweis wurde mit dem ganzen Litreraturverzeichnis von Dr. Sebastian Lüning in Wikipedia gelöscht:
▶Wikipedia-Deckname 'Neudabei':
Er kam des nachts und löschte aus Ärger einfach das
Literaturverzeichnis
[Who is who (Skeptiker):
Sebastian Lüning;
Wikipedia:
Websites,
Opfer:
Lüning,
Manipulatoren:
Neudabei]
-
Die kalte Sonne (Fritz Vahrenholt & Sebastian Lüning)
2017-12-20 de Neue Studie setzt die 1,5°C und 2,0°C Temperaturziele des Pariser Klimavertrags in einen historischen KontextAm 12. Dezember 2017 erschien im Fachblatt 'frontiers in Earth Science' eine Arbeit von Sebastian Lüning und Fritz Vahrenholt zum paläoklimatischen Kontext der Pariser 1,5°C und 2,0°C Klimaziele.
Die Publikation ist dort kostenfrei als pdf herunterladbar.
Zu der Arbeit gaben die Autoren die folgende Pressemitteilung heraus (deutsche Version weiter unten):
Press release issued: 13 December 2017
New study puts the 1.5°C and 2.0°C temperature limits of the Paris Agreement into a historical climate context
The Paris Agreement adopted in December 2015 during the COP21 climate conference stipulates that the increase in the global average temperature is to be kept well below 2°C above "pre-industrial levels" and that efforts are pursued to limit the temperature increase to 1.5°C above "pre-industrial levels."
Closer inspection of the treaty text, however, reveals that the term "pre-industrial levels" is nowhere defined in this epochal UN-document, that has meanwhile been ratified by 170 Parties.
This is particularly odd because the "pre-industrial" temperatures of the past 10,000 years have varied quite significantly, as meticuloulsy documented by hundreds of paleoclimate studies.
Puzzled by this apparent gap in the Agreement, Fritz Vahrenholt went out and researched the history of the temperature limit definition.
The former renewable energy manager and current head of the German Wildlife Foundation was surprised to find that the initial description of this important climate goal dates back to the mid 1970s, proposed by an economist, by the name of William Nordhaus.
Nordhaus' idea was as simple as effective:
He looked at the maximum temperatures recorded during the past several hundred thousand years and warned that this natural range should not be exceeded in the future.
Two decades later, in 1995, the German Advisory Council for Global Change further refined this concept, but kept Nordhaus' original idea of a tolerable 'temperature window'.
Vahrenholt:
"Unfortunately this important palaeoclimatological perspective was lost in subsequent key papers on the subject that paved the way to the Paris Agreement.
Reports by the World Bank and United Nations Framework Convention on Climate Change (UNFCCC) in 2014 and 2015 narrowed their view to the last 200 years which does not do justice to the enormous natural temperature fluctuations on a multi-millennial perspective."
In order to better understand the complex pre-industrial temperature history of the past, Vahrenholt teamed up with Sebastian Lüning, a professional resources geologist who in his sparetime works on paleoclimatological studies with the Switzerland-based Institute for Hydrography, Geoecology and Climate Sciences.
Lüning researched the literature and integrated the Paris Agreement 2.0°C and 1.5°C temperature limits into the climate development of the past 2000, 10,000 and 120,000 years.
Lüning:
"Comparing the modern warming to reference levels at the end of the Little Ice Age about 150 years ago does not really make much sense because this period represents one of the coldest times of the past 10,000 years.
The choice of a baseline near the lower extreme of a variable parameter is uncommon in science.
The temperature level that was reached during the interval 1940-1970 may serve as a better reference level because it appears to roughly correspond to the average pre-industrial temperature of the past two millennia."
On an even longer time scale, it is found that current temperatures have not yet even exceeded the warmest temperatures of a natural warm phase that globally occurred some 7000 years ago, the so-called 'Holocene Thermal Maximum'.
Global temperatures may have even partly exceeded the 1.5°C limit during this warm phase, when combined land and sea surface temperatures are taken into account.
The increase in this natural temperature window and the baseline shift potentially enlarges the headroom for the 1.5°C temperature limit of the Paris Agreement which deserves further study.
...
-
EIKE Europäisches Institut für Klima und Energie
2017-12-15 de Neue Studie stellt die Temperaturgrenzen von 1,5°C bzw. 2°C des Paris-Abkommens in einen histori-schen Klima-ZusammenhangAnmerkung der Redaktion.
Die Autoren Lüning und Vahrenholt bemängeln in ihrer Studie bei den Pariser Klimabeschlüssen zu Recht das Fehlen einer exakten Vergleichsbasis für die dort definierten zulässige Temperatur-Erhöhungen, die aber trotzdem mit einer Genauigkeit von 1/10nbsp;°C (2,0 bzw 1,5nbsp;°C) beziffert werden und die auch bestimmt werden sollen.
Das mag hohe Politik sein, Wissenschaft ist es nicht.
Wissenschaftlich ist es Unsinn.
Diese Wissenschaft wieder zu etablieren, ist das Ziel der Autoren.
Dabei konzentrieren sie sich nur auf diesen einen offensichtlichen Mangel, weitere schwere Mängel wie z.B. den, dass eine mittlere Temperatur der Erdatmosphäre in der Realität nicht existiert, lassen sie außen vor.
Wir vermuten, dass das deshalb geschah, um die Studie überhaupt veröffentlicht zu bekommen.
Trotzdem ist die Studie lesenswert.
Jeder mag seine eigenen Schlussfolgerungen ziehen.
Presseerklärung vom 13. Dezember 2017
Bei dem Pariser Klima-Abkommen vom Dezember 2015 wurde vereinbart, dass die Zunahme der globalen mittleren Temperatur auf deutlich unter 2°C verglichen mit dem "vorindustriellen Niveau" begrenzt werden muss und dass man sich bemühen sollte, den Anstieg auf 1,5°C zu begrenzen.
Eine genauere Betrachtung des Vertrags-Wortlautes enthüllt jedoch, dass der Terminus "vorindustrielles Niveau" nirgendwo in diesem epochalen UN-Dokument definiert ist, welches mittlerweile von 170 teilnehmenden Parteien ratifiziert worden ist.
Dies ist besonders komisch, weil die "vorindustriellen" Temperaturen der letzten 10.000 Jahren signifikante Variationen durchlaufen haben, wie akribisch dokumentiert in hunderten paläoklimatischer Studien.
Verwirrt durch diese klaffende Lücke im Abkommen machte sich Fritz Vahrenholt daran, die Historie der Definition zum Temperaturlimit zu ergründen.
Der ehemalige Manager erneuerbarer Energie und derzeit Leiter der German Wildlife Foundation fand zu seiner Überraschung heraus, dass die ursprüngliche Beschreibung dieses bedeutenden Klimaziels von Mitte der siebziger Jahre stammt und von einem Ökonom namens William Nordhaus ins Spiel gebracht worden ist.
Nordhaus' Gedanke war ebenso einfach wie effektiv:
Er betrachtete die Höchstwerte der Temperatur der letzten paar hunderttausend Jahre und warnte, dass die dabei zutage getretene natürliche Bandbreite in Zukunft nicht überschritten werden darf.
Zwei Jahrzehnte danach, nämlich im Jahre 1995 überarbeitete der Wissenschaftliche Beirat Globale Umweltveränderungen WBGU dieses Konzept, behielt aber den ursprünglichen Gedanken eines tolerierbaren "Temperatur-Fensters" von Nordhaus bei.
Vahrenholt:
"Unglücklicherweise ist diese wichtige paläoklimatische Perspektive in nachfolgenden grundlegenden Studien, welche den Weg nach Paris bereitet hatten, verloren gegangen.
In Berichten der Weltbank und des United Nations Framework Convention on Climate Change (UNFCCC) aus den Jahren 2014 und 2015 wurde der historische Zeitraum auf die letzten 200 Jahre eingeengt, welche den enormen natürlichen Temperatur-Fluktuationen im Zeitmaßstab von Jahrtausenden nicht gerecht wird".
Um die komplexe präindustrielle Temperatur-Historie besser zu verstehen tat er sich mit Sebastian Lüning zusammen, einem professionellen Ressourcen-Geologen, der in seiner Freizeit an paläoklimatischen Studien arbeitet am in der Schweiz ansässigen Institute for Hydrography, Geoecology and Climate Sciences.
Lüning durchforstete die Literatur und integrierte die Temperaturgrenzen von 2,0°C bzw. 1,5°C in die Klimaentwicklung der letzten 2000, 10.000 und 200.000 Jahre.
Lüning:
"Der Vergleich der derzeitigen Erwärmung mit dem Referenz-Niveau am Ende der Kleinen Eiszeit vor etwa 150 Jahren ist wenig sinnvoll, weil diese Zeit eine der kältesten Epochen der letzten 10.000 Jahre repräsentiert.
Die Auswahl eines Parameters als Grundlinie nahe dem untersten Extrem eines variablen Parameters ist in der Wissenschaft unüblich.
Das Temperaturniveau des Zeitraumes von 1940 bis 1970 wäre ein viel besser geeignetes Referenz-Niveau, weil es in etwa mit dem mittleren vorindustriellen Temperaturniveau der letzten beiden Jahrtausende korrespondiert".
In einem sogar noch längeren Zeitmaßstab stellte sich heraus, dass die Temperatur gegenwärtig noch nicht einmal über die höchsten Temperaturen einer natürlichen Warmphase hinausgegangen sind, dem "Thermalen Maximum des Holozäns" vor etwa 7000 Jahren.
Die globalen Temperaturen können während jener Warmphase gut über das Limit von 1,5°C hinaus gegangen sein, wenn man Land- und Wassertemperatur zusammen in Betracht zieht.
Die Zunahme dieses natürlichen Temperatur-Fensters und die Verschiebung der Grundlinie vergrößert die Obergrenze des 1,5°C-Limits und muss weiter untersucht werden.
...
|
|
Secrets about the 1.5°C world temperature limit Die Erfindung des 2-Grad-Zieles Wissenschaftliche Debatte zur Aufklärung Manipulation und Terror von Wikipedia: Mainstream vs. Wissenschaft |
↑ Der September zeigt seit über 100 Jahren keine Erwärmung. Wo bleibt die Wirkung der Treibhausgase?
![]()
![]()

-
EIKE Europäisches Institut für Klima und Energie
Josef Kowatsch
2018-10-04 de Der September zeigt seit über 100 Jahren keine Erwärmung. Wo bleibt die Wirkung der Treibhausgase?Eine sich fortsetzende und aufschaukelnde Klimaerwärmung aufgrund des anthropogenen CO2-Ausstoßes ist die irrige Behauptung der Erwärmungswissenschaftler, die in Deutschland laufend die Medien füttern, um die Bevölkerung zu ängstigen.
Richtig bei dieser Aussage ist lediglich, dass die CO2-Konzentration in den letzten 50 Jahren angestiegen ist, und zwar von 0,03 % = 300 ppm auf 400 ppm.
Das bedeutet aber auch: 99,96 % der Luft bestehen immer noch aus anderen Gasen.
Und Kohlendioxid ist kein Giftgas, sondern lebensnotwendig für das Leben auf der Erde.
Es ist physikalisch unmöglich, dass ein Gas wie CO2 in den Sommermonaten in Deutschland erwärmend und im September abkühlend wirkt.
Gesamtergebnis: Es wird höchste Zeit, dass die CO2-Erwärmungsirrlehre zu den Akten gelegt wird und weltweit eine neue Umweltschutzethik entsteht.
Sauberes Wasser, saubere Luft und saubere Nahrungsmittel gleichmäßig verteilt, wären ein gemeinsames ethisches Ziel, das die Menschheit anstreben sollte.
Der angebliche Klimaschutz ist ein raffiniertes Geschäftsmodell.
|
|

↑ Klimawandel in Österreich: So veränderte sich die Temperatur
-
Die kalte Sonne (Fritz Vahrenholt & Sebastian Lüning)
2018-09-18 de Klimawandel in Österreich: So veränderte sich die TemperaturEin Hauptmerkmal des Klimawandels sind Veränderungen der Jahresdurchschnittstemperatur.
Die instrumentell gemessenen Temperaturen Österreichs liegen für die letzten 250 Jahre vor, wobei sich das Messnetz erst im Laufe des 20. Jahrhunderts signifikant verdichtete.
Die darüber hinausreichende Temperaturgeschichte Österreichs wurde in Fallstudien für die vergangenen 10.000 Jahre anhand von Höhlentropfsteinen, Seensedimenten und Baumringen rekonstruiert.
Letzte 30 Jahre
Die Jahresdurchschnittstemperaturen haben sich in Österreich während der vergangenen 30 Jahre um mehr als ein halbes Grad erhöht.
Allerdings schwankten die Temperaturen von Jahr zu Jahr um bis zu 2 Grad.
Entwicklung der Jahresdurchschnittstemperaturen in Österreich
während der vergangenen 30 Jahre (1988-2017)

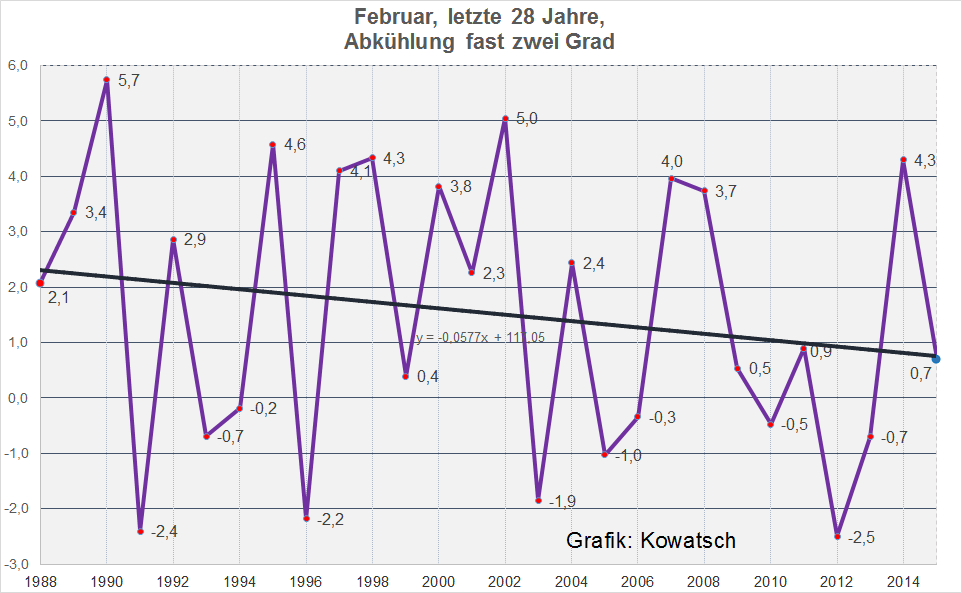
Februartemperaturen während der vergangenen 30 Jahre (1986-2015)
Interessanterweise läuft die Erwärmung nicht in allen Jahreszeiten und Monaten gleichmäßig ab.
So ist die Temperatur in den Monaten Februar und Oktober während der vergangenen 30 Jahre in Österreich nicht angestiegen und blieb stabil.
Entwicklung der Februartemperaturen in Österreich während der
vergangenen 30 Jahre (1986-2015).
Die grüne Linie zeigt den linearen Trend an.

Temperaturdaten der Station Zugspitze 1946-2010 in den Versionen ZAMG/HISTALP und Deutscher Wetterdienst (DWD)
Auf der HISTALP Webseite der österreichischen Zentralanstalt für Meteorologie und Geodynamik (ZAMG) lassen sich Temperaturzeitreihen für einzelne Stationen seit Beginn der Messungen herunterladen und visualisieren.
Die Datenreihen sind "homogenisiert", das heißt, die Originalmessdaten wurden verändert, mit dem erklärten Ziel, die Werte vergleichbar zu machen.
Derartige Eingriffe sind zum Teil notwendig, jedoch nicht immer unumstritten.
Am Beispiel der deutschen Station Zugspitze in unmittelbarer Grenznähe zu Österreich wird deutlich, wie unterschiedlich die nationalen Wetterdienste mit den Messdaten umgehen.
Während die ZAMG im Rahmen des HISTALP-Programmes die Wärmejahre in den 1940er bis 60er Jahren um ein halbes Jahr händisch heruntersetzte
und damit die Erwärmungsrate zusäzlich versteilt hat,
verarbeitet der Deutsche Wetterdienst die Temperaturdaten unverändert
und kommt auf eine deutlich abgebremste Erwärmung
Vergleich der Temperaturdaten der Station Zugspitze 1946-2010
in den Versionen
ZAMG/HISTALP (blau) und Deutscher Wetterdienst (DWD, rot).

↑
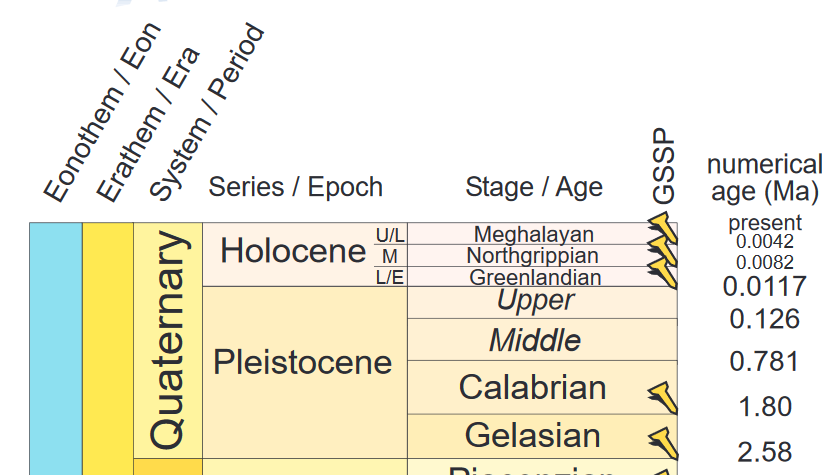
"Anthropozän" fällt bei Kommission zur Stratigraphie glatt
durch
en
Blow to warmists, the proposed 'Anthropocene epoch
has been denied by ICS
![]()
![]()
![]() INTERNATIONAL CHRONOSTRATIGRAPHIC CHART
INTERNATIONAL CHRONOSTRATIGRAPHIC CHART
Stratigraphie des Quartärs laut überarbeiteter Tabelle der
International Commission on Stratigraphy (ICS)
-
Die kalte Sonne (Fritz Vahrenholt & Sebastian Lüning)
2018-09-12 de "Anthropozän" fällt bei Kommission zur Stratigraphie glatt durchLeben wir in einer klimatisch außergewöhnlichen Zeit, die alles Vorherige in den Schatten stellt?
Dafür muss man in die klimatische Vergangenheit schauen.
Anhänger des Klimaalarmismus beschränken sich dabei auf die letzte 150 Jahre und kommen zu dem vorschnellen aber persönlich erhebenden Schluss:
Ja, wir sind Teil einer Entwicklung die es noch nie gegegben hat, und wir sind auch noch selber Schuld daran.
Wir mächtigen Menschen haben es geschafft, uns das Klima Untertan zu machen.
Wenn man jedoch den Vergleichszeitraum einige hundert und wenige tausend Jahre nach hinten erweitert, wird schnell klar, dass es stets einen Wechsel zwischen kalt und warm gegeben hat.
Es ist ernüchternd, aber auch unsere Vorfahren hatten bereits unter dem Klimawandel zu leiden bzw. profitierten teilweise auch davon.
Geologen werden speziell dafür ausgebildet, die Naturgeschichte zu dokumentieren und zu entschlüsseln.
Das hierzu benötigte Zeitgerüst heißt "Stratigraphie".
Und damit alles seine Ordnung hat, gibt es eine internationale Kommission zur Stratigraphie, die über Veränderungen im verwendeten Zeitschema wacht.
Eben diese Kommission hat sich im Juli 2018 zusammengesetzt und darüber diskutiert, wie man die letzten 12.000 Jahre (das sogenannte Holozän) am sinnvollsten gliedert.
Vertreter der harte Klimalinie hatten gefordert, die letzten 150 Jahre als "Anthropozän" zu bezeichnen.
Dieser Vorschlag wurde jetzt vom Gremium klar abgelehnt.
Stattdessen unterteilte man das Holozän in drei Stufen.
Oberes Holozän: Meghalayan (4200 Jahre vor heute bis heute)
Mittleres Holozän: Northgrippian (8200 bis 4200 Jahre vor heute)
Unteres Holozän: Greenlandian (11.700 bis 8200 Jahre vor heute)
-
Watts UP With That? (Antony Watts)
2018-08-13 en Blow to warmists, the proposed 'Anthropocene epoch has been denied by ICSThe global body tasked with naming geological eras, the International Commission on Stratigraphy, has rejected the proposed Anthropocene epoch, the controversial 'geological' epoch in which mankind allegedly dominates natural processes.
The international commission has now rejected the proposal and has instead split the Holocene Epoch into three different geological ages, all of which were primarily shaped by natural, not human factors.
Quelle / Source:
-
International Commission on Stratigraphy
2018-07 en ICS chart containing the Quaternary and Cambrian GSSPs and new stages (v 2018/07) is now released!
↑ Wir sollten jetzt die realen und nachteiligen Folgen von Abkühlung fürchten
![]()
![]()
de
Eisbohrkernen zufolge war das letzte Jahrtausend von 1000 bis 2000
das kälteste Millenium des gegenwärtigen Interglazials.
en
According to ice core records, the last millennium 1000AD - 2000AD has
been the coldest millennium of our current Holocene interglacial.

-
EIKE Europäisches Institut für Klima und Energie
Ed Hoskins / Chris Frey
2018-09-09 de Wir sollten jetzt die realen und nachteiligen Folgen von Abkühlung fürchtenUnser gegenwärtiges warmes Interglazial hat es erst möglich gemacht, dass sich die Zivilisation der Menschheit während der letzten 10.000 Jahre entwickeln konnte - von frühesten Ackerbau-Methoden bis zu den jüngsten Technologien.
Eisbohrkernen zufolge war das letzte Jahrtausend von 1000 bis 2000 das kälteste Millenium des gegenwärtigen Interglazials.
Am deutlichsten wird dieser Umstand illustriert, wenn man die Ergebnisse aus den Eisbohrkernen im Zeitmaßstab von Jahrtausenden darstellt, und zwar zurück bis zum Zeitalter des Eemian.
-
Ice Age Now / Ed Hoskins
2018-09-01 de We should now fear the real and detrimental effects of coolingOur current, warm, interglacial has been the enabler of mankind's civilisation for the last 10,000 years, from mankind's earliest farming to the most recent technologies.
According to ice core records, the last millennium 1000AD - 2000AD has been the coldest millennium of our current Holocene interglacial.
This point is more fully illustrated with ice core records on a millennial basis back to the Eemian period here.
↑ Hamburger Forsythie muss wohl auf die schwarze Klimaleugnerliste
-
Die kalte Sonne (Fritz Vahrenholt & Sebastian Lüning)
Sebastian Lüning und Josef Kowatsch
2018-04-13 de Hamburger Forsythie muss wohl auf die schwarze KlimaleugnerlisteAm 4. April 2018 war es wieder soweit.
Auf der Hamburger Lombardsbrücke hat die Forsythie geblüht.
Und in China ist ein Sack Reis umgefallen?
Nein, die Forsythie hat eine wichtige Aufgabe inne, ihr Blühbeginn informiert nämlich über den Klimawandel.
Vereinfacht ausgedrückt:
Je früher sie blüht, desto wärmer das Klima. Das leuchtet ein.
Die Jahreszeiten verschieben sich, lesen wir allerorten in der Zeitung.Ob der Frühling wohl bald schon im Februar beginnt?
Wie viele unser Leser wissen, zeigt sich die Hamburger Forsythie gänzlich unkooperativ.
In den letzten 30 Jahren verpätet sich nämlich ihr Blühbeginn immer weiter.
Als hätte sie das Memo zur Klimakatastrophe nicht erhalten.
Sie macht das glatte Gegenteil von dem, was man erwartet hätte.
Auf Wikipedia zeigte man sich verwirrt und schrieb einfach, was man erwartet hatte, nicht was wirklich auftrat.
Wir ertappten die Aktivisten dabei, was schön peinlich war.
Mit dem 4. April blühte die Promi-Forsythie dieses Jahr besonders spät.
Nur dreimal in den letzten 30 Jahren kamen die Blüten noch später (Abb. 1).
Ganz offensichtlich war es ihr Anfang 2018 viel zu kalt, so dass sie ihre schmucken Blüten möglichst lange im warmen Inneren hielt.
| de | en | fr |
|---|---|---|
|
Neue Kälteperiode Meldungen |
New Cold Period News |
Nouvelle periode froide Actualités |
| de |
▶ Internet-Terror: Manipulation von Wikipedia durch einen Administrator ▶ Das Lexikon der Lügen ▶ Vom Onlinelexikon zur Propagandamaschine: Zensur, Einschüchterung und arglistige Täuschung ▶ Wikipedia: Klima-Fälscher Connolley: Der Mann, der unser Weltbild umschrieb ▶Die dunkle Seite von WIKIPEDIA: EIKE Zensur - kurz und knapp [Who is who (Skeptische Institute): EIKE; Wikipedia: Websites, Opfer: EIKE, Manipulatoren: Andol] |
|||||
|---|---|---|---|---|---|---|
| en |
▶ At Wikipedia, one man engineers the debate on global warmingator |
|||||
| fr |
▶ A Wikipedia, un homme dirige le débat sur le réchauffement climatique et à sa manière |
↑ en Don't Tell Anyone, But We Just Had Two Years Of Record-Breaking Global Cooling
-
Watts UP With That? (Antony Watts)
2018-05-17 en Don't Tell Anyone, But We Just Had Two Years Of Record-Breaking Global CoolingThe drop in temperatures at least merits a "Hey, what's going on here?" story.
Inconvenient Science:
NASA data show that global temperatures dropped sharply over the past two years.
Not that you'd know it, since that wasn't deemed news.
Does that make NASA a global warming denier?
↑ Die WikiManufaktur
↑ Schnee- und Temperaturtrends in den Alpen: 120 Jahre Klimageschichte rund um den Arlberg
-
Günther Aigner
2018-02-01 en
Lech-Zürs: Eine Analyse historischer Temperatur- und Schneemessreihen
Agenda:
de Deutsche Untertitel können "angeklickt" werden.
en GERMAN SUBTITLES AVAILABLE! Please find this Speech with English Subtitles in our YouTube-Channel.
-
01:25 - Zitate des Kulturpessimismus
-
06:52 - Wintertemperaturen am Galzig (und Säntis, CH)
-
14:34 - Schneemessreihen aus Lech
-
22:39 - Schneemessreihen aus Zürs
-
25:52 - Die Entwicklung der Skisaisonlängen (Tage mit Skibetrieb)
-
27:51 - Klimatische Entwicklung der Bergsommer
-
33:26 - Zusammenfassung
-
34:58 - Beantwortung der Eingangsfrage
-
35:51 - Fachlicher Austausch (Experten)
-
36:05 - Literatur und Messdaten
-
36:22 - Biografie Günther Aigner
Vortrag in der "Postgarage Lech" am 01. Februar 2018.
Der Tiroler Skitourismusforscher Günther Aigner gibt einen spannenden Überblick über mehr als 120 Jahre Klimageschichte rund um den Arlberg.
Mit Hilfe von amtlichen Messdaten geht er verschiedenen Fragen nach:
Stimmt es, dass es in Lech früher mehr geschneit hat?
Um wie viel Grad Celsius haben sich die Winter am Arlberg (Galzig) in den letzten Jahrzehnten erwärmt?
Stimmt es, dass die Skisaisonen deshalb immer kürzer werden?
Oder gibt es eine Lücke, die zwischen der öffentlicher Wahrnehmung und den amtlichen Messdaten klafft?
-
Die kalte Sonne (Fritz Vahrenholt & Sebastian Lüning)
2018-02-27 de Schnee- und Temperaturtrends in den Alpen: 120 Jahre Klimageschichte rund um den ArlbergKlimadiskussion in der Sackgasse.
Am Ende zählen nur harte Fakten, langjährige Klimareihen und der vorindustrielle Kontext, der bitte nicht erst in der Kleinen Eiszeit beginnt, sondern auch frühere Wärmephasen mit einschließt.
Der Tiroler Skitourismusforscher Günther Aigner hat dies längst erkannt und setzt sich engagiert für eine rationale Diskussion auf solider Datengrundlage ein.
In mühsamer Fleißarbeit hat er Klimadaten zu Schnee und Temperaturen in den Alpen gesammelt und in anschaulichen Abbildungen zusammengestellt.
Am 1. Februar 2018 hielt er einen sehenswerten Vortrag in der "Postgarage Lech", den sich alle Klimainteressierten und regionalen Entscheidungsträger der Alpenregion auf jeden Fall anschauen sollten:
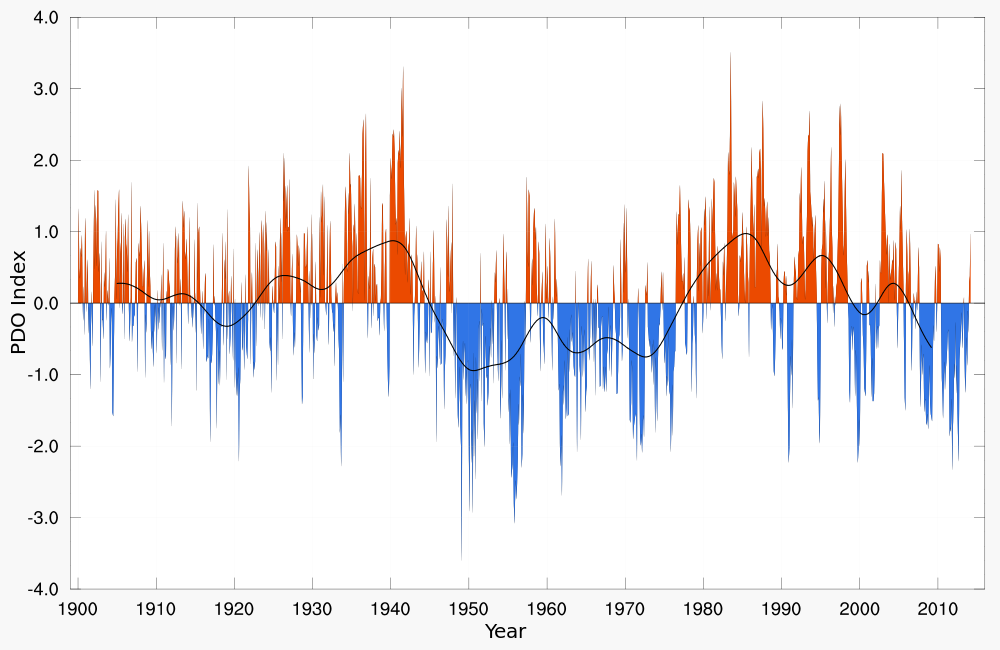
↑ Ach wie gut, dass niemand weiß, dass ich PDO heiß'
![]()
![]() Temperaturentwicklung in den USA während der Sommermonate.
Temperaturentwicklung in den USA während der Sommermonate.

Die Ähnlichkeit im Verlauf mit dem PDO-Ozeanzyklus ist frappierend
![]()
![]() Verlauf des PDO-Ozeanzyklus
Verlauf des PDO-Ozeanzyklus
-
Die kalte Sonne (Fritz Vahrenholt & Sebastian Lüning)
2018-01-28 de Ach wie gut, dass niemand weiß, dass ich PDO heiß'Die Sommertemperaturen in den USA nahmen einen unerwarteten Verlauf in den letzten 90 Jahren.
In den 1930ern waren die Sommer ziemlich heiß, zum Teil sogar heißer als heute.
Dazwischen sackten die Temperaturen jahrzehntelang ab.
Extrapoliert man den Zyklus in die Zukunft,
kann man schon ahnen, was als nächstes kommt:
Die Sommer in den USA werden wieder kälter werden.
Ein Paper von Alter et al. 2017 kommt zu einem interessanten Schluss:
Die Sommertemperaturen in den USA hatten im letzten Jahrhundert wenig mit dem CO2 zu tun.
⇧ 2017
↑
Kein neuer Rekord: Globale Mitteltemperatur 2016 erreichte lediglich
das Niveau von 1998
en
@NOAA data demonstrates that 2016 was not the 'hottest year ever'
in the USA
-
Die kalte Sonne (Fritz Vahrenholt & Sebastian Lüning)
2017-01-11 de Kein neuer Rekord: Globale Mitteltemperatur 2016 erreichte lediglich das Niveau von 1998
-
Die kalte Sonne (Fritz Vahrenholt & Sebastian Lüning)
2017-01-13 de Die ungeliebte Verlangsamung der Erwärmung: Tricksen bis der Arzt kommtMit dem neuen Temperaturrekord hat es 2016 nicht geklappt.
Trotzdem wollten Klimaaktivisten und kooperierende Journalisten zu Jahresbeginn der Bevölkerung eine scharfe Klimaermahnung mit auf den Weg geben.Da kam ihnen ein soeben veröffentlichtes Paper gerade recht:
Die Erwärmungspause ("der Hiatus") bzw. die Verlangsamung der Erwärmung ("Slowdown") der letzten 18 Jahre existiere gar nicht, alles nur Schall und Rauch.In Wahrheit sei es kräftig wärmer geworden, und zwar in den Ozeanen.
Ganz vorne bei der Berichterstattung mit dabei ist Spektrum der Wissenschaft, eine Plattform, auf der auch der Potsdamer Klimaaktivist Stefan Rahsmtorf schreibt.
Der Redaktionsleiter von spektrum.de, Daniel Lingenhöhl, erklärte den Lesern höchstpersönlich:
Klimawandel: Keine verlangsamte Erwärmung im Ozean
Während der letzten 15 Jahre sollen sich die Weltmeere nur verlangsamt erwärmt haben.
Manche sprachen sogar von einer Pause.
Doch das wurde erneut widerlegt.Daniel Lingenhöhl, Joachim Müller-Jung, Zeke Hausfather et al. kämpfen unentwegt gegen den unerwarteten Hiatus an - und machen sich dabei gänzlich lächerlich.
Was werden sie in zehn Jahren im Rückblick zu ihrem Aktivismus zu sagen haben, wenn die wahre Temperaturentwicklung bekannt sein wird?
Jede Wette, dass sie dann gar nicht mehr gerne an ihre wilde Aktivistenzeit erinnert werden wollen
-
Watts Up With That? (Antony Watts)
2017-01-19 en @NOAA data demonstrates that 2016 was not the 'hottest year ever' in the USAMuch of that "record heat" is based on interpolation of data in the Arctic, such as BEST has done.
But in reality, there's just not much data at the poles, there is no permanent thermometers at the North pole, since sea ice drifts, is unstable, and melts in the summer as it has for millennia.
Weather stations can't be permanent in the Arctic ocean.
So, the data is often interpolated from the nearest land-based thermometers.
-
Watts Up With That? (Antony Watts)
2017-01-03 en 2016 edges 1998 as warmest year in satellite record - by 0.02°C
-
Dr. Roy Spencer
2017-01-03 en Global Satellites: 2016 not Statistically Warmer than 1998The resulting 2016 annual average global temperature anomaly is +0.50 deg. C, which is (a statistically insignificant) 0.02 deg. C warmer than 1998 at +0.48 deg. C.
We estimate that 2016 would have had to be 0.10 C warmer than 1998 to be significantly different at the 95% confidence level.
Both 2016 and 1998 were strong El Nino years.
⇧ 2016
↑
Beginnt die globale Abkühlung?
Globale Mitteltemperatur stürzt um mehr als 1 °C steil ab.
en
Steepest drop in global temperature on record
![]()
![]()

-
EIKE Europäisches Institut für Klima und Energie
Michael Limburg
2016-12-01 de Beginnt die globale Abkühlung? Globale Mitteltemperatur stürzt um mehr als 1 °C steil ab.Die globale Mitteltemperatur über Land zeigt eine noch nie so gemessene steile Abkühlung von 1,2 K.
Die Medien übergehen diese dramatische Abkühlung mit Schweigen.
Setzt sie sich fort, stehen wir evtl. am Beginn einer neuen "kleinen Eiszeit".
Nichts würde ich mehr bedauern als das.
-
Watts Up With That? (Antony Watts)
2016-11-28 en Steepest drop in global temperature on record
-
Global average temperatures over land have plummeted by more than 1C
-
Comes amid mounting evidence run of record temperatures about to end
-
The fall, revealed by Nasa satellites, has been caused by the end of El Nino
This means it is possible that by some yardsticks, 2016 will be declared as hot as 2015 or even slightly hotter - because El Nino did not vanish until the middle of the year.
But it is almost certain that next year, large falls will also be measured over the oceans, and by weather station thermometers on the surface of the planet - exactly as happened after the end of the last very strong El Nino in 1998.
If so, some experts will be forced to eat their words.
-
Quelle / Source:
-
THE MAIL ON SUNDAY / DAVID ROSE
2016-11-26 en Stunning new data indicates El Nino drove record highs in global temperatures suggesting rise may not be down to man-made emissions
↑ Was ist da los? Der Hochsommermonat August wird in Deutschland nicht mehr wärmer
Man kann den Temperaturgang seit 1931 in vier Abschnitte einteilen:
-
Während der Nazizeit angenehm warm.
-
Nach dem Kriege sanken die Durchschnittstemperaturen und die kühlen Augustmonate hielten an bis 1975.
-
Ab 1975 erfolgte dann ein rasanter Anstieg auf ein neues Temperaturhoch.
-
Seit der Jahrtausendwende haben wir dieses Temperaturhoch überschritten, die Temperaturen des Monates August sinken wieder.
Insgesamt liegt das Temperaturniveau aber jetzt höher als zu Beginn der Betrachtung seit 1931.
Der nun seit fast 20 Jahren zu beobachtende Temperaturstillstand ist nicht mehr zu sehen!
Um die Entwicklung dramatischer aussehen zulassen als sie ist, greifen einige Berichterstatter zu einem Trick:
Sie lassen die Temperaturbetrachtung inmitten des Kältetales beginnen.
Meist beginnt ihre Betrachtungskurve 1961 (Abbildung 2).
Tatsächlich sind aus dem Kältetal der 60er Jahre heraus bis heute die Augusttemperaturen deutlich angestiegen.
Der Hochsommermonat August wurde in den letzten 55 Jahren deutlich wärmer.
Die Durchschnittstemperaturen lagen damals laut Trendlinie bei 16 Grad, während wir in der Gegenwart um 2 Grad höher liegen.
|
|
|
|
|
|


-
Die kalte Sonne (Fritz Vahrenholt & Sebastian Lüning)
Josef Kowatsch und Sebastian Lüning
2016-09-03 de Was ist da los? Der Hochsommermonat August wird in Deutschland nicht mehr wärmer
↑
Mogeln, tricksen, täuschen
Bei Harald Lesch sind Hopfen (und Malz) verloren
-
Harald Lesch 2016-06-29 de
Das AfD-Programm wissenschaftlich geprüft
-
EIKE Europäisches Institut für Klima und Energie
2016-07-01 de ZDF Wissenschaftserklärer Harald Lesch gegen die AfD: Mogeln, tricksen, täuschen.Das ZDF hat es sich nicht nehmen lassen, seinen mit Gebührengeldern bezahlten Wissenschaftserklärer Prof. Harald Lesch, auf die Klimaaussagen des AfD Programmes loszulassen.
Streng wissenschaftlich sachlich, wie Lesch gleich am Anfang versichert.
Mit seinem Youtube Video zu den Klimaaussagen im AfD Programm sorgt er nun für großes Aufsehen.
Mehr als 120.000 Besucher in wenigen Tagen zeigen, dass das Thema für viele im Lande von hohem Interesse ist.
Unsere Autoren Prof. Dr. Horst-Joachim Lüdecke und Michael Limburg haben sich das Lesch Video angesehen und fanden folgendes....
EIKE Europäisches Institut für Klima und Energie
2016-07-09 de Bei Harald Lesch sind Hopfen (und Malz) verloren
-
EIKE Europäisches Institut für Klima und Energie
Helmut Kuntz
2016-08-24 de Wenn der Hopfen nicht stirbt, stirbt dann der Klimawandel?Der Hopfen - wohl eine Leitpflanze des Klimawandels - muss in den Vorhersagen regelmäßig sterben, aber er spielt die Klimahysterie nicht mit.
Aus einem unerfindlichen Grund haben sich Klimawandel-Jünger(-innen) auf Hopfen als eine "Leitpflanze" für den in Deutschland besonders schlimmen Klimawandel "eingeschossen".
Regelmäßig leidet er darunter und Prof. Harald Lesch als neuer Klimawandel-Guru Bayerns ging sogar so weit, die Hopfenpflanze deshalb in Deutschlands Zukunft ganz aussterben zu lassen.
-
Die kalte Sonne (Fritz Vahrenholt & Sebastian Lüning)
2016-07-20 de Harald Leschs Prüfung des AfD-Klimaprogramms wissenschaftlich geprüft
| Harald Lesch |
Astrophysiker, Naturphilosoph, Wissenschaftsjournalist, Fernsehmoderator, Professor für Physik an der LMU München Lehrbeauftragter für Naturphilosophie an der Hochschule für Philosophie München. ▶Harald Lesch: Who is who (Aktivist der anthropogenen Globalen Erwärmung) ▶Harald Lesch: Wikipedia (Profiteure) |
↑ en Say Hello to La Niña Conditions
![]()
![]() Say Hello to La Niña Conditions
Say Hello to La Niña Conditions

-
Watts Up With That? (Antony Watts)
2016-07-18 en Say Hello to La Niña Conditions
↑ Globale Mitteltemperatur! Abschluss-Statistik 2015: jetzt einschließlich Dezember 2015
Final 2015 Statistics (Now Includes December Data)
![]()
![]()
-
EIKE Europäisches Institut für Klima und Energie
2016-02-01 de Globale Mitteltemperatur! Abschluss-Statistik 2015: jetzt einschließlich Dezember 2015Eine der großen Schlagzeilen des Jahres 2015 sind die Rekorde brechenden Anomalien der Temperatur-Datensätze des Jahres 2015 im Vergleich zu den sich aus Satellitenbeobachtungen ergebenden Anomalien, die das Jahr 2015 an die dritte Stelle setzen.
Die Diskrepanz zwischen 1998 und 2015 zwischen beiden Quellen ist nunmehr größer denn je, wie man auf der Graphik rechts erkennt.
Man vergleiche die blauen Endpunkte mit den roten Endpunkten.
-
Watts Up With That? (Antony Watts)
2016-01-27 en Final 2015 Statistics (Now Includes December Data)One of the big stories from 2015 is the record shattering anomalies
on the surface temperature data sets for 2015
versus the third ranked satellite anomalies for 2015.
The discrepancy between 1998 and 2015 is now larger than it has ever been between the satellites and surface records as can be seen on the graphic above.
Compare the blue end points with the red end points.
| de | en | fr |
|---|---|---|
| Temperatur | Temperature | Température |
| Temperaturmessungen durch Satelliten | Satellite Temperature Data | Température mesurages par satelllites |
| de | en | fr |
|---|---|---|
|
Klimawandel: Probleme Temperatur-Manipulationen Skandal Manipulationen Teil I, II, III Climategate Institute, Who's who, Mails |
Climate change: Problems Temperature Manipulations Scandal Manipulations Part I, II, III Climategate Institutes, Who's who, Mails |
Climat: Problèmes Manipulation des températures Scandale Manipulations partie I, II, III Climategate Instituts, Qui est qui, Méls |
↑
Wissenschaftler entlarvt schonungslos die Klima Behauptung der NOAA
en
In defense of satellite temperature data -
Dr. John Christy's powerful Senate testimony
-
EIKE Europäisches Institut für Klima und Energie
2016-02-10 en Wissenschaftler entlarvt schonungslos die Klima Behauptung der NOAAAngesichts der intensiven Kritik von alarmistischen Wissenschaftlern, ging Dr. John Christy in einer Kongressanhörung ins Detail, warum die von Satelliten abgeleiteten Temperaturen sehr viel zuverlässigere Indikatoren für die Erwärmung [der Erde] gegenüber Oberflächenthermometern sind.
-
Watts Up With That? (Antony Watts)
2016-02-03 en In defense of satellite temperature data - Dr. John Christy's powerful Senate testimony yesterday2016-02-02 en
Dr John Christy: NOAA data shows downward trend of extreme high temps
since 1930s
Testifying before Congress, atmospheric scientist Dr John Christy illustrates that
NOAA's own data clearly shows that many more 100 degree days occurred in the 1930's than today.
Dr. Christy: "When you look at the United States record of extreme high temperatures
you do not see an upward trend at all.
In fact, it's slightly downward.
That does fly in the face of climate model projections."
Paris Climate Promise: A Bad Deal For America
US House Committee on Science, Space, and Technology
February 2, 2016U.S. House Committee on Science, Space & Technology
2016-02-02 en Testimony of John R. Christy University of Alabama in Huntsville.
⇧ 2015
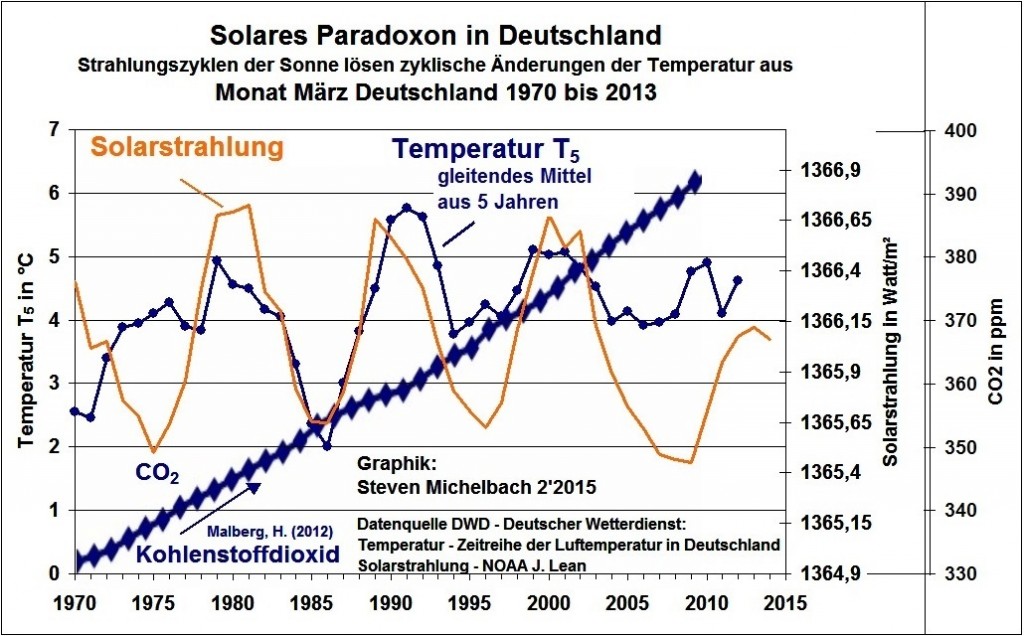
↑ Solares Paradoxon Deutschlands, Teil I: Solare Zyklen in der deutschen und der globalen Temperaturmessreihe
![]()
![]() Temperatur in Deutschland
Temperatur in Deutschland
Nicht der Einfluss des CO₂, sondern der Einfluss der Sonne
-
Die kalte Sonne (Fritz Vahrenholt & Sebastian Lüning)
Steven Michelbach, Geograph
2015-05-29 de Solares Paradoxon Deutschlands, Teil I: Solare Zyklen in der deutschen und der globalen TemperaturmessreiheFür Deutschland als Vorreiter beim Klimaschutz ist es deshalb ausgesprochen paradox,
dass gerade hier in den Temperaturen nicht der Einfluss des CO2, sondern der Einfluss der Sonne auf Klima und Wetter so markant hervortritt.
So hat die Sonne nicht nur die zurückliegende Klimageschichte geschrieben,
sondern sie ist auch für die Gegenwart und die Klimazukunft als wesentliche Kraft verantwortlich.
Die Graphik widerlegt die Aussage des IPCC
Die Aussage des IPCC: "Die Erwärmung des Klimasystems ist eindeutig.
Der größte Teil der beobachteten Zunahme der globalen mittleren Temperaturen seit Mitte des 20. Jahrhunderts ist sehr wahrscheinlich verursacht durch die beobachtete Zunahme anthropogener Treibhausgas-Emissionen."
ist mit der Graphik eindeutig widerlegt.
Es ist demnach sehr unwahrscheinlich, dass das anthropogene CO2 für die Klimaerwärmung der letzten Jahrzehnte verantwortlich ist!
Die Energiewende auf einer CO2-Verunglimpfung aufzubauen und den Einfluss der Sonne weiter zu vernachlässigen, wäre deshalb geradezu paradox.
↑ Klimawandel: Warum es in den Bergen trotzdem kälter wurde
![]()
![]()
![]() Schweizer Alpen
Schweizer Alpen
Stephan Bader erklärt die Entwicklung der Temperatur (SRF)

-
SRF
2015-04-23 de
Klimawandel: Warum es in den Bergen trotzdem kälter wurde
Im Winter 2011/12 mass man auf dem Jungfraujoch den kältesten Winter seit über 40 Jahren.
«Das ist eine signifikante Abkühlung», erklärt Stephan Bader vom Bundesamt für Meteorologie und Klimatologie ( MeteoSchweiz), «seit Anfang der 90er-Jahre stellen wir in den Gebirgsregionen einen Abwärtstrend fest.
Heute sind wir wieder ungefähr im gleichen Bereich wie vor dem Temperatursprung Ende der 80er-Jahre.»
Sicher ist:
Die Winter sind über die vergangenen 20 Jahre gesehen vor allem in den Schweizer Bergen deutlich kälter geworden.
Und es hat dort unterdessen wieder durchschnittlich so viel Schnee wie einst vor 35 Jahren.
Kommentare:
-
Die kalte Sonne (Fritz Vahrenholt & Sebastian Lüning)
2015-05-21 de Norwegens Finanzministerin zweifelt daran, dass der Mensch Hauptursache des Klimawandels istDeutsche IPCC-Freunde springen den Nachbarn zur Seite
Wird der IPCC jetzt den Schweizern die Weltklimaratszentrale in Genf wegnehmen? Deutsche IPCC-Freunde springen den Nachbarn zur Seite:
Einen Erklärungsversuch präsentierten Klimaforscher des deutschen Alfred-Wegener-Instituts. Kältere Winter, so die Fachleute, gebe es nicht trotz Klimaerwärmung, sondern gerade wegen ihr.
Die Ursache für die Abkühlung in West- und Mitteleuropa sehen sie in der fernen Arktis: Der Temperaturunterschied zwischen der kalten Arktis und den warmen Tropen verursache Westwinde, die im Winter eher mildere Luft zu uns bringen.
Eine nett gemeinte Hilfestellung. Allerdings hatte sich die renommierte ETH-Zürich bereits mit dieser Idee beschäftigt und sie als untauglich verworfen.
ETH Zürich lehnt schwindendes arktisches Meereis als Hauptauslöser für kalte europäische Winter ab
Quelle: Die kalte Sonne
2013-12-29 de Neue Studie der ETH Zürich lehnt schwindendes arktisches Meereis als Hauptauslöser für kalte europäische Winter abEs wird daher allmählich brenzlig im Alpenlande. Ganz offensichtlich boykottiert die heimische Bergwelt die Erwärmungsvorgaben des Weltklimarats.
Reise in eine ungewisse Zukunft...
Stategie vom Blick
Eine ganz andere Strategie als das SRF scheint das Boulevardblatt Blick zu fahren.
Hier ignoriert man einfach die wissenschaftlichen Fakten und behauptet frech das Gegenteil.
Offenbar fühlt man sich ziemlich sicher, dass niemand aus der Leserschaft die Fachliteratur und wahren Daten kennt.
Blick.ch behauptete am 24. April 2015 frech:Klimawandel: In den Bergen wird es schneller warm In Hochgebirgen wie den Alpen, den Rocky Mountains und dem Himalaya schreitet der Klimawandel schneller voran als in Tiefländern.
Wassermangel könnte schnell zum Problem werden.
Quelle: Blick
2015-04-24 de In den Bergen wird es schneller warm
| de | en | fr |
|---|---|---|
|
Auswirkungen des Klimas Gletscher |
Impacts of Climate Change Glaciers |
Impacts du changement climatique Glaciers |
↑
DWD widerspricht seinen eigenen Messungen
"Der Trend zu einem wärmeren Klima ist ungebrochen" (?)
en
German DWD Weather Services Own Data Contradict Its Alarmist Claims
Of "Uninterrupted Warming"
![]()
![]() DWD widerspricht seinen eigenen Messungen
DWD widerspricht seinen eigenen Messungen
"Der Trend zu einem wärmeren Klima ist ungebrochen" (?)

-
EIKE Europäisches Institut für Klima und Energie
Dr. D. E. Koelle
2015-04-30 de Der Deutsche Wetterdienst hat ein Problem mit dem KlimaEigentlich hält man den Deutschen Wetterdienst für eine seriöse Organisation, die uns zuverlässige Wetterdaten liefert.
Aber auf dem Klima-Gebiet wachsen die Zweifel, wenn man die Äußerungen führender DWD-Vertreter anlässlich ihrer Pressekonferenz in Berlin über das Jahr 2013 liest.
Dort wurde verkündet, "dass die Erwärmung fortschreitet" - auch wenn dies nicht der Fall ist, nach den Daten des DWD speziell nicht in Deutschland.
Selbst der Leiter des MPI für Meteorologie in Hamburg, Prof. Dr. Marotzke, stellte fest
"Ich kenne keinen seriösen Kollegen, der leugnen würde, dass es in den letzten Jahren nicht mehr wärmer geworden ist".
-
NoTricksZone (Pierre L. Gosselin)
2015-04-29 en German DWD Weather Services Own Data Contradict Its Alarmist Claims Of "Uninterrupted Warming"
Quelle / Source:
de Panik-Küche en Panic laboratory fr Marmite alarmiste
-
DWD Deutscher Wetterdienst
2015-03 de März 2015: Der Trend zu einem wärmeren Klima ist ungebrochen
de Klimaentwicklung in Deutschland
| de | en | fr |
|---|---|---|
|
Neue Kälteperiode Kaltzeit |
New Cold Period Cold Period |
Nouvelle periode froide Periode froide |
| Voraussagen | Predictions | Prédictions |
| Kälte: Warnungen | Cooling: Warnings | Refroidissement: Avertissements |
| Erwärmung: Entwarnung | Warming: All-Clear | Réchauffement: Fin de l'alerte |
| Eiszeiten | Ice Ages | Glaciations |
↑ en No global warming for 18 years 9 months
-
Watts Up With That? (Anthony Watts)
Christopher Monckton of Brenchley
2015-12-04 en The robust Pause resists a robust el Niño Still no global warming at all for 18 years 9 months
↑ Deutschland Temperaturen 2015
-
Die kalte Sonne (Fritz Vahrenholt & Sebastian Lüning)
2016-01-17 de Wo bleibt die 'ungebremste' Erwärmung? Kein neuer Wärmerekord 2015 - trotz El Nino-UnterstützungVon Sebastian Lüning und Josef Kowatsch
2016-01-25 de Deutschland-Temperaturen 2000-2015: 7 Monate wärmer, 5 Monate kälter2016-02-08 de Deutschlandtemperaturen 1995-2015: 8 Monate wärmer, 4 Monate kälter
2016-02-13 de Deutschland-Temperaturen 1990-2015: 7 Monate wärmer, 5 Monate kälterr
Quellen: Wikipedia de Zeitreihe der Lufttemperatur in Deutschland
↑ en WoodForTrees.org 1985-2015
![]()
![]() 1987_2002_2015
1987_2002_2015

⇧ 2014
↑
Erwärmungspause seit 1998
en
Hiatus in Global Warming since 1998

|
|
|
|
|
|


↑
en
100 Year Snow Records broken across the South Eastern US on October
31st and November 01st
2015-2035 Mini Ice Age
Agricultural Losses 2014 from Cold Temperatures
-
Watts Up With That? (Antony Watts)
David DuByne
2014-11-03 en
100 Year Snow Records broken across the South Eastern US on October
31st and November 01st
2014-10-02 en
2015-2035 Mini Ice Age
(
Source)
1 Sunspots and Rising Grain Prices
2 Snow and Record Cold 2014
3 Nine Arctic Seas Gain Ice 2014
4 Agricultural Losses 2014 from Cold Temperatures
⇧ 2012
↑
Globale Temperatur seit 16 Jahren nicht mehr angestiegen
en
Global warming stopped 16 years ago
![]()
![]()

|
|
|
-
Die kalte Sonne (Fritz Vahrenholt & Sebastian Lüning)
2012-10-16 de Neue HadCRUT-Daten belegen: Globale Temperatur seit 16 Jahren nicht mehr angestiegenDie globale Temperatur ist seit nunmehr 16 Jahren nicht mehr angestiegen
Erklärung zu den Datensätzen:
Einer der wichtigsten globalen Temperaturdatensätze stammt vom Hadley Centre des britischen meteorologischen Dienstes in Zusammenarbeit mit der Climate Research Unit (CRU) der University of East Anglia.
- Während das Hadley Centre für die Meeresoberflächentemperaturen zuständig ist,
- kümmert sich die CRU um die Temperaturen auf den Kontinenten.
-
Zusammen geben sie den sogenannten
HadCRUT-Datensatz heraus.
-
Wood for Trees
en Interactive Graphs
-
Wood for Trees
-
EIKE Europäisches Institut für Klima und Energie
2012-10-16 de Erneut offiziell bestätigt: Globale Erwärmung hörte vor 16 Jahren auf!Neuen, während der vorigen Woche veröffentlichten, Daten zufolge, hat die Welt vor fast 16 Jahren aufgehört, sich weiter zu erwärmen.
-
Die Abbildungen zeigen, dass es seit Anfang 1997 bis August 2012 keinen erkennbaren der globalen Temperaturen gegeben hat;
-
Dies bedeutet, dass die 'Pause' der globalen Erwärmung jetzt schon genauso lange gedauert hat wie die vorhergehende Periode, während der die Temperaturen gestiegen sind, also von 1980 bis 1996.
Vorhersage der verwendeten Computermodelle:
Professor Judith Curry, Leiterin des Climate Science Department an der amerikanischen Eliteuniversität Georgia Tech, sagte der Mail on Sunday, dass es ganz klar sei, dass die zur Vorhersage der zukünftigen Erwärmung verwendeten Computermodelle 'ein totaler Fehlschlag' waren.Phil Jones University of East Anglia:
Phil Jones räumte ein, dass er und seine Kollegen den Einfluss der 'natürlichen Variabilität' nicht verstünden - Faktoren wie langzeitliche Zyklen der Wassertemperatur und Änderungen der Sonnenstrahlung.Dabei hat er schon im Jahr 2009 in einer durch ClimateGate bekannt gewordenen E-Mail an einen Kollegen gesagt: "Das Plateau, das sich bereits abzeichnet und von Wissenschaftlern diskutiert wird - unter dem Strich: der 'Nicht-aufwärts-Trend' muss insgesamt 15 Jahre andauern, bevor wir uns Sorgen machen".
Aber obwohl dieser Zeitpunkt jetzt vorüber ist, hat er gesagt, dass er seine Meinung über die bedrohlichen Vorhersagen der Modelle nicht geändert hat:
"Ich glaube immer noch, dass die gegenwärtige Dekade um 0,17 Grad wärmer ausfallen wird als die vorige, die wärmer war als die neunziger Jahre".
-
-
Watts Up With That? (Antony Watts)
2012-10-13 en Report: Global warming stopped 16 years ago
2012-10-15 en The Met office responds to 'Global warming stopped 16 years ago'
'Yet in 2009, when the [temperature] plateau was already becoming apparent and being discussed by scientists, Jones told a colleague in one of the Climategate emails: "Bottom line: the 'no upward trend' has to continue for a total of 15 years before we get worried.
Climat Change Dispatch
Quellen / Sources:
-
Daily Mail (Mail Online)
2012-10-13 en Global warming stopped 16 years ago, reveals Met Office report quietly released... and here is the chart to prove it-
The figures reveal that from the beginning of 1997 until August 2012 there was no discernible rise in aggregate global temperatures
-
This means that the 'pause' in global warming has now lasted for about the same time as the previous period when temperatures rose, 1980 to 1996
-
-
Wood for Trees
en Interactive Graphs
de Panik-Küche en Panic laboratory fr Marmite alarmiste
-
EIKE Europäisches Institut für Klima und Energie
2012-11-07 de Klima-Katastrophe nun "schon" vor 2099 !? Deutsche Behörden wissen, was im Laufe des 21. Jahrhunderts beim Extrem-Wetter los ist.Einige Deutsche Behörden/Institute wie der (Deutsche Wetter Dienst) DWD haben in einer Presse-Mitteilung am 30. Oktober 2012 ausgeführt, wie sich in Deutschland im Laufe des 21. Jahrhunderts extreme Wetterlagen infolge einer Erderwärmung häufen werden, und was dagegen zu tun ist.
Daß es seit 14 Jahren keine Erderwärmung mehr gibt, daß weder die Wetterdienste noch das IPCC bisher solche Trends finden, und daß alle diese Annahmen auf unsicheren Computer-Szenarien beruhen - das wird mit keinem Wort erwähnt.
-
Pressemitteilung
BBK, BBSR, DWD, THW und UBA
2012-10-30 de
Gewappnet sein für extreme Wetterereignisse
Extreme Wetterereignisse stellen unsere Gesellschaft schon heute immer wieder vor Herausforderungen:
Hitzewellen, wie etwa im Sommer 2003, bringen enorme gesundheitliche Belastungen mit sich und können viele Todesopfer fordern, Starkniederschläge und Winterstürme verursachen immer wieder immense Schäden an Infrastruktur und Gebäuden und bringen Menschen in Gefahr.
Es ist zu erwarten, dass Extremwetterereignisse und deren Folgen künftig eine noch größere Bedeutung für Mensch und Umwelt haben werden.
Daher stellt sich die Frage, wie sich die Häufigkeit und Intensität von Extremwetterereignissen verändern wird und wie wir uns darauf vorbereiten können.
- Das Bundesamt für Bevölkerungsschutz und Katastrophenhilfe (BBK),
- das Bundesinstitut für Bau-, Stadt- und Raumforschung (BBSR),
- der Deutsche Wetterdienst (DWD),
- die Bundesanstalt Technisches Hilfswerk (THW)
- und das Umweltbundesamt (UBA)
haben sich in der Strategischen Behördenallianz Anpassung an den Klimawandel zusammengefunden, um diesen Fragen gemeinsam nachzugehen.
Im Rahmen der heutigen Pressekonferenz werden daher nicht nur ausgewählte Ergebnisse eines gemeinsamen Forschungsvorhabens, sondern anhand dessen auch die Arbeitsschwerpunkte der beteiligten Behörden innerhalb der Behördenallianz vorgestellt.
Deutschland muss sich auf Wetterextreme vorbereiten
(Dr. Paul Becker, Vizepräsident des DWD)In Konsequenz die Warnung der Bevölkerung und deren Selbsthilfefähigkeit verbessern
(Christoph Unger, Präsident BBK)Städte müssen sich gegen Hitze wappnen
(Dir. Prof. Harald Herrmann, Leiter des BBSR)Extremwetterereignisse erfordern immer wieder den Einsatz von Helferinnen und Helfern im Bereich des gesamten Bevölkerungsschutzes
(Gerd Friedsam, Vizepräsident des THW)Über Klimarisiken muss intensiv informiert werden
(Dr. Kora Kristof, Leiterin Grundsatzabteilung des UBA)
-
Die kalte Sonne (Fritz Vahrenholt & Sebastian Lüning)
2012-11-05 de IPCC-Anhänger argumentieren gegen den Erwärmungsstopp: Zeit für einen Faktencheck
↑ Langfristiger Abkühlungstrend Nordeuropas über die letzten Jahrtausende
Langfristiger Abkühlungstrend Nordeuropas über die letzten Jahrtausende erstmals präzise berechnet
![]()
![]() Langfristiger Abkühlungstrend Nordeuropas über die letzten
Jahrtausende
Langfristiger Abkühlungstrend Nordeuropas über die letzten
Jahrtausende
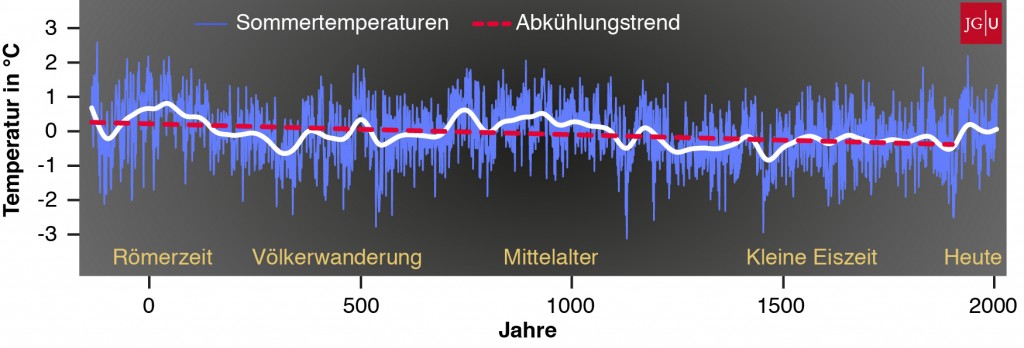
Eine 2.000-jährige Klimarekonstruktion für Nordeuropa
Langfristigen Abkühlungstrend über die letzten Jahrtausende präzise berechnet.
Temperaturen zur Römerzeit und im Mittelalter wurden bis dato als zu kühl eingeschätzt
"Diese Befunde sind auch insofern von klimapolitischer Bedeutung, da sie die Beurteilung des aktuellen Klimawandels im Vergleich zu den historischen Warmphasen beeinflussen."
Längerfristigen Abkühlungstrend Abkühlung von -0.3°C pro Jahrtausend
Die neue Klimakurve zeigt neben diesen Kalt- und Warmphasen aber noch ein Phänomen, mit dem in dieser Form nicht zu rechnen war.
Erstmalig konnten die Forscher anhand der Baumjahrringe einen viel längerfristigen Abkühlungstrend, der sich kontinuierlich über die letzten 2.000 Jahre abspielte, präzise berechnen.
Auf Grundlage der neuen Befunde macht dieser Trend, der durch langsame Veränderungen des Sonnenstandes aber auch der Distanz der Erde zur Sonne verursacht wurde, ein Abkühlung von -0.3°C pro Jahrtausend aus.
"Eigentlich erscheint diese Zahl nicht sonderlich imposant", so Professor Esper, "allerdings ist sie im Vergleich zur globalen Erwärmung, die bis heute auch weniger als 1°C beträgt, nicht zu vernachlässigen.
Wir konnten nun zeigen, dass die großräumigen Klimarekonstruktionen, die auch vom internationalen Klimarat 'IPCC' verwendet werden, den langfristigen Abkühlungstrend über die letzten Jahrtausende unterschätzen."
Temperaturrekonstruktion der letzten 2000 Jahre für Nordskandinavien.
![]()
![]() Temperaturrekonstruktion der letzten 2000 Jahre für Nordskandinavien
Temperaturrekonstruktion der letzten 2000 Jahre für Nordskandinavien

2000-jährigen Untersuchuchungszeitraum mit Abweichungen um 2 Grad.
Wenn man die Sommertemperaturen von 5-Jahres-Perioden betrachtet, findet man Unterschiede von bis zu 5 Grad.
Temperaturentwicklung von Zentral-Grönland für die letzten 4000 Jahre.
![]()
![]() Temperaturentwicklung von Zentral-Grönland für die letzten 4000 Jahre
Temperaturentwicklung von Zentral-Grönland für die letzten 4000 Jahre

Quelle / Source:
-
Die kalte Sonne (Fritz Vahrenholt & Sebastian Lüning)
2012-07-10 de Langfristiger Abkühlungstrend Nordeuropas über die letzten Jahrtausende erstmals präzise berechnet: Temperaturen zur Römerzeit und im Mittelalter wurden bis dato als zu kühl eingeschätzt
↑
Klaus-Eckart Puls:
G l o b a l C o o l i n g : Wo bleibt die Erderwärmung
en
"Goodbye Warming - Hello Cooling"
![]()
![]()
de
Wo bleibt die vorhergesagte Erderwärmung?
en Goodbye Warming - Hello Cooling

![]()
![]() Wo bleibt die vorhergesagte Erderwärmung?
Wo bleibt die vorhergesagte Erderwärmung?
-
EIKE Europäisches Institut für Klima und Energie
2012-02-25 de G l o b a l C o o l i n g : Wo bleibt die Erderwärmung ?
-
Die kalte Sonne (Fritz Vahrenholt & Sebastian Lüning)
2012-02-25 de Klaus-Eckart Puls: Wo bleibt die vorhergesagte Erderwärmung?
-
No Tricks Zone (P Gosselin)
2012-02-25 en Veteran Meteorologist Klaus Eckhart Puls: "Goodbye Warming - Hello Cooling". From Wrong Science To Fraud Science
⇧
2 Globale Temperaturen
en Global Temperatures
fr Températures globales
- a
de
Land-Oberflächentemperaturen
en Land air temperatures - b
de
Temperaturen in der Arktis
en Arctic Temperatures - c
de
Temperaturen in der Antarktis
en Antarctic Temperatures - d
de
Vergleich von Oberflächen- und Satelliten-Temperaturen
en Comparing Surface and Satellite Temperatures - e
de
Baumringdaten
en Tree ring data
↑
a Land-Oberflächentemperaturen
en Land air temperatures
de Allgemein en General fr Générale
|
Land-Oberflächentemperaturen |
|
|
|
▶Wood For Trees:
▶Temperaturen,
▶CO₂,
▶Sonnenflecken, |
|
|
|
|
en
World Surface Temperatures |
en
World temperature records available via Google Earth |
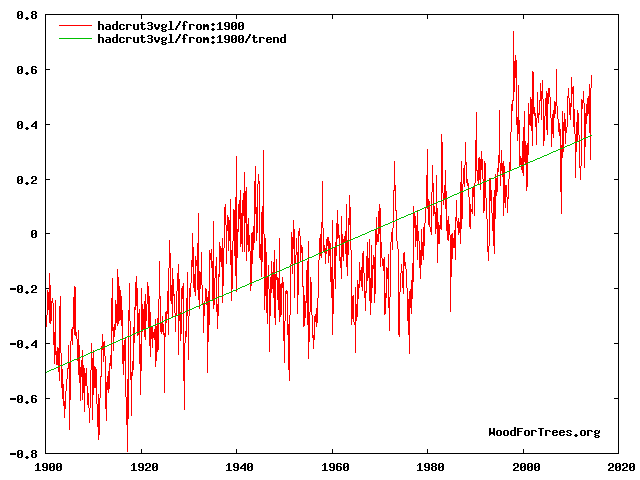
de Verzeichnis en Contents fr Sommaire
- 2019
- de Globale Temperaturentwicklung seit 2015
- 2015
- de
Manipulierte Temperatur-Daten?
Erderwärmung - was wurde gemessen und wie wurde ausgewertet ? - 2012
- de
Globale Temperatur seit 16 Jahren nicht mehr angestiegeny
en Global warming stopped 16 years ago - de Globale Mitteltemperaturen - von 1990 bis 2012 keine Erwärmung
- de Langfristiger Abkühlungstrend Nordeuropas über die letzten Jahrtausende
- de
Klaus-Eckart Puls:
G l o b a l C o o l i n g : Wo bleibt die Erderwärmung
en "Goodbye Warming - Hello Cooling" - 2011
- de Weltweite Temperaturmessungen beweisen: Kein anthropogen verursachter Klimawandel
- de Langzeit-Temperaturreihen widerlegen menschen-gemachten Klimawandel
- de
Temperaturmessungen ab 1701 widerlegen den globalen Klimawandel und den
angeblich dominierenden Einfluss des anthropogenen
CO2
en Temperature readings beginning in early 18th century disprove global warming - 2010
- de
Weltweite Langzeit-Thermometer Daten zeigen mehrheitlich
keine Erwärmung!
- de Repräsentative Beispiele von NASA-Temperaturkurven
- en Global Warmth Getting Ready To Collapse
- en Worldwide Cold Not Seen since '70s Ice Age Scare
- 2009
- en Is the Earth Cooling, or Is the Data Just Fooling
- en Debunking Global Warming in California's Wildfires
- en UAH: global temperature down in August by .181°C, SH sees biggest drop of 0.4°C
- en UAH Globally Averaged Satellite-Based Temprerature of Lower Atmosphere Jan.1979-June 2009
- en June 2009 Global Temperatures Drop Again, 8 Year Downtrend Continues
- 2008
- de
Craig Loehle: Temperaturrekonstruktion der letzten 2000 Jahre
en Craig Loehle: 2000-Year Global Temperature Reconstruction
de Text en Text fr Texte
⇧ 2019
↑ Globale Temperaturentwicklung seit 2015
-
Die kalte Sonne (Fritz Vahrenholt & Sebastian Lüning)
2019-01-22 de Globale Temperaturentwicklung seit 2015
Globale Temperaturentwicklung seit 2015
(rote Kurve, UAH-Satellitendaten),
mit linearem Trend (grüne Linie).
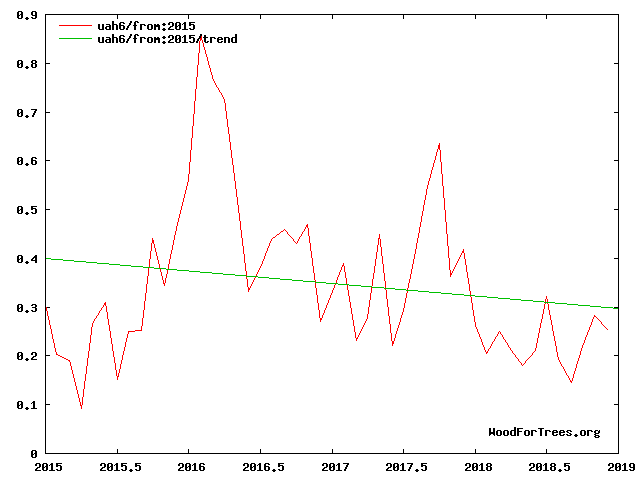
⇧ 2015
↑
Manipulierte Temperatur-Daten?
Erderwärmung - was wurde gemessen und wie wurde ausgewertet ?
-
EIKE Europäisches Institut für Klima und Energie
Prof. Ewert
2016-03-28 de
EIKE 9. IKEK: Prof. Ewert - Erderwärmung- Was wurde gemessen und wie
wurde ausgewertet?
NASA-GISS-Temperaturdaten wurden geändert
-
EIKE Europäisches Institut für Klima und Energie
2015-11-24 de Manipulierte Temperatur-Daten? Erderwärmung - was wurde gemessen und wie wurde ausgewertet ?
Reykjavik
|
Bis vor ein paar Wochen sah beim GISS die Temperaturgraphik für Reykjavik auf Island so aus: |
Jetzt stellt sich die Graphik so dar: |
|
In den 1930er und 1940er Jahren war es dort wärmer als in der Gegenwart. |
mit 1930er und 1940er Jahren, die viel kälter waren als die Gegenwart. |
|
|
|

Godthab Nuuk
![]()
![]()

Arhangel
|
|
|
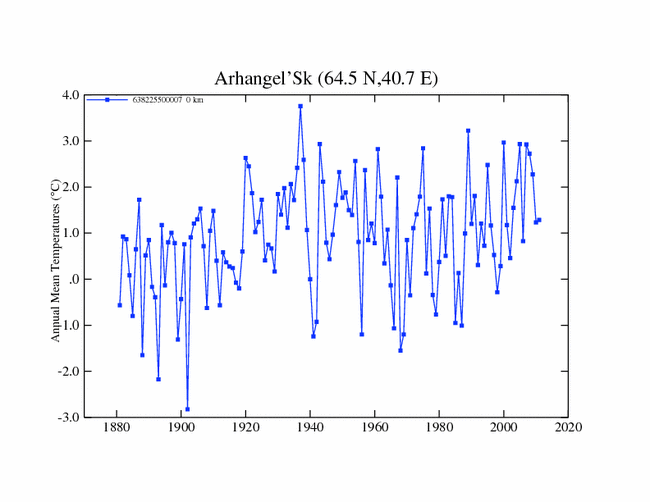
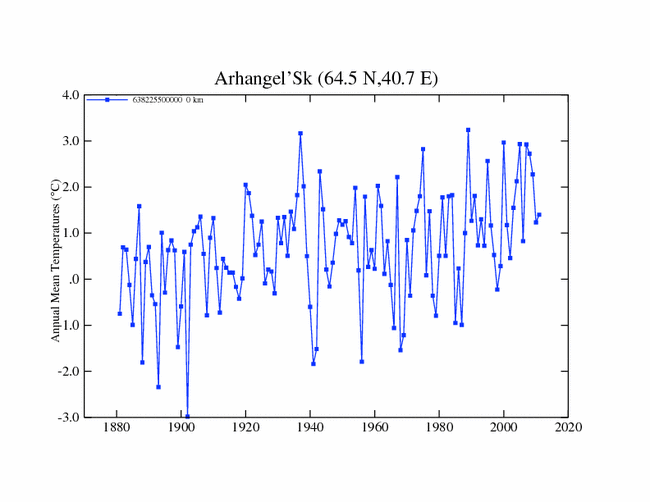
-
EIKE Europäisches Institut für Klima und Energie
2013-03-17 de Aus Erwärmung wird Abkühlung und wieder Erwärmung- Temperaturdaten von Mallorca: Original vs. NASA-GISS?
Palma de Mallorca
|
|
|
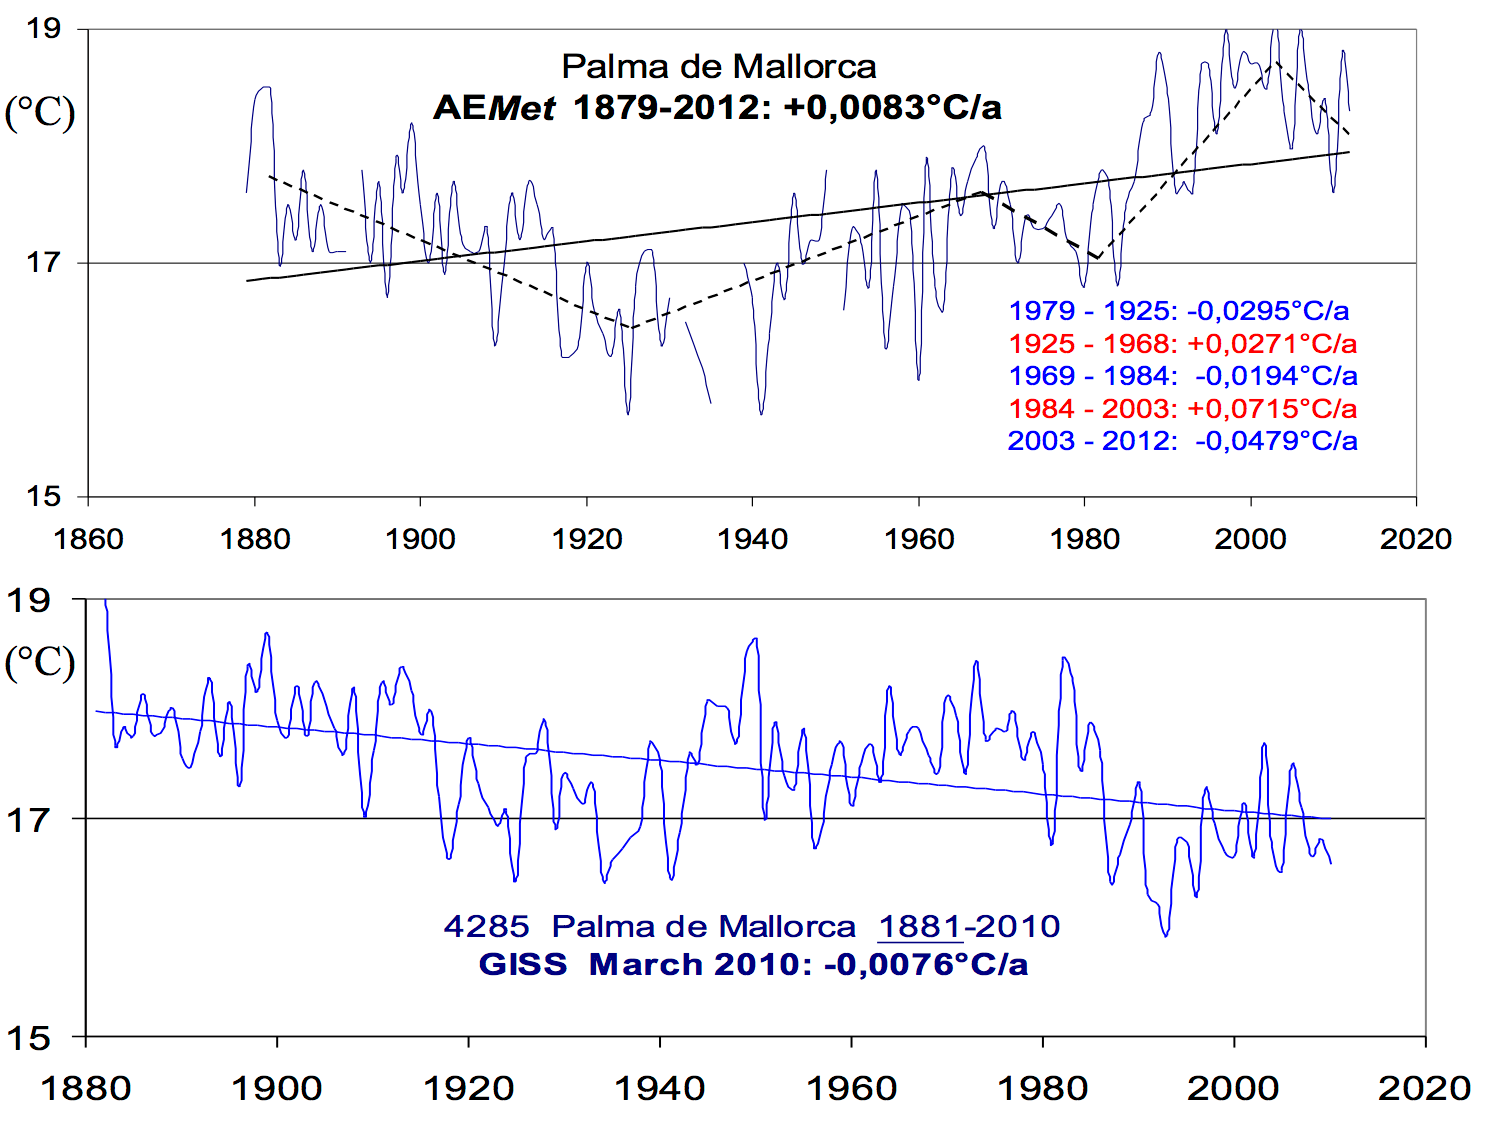

-
Friedrich-Karl Ewert
de
NASA-GISS-Temperaturdaten wurden geändert - warum ?
Harare und Moosonee
Alice Springs und Dublin
Darwin
Prag
Wien
Hohenpeißenberg
USA insgesamt
-
Real Science
2016-01-15 en "If the facts don't fit the theory, change the facts."
NASA US temperature data is based on NOAA USHCN data, which is
massively altered to create the appearance of warming.
 The graph below shows how the NOAA data is altered.
The blue line shows the averaged measured temperature at all USHCN stations, and the red line shows the average adjusted temperature.The warming trend over the last century is entirely due to "adjustments" by NOAA.
Note how the "1940s blip" has been largely removed.
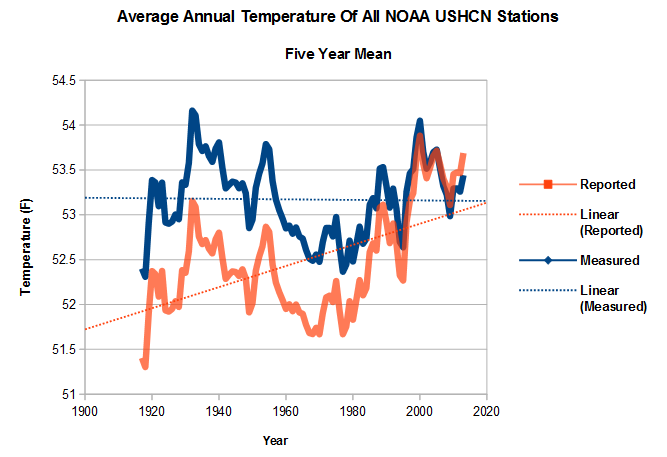
|
|
|
|
|
de
(a) = Ursprüngliche Angabe
en
(a) = Original indication |
|
|
|
|
|
|
|
|
|
|
|
|


|
|
en
GISS 1999 vs 2008 Data interpretation |
⇧ 2012
↑
Globale Temperatur seit 16 Jahren nicht mehr angestiegen
en
Global warming stopped 16 years ago
![]()
![]()
|
|
|
-
Die kalte Sonne (Fritz Vahrenholt & Sebastian Lüning)
2012-10-16 de Neue HadCRUT-Daten belegen: Globale Temperatur seit 16 Jahren nicht mehr angestiegenDie globale Temperatur ist seit nunmehr 16 Jahren nicht mehr angestiegen
Erklärung zu den Datensätzen:
Einer der wichtigsten globalen Temperaturdatensätze stammt vom Hadley Centre des britischen meteorologischen Dienstes in Zusammenarbeit mit der Climate Research Unit (CRU) der University of East Anglia.
- Während das Hadley Centre für die Meeresoberflächentemperaturen zuständig ist,
- kümmert sich die CRU um die Temperaturen auf den Kontinenten.
-
Zusammen geben sie den sogenannten
HadCRUT-Datensatz heraus.
-
Wood for Trees
en Interactive Graphs
-
Wood for Trees
-
EIKE Europäisches Institut für Klima und Energie
2012-10-16 de Erneut offiziell bestätigt: Globale Erwärmung hörte vor 16 Jahren auf!Neuen, während der vorigen Woche veröffentlichten, Daten zufolge, hat die Welt vor fast 16 Jahren aufgehört, sich weiter zu erwärmen.
-
Die Abbildungen zeigen, dass es seit Anfang 1997 bis August 2012 keinen erkennbaren der globalen Temperaturen gegeben hat;
-
Dies bedeutet, dass die 'Pause' der globalen Erwärmung jetzt schon genauso lange gedauert hat wie die vorhergehende Periode, während der die Temperaturen gestiegen sind, also von 1980 bis 1996.
Vorhersage der verwendeten Computermodelle:
Professor Judith Curry, Leiterin des Climate Science Department an der amerikanischen Eliteuniversität Georgia Tech, sagte der Mail on Sunday, dass es ganz klar sei, dass die zur Vorhersage der zukünftigen Erwärmung verwendeten Computermodelle 'ein totaler Fehlschlag' waren.Phil Jones University of East Anglia:
Phil Jones räumte ein, dass er und seine Kollegen den Einfluss der 'natürlichen Variabilität' nicht verstünden - Faktoren wie langzeitliche Zyklen der Wassertemperatur und Änderungen der Sonnenstrahlung.Dabei hat er schon im Jahr 2009 in einer durch ClimateGate bekannt gewordenen E-Mail an einen Kollegen gesagt: "Das Plateau, das sich bereits abzeichnet und von Wissenschaftlern diskutiert wird - unter dem Strich: der 'Nicht-aufwärts-Trend' muss insgesamt 15 Jahre andauern, bevor wir uns Sorgen machen".
Aber obwohl dieser Zeitpunkt jetzt vorüber ist, hat er gesagt, dass er seine Meinung über die bedrohlichen Vorhersagen der Modelle nicht geändert hat:
"Ich glaube immer noch, dass die gegenwärtige Dekade um 0,17 Grad wärmer ausfallen wird als die vorige, die wärmer war als die neunziger Jahre".
-
-
Watts Up With That? (Antony Watts)
2012-10-13 en Report: Global warming stopped 16 years ago
2012-10-15 en The Met office responds to 'Global warming stopped 16 years ago'
'Yet in 2009, when the [temperature] plateau was already becoming apparent and being discussed by scientists, Jones told a colleague in one of the Climategate emails: "Bottom line: the 'no upward trend' has to continue for a total of 15 years before we get worried.
Climat Change Dispatch
Quellen / Sources:
-
Daily Mail (Mail Online)
2012-10-13 en Global warming stopped 16 years ago, reveals Met Office report quietly released... and here is the chart to prove it-
The figures reveal that from the beginning of 1997 until August 2012 there was no discernible rise in aggregate global temperatures
-
This means that the 'pause' in global warming has now lasted for about the same time as the previous period when temperatures rose, 1980 to 1996
-
-
Wood for Trees
en Interactive Graphs
de Panik-Küche en Panic laboratory fr Marmite alarmiste
-
EIKE Europäisches Institut für Klima und Energie
2012-11-07 de Klima-Katastrophe nun "schon" vor 2099 !? Deutsche Behörden wissen, was im Laufe des 21. Jahrhunderts beim Extrem-Wetter los ist.Einige Deutsche Behörden/Institute wie der (Deutsche Wetter Dienst) DWD haben in einer Presse-Mitteilung am 30. Oktober 2012 ausgeführt, wie sich in Deutschland im Laufe des 21. Jahrhunderts extreme Wetterlagen infolge einer Erderwärmung häufen werden, und was dagegen zu tun ist.
Daß es seit 14 Jahren keine Erderwärmung mehr gibt, daß weder die Wetterdienste noch das IPCC bisher solche Trends finden, und daß alle diese Annahmen auf unsicheren Computer-Szenarien beruhen - das wird mit keinem Wort erwähnt.
-
Pressemitteilung
BBK, BBSR, DWD, THW und UBA
2012-10-30 de
Gewappnet sein für extreme Wetterereignisse
Extreme Wetterereignisse stellen unsere Gesellschaft schon heute immer wieder vor Herausforderungen:
Hitzewellen, wie etwa im Sommer 2003, bringen enorme gesundheitliche Belastungen mit sich und können viele Todesopfer fordern, Starkniederschläge und Winterstürme verursachen immer wieder immense Schäden an Infrastruktur und Gebäuden und bringen Menschen in Gefahr.
Es ist zu erwarten, dass Extremwetterereignisse und deren Folgen künftig eine noch größere Bedeutung für Mensch und Umwelt haben werden.
Daher stellt sich die Frage, wie sich die Häufigkeit und Intensität von Extremwetterereignissen verändern wird und wie wir uns darauf vorbereiten können.
- Das Bundesamt für Bevölkerungsschutz und Katastrophenhilfe (BBK),
- das Bundesinstitut für Bau-, Stadt- und Raumforschung (BBSR),
- der Deutsche Wetterdienst (DWD),
- die Bundesanstalt Technisches Hilfswerk (THW)
- und das Umweltbundesamt (UBA)
haben sich in der Strategischen Behördenallianz Anpassung an den Klimawandel zusammengefunden, um diesen Fragen gemeinsam nachzugehen.
Im Rahmen der heutigen Pressekonferenz werden daher nicht nur ausgewählte Ergebnisse eines gemeinsamen Forschungsvorhabens, sondern anhand dessen auch die Arbeitsschwerpunkte der beteiligten Behörden innerhalb der Behördenallianz vorgestellt.
Deutschland muss sich auf Wetterextreme vorbereiten
(Dr. Paul Becker, Vizepräsident des DWD)In Konsequenz die Warnung der Bevölkerung und deren Selbsthilfefähigkeit verbessern
(Christoph Unger, Präsident BBK)Städte müssen sich gegen Hitze wappnen
(Dir. Prof. Harald Herrmann, Leiter des BBSR)Extremwetterereignisse erfordern immer wieder den Einsatz von Helferinnen und Helfern im Bereich des gesamten Bevölkerungsschutzes
(Gerd Friedsam, Vizepräsident des THW)Über Klimarisiken muss intensiv informiert werden
(Dr. Kora Kristof, Leiterin Grundsatzabteilung des UBA)
-
Die kalte Sonne (Fritz Vahrenholt & Sebastian Lüning)
2012-11-05 de IPCC-Anhänger argumentieren gegen den Erwärmungsstopp: Zeit für einen Faktencheck
↑ Globale Mitteltemperaturen - von 1990 bis 2012 keine Erwärmung
-
EIKE Europäisches Institut für Klima und Energie
2012-08-22 de Die Daten führender IPCC-Wissenschaftler zeigen, dass die globale Temperatur seit 1990 um noch nie da gewesene 1°C GEFALLEN ist
-
SOLARKRITIK (Rainer Hoffmann)
2012-08-12 de Bundestags-Drucksache bestätigt: Seit 1990 KEINE(!) globale Erwärmung!
↑ Langfristiger Abkühlungstrend Nordeuropas über die letzten Jahrtausende
Langfristiger Abkühlungstrend Nordeuropas über die letzten Jahrtausende erstmals präzise berechnet
![]()
![]() Langfristiger Abkühlungstrend Nordeuropas über die letzten
Jahrtausende
Langfristiger Abkühlungstrend Nordeuropas über die letzten
Jahrtausende
Eine 2.000-jährige Klimarekonstruktion für Nordeuropa
Langfristigen Abkühlungstrend über die letzten Jahrtausende präzise berechnet.
Temperaturen zur Römerzeit und im Mittelalter wurden bis dato als zu kühl eingeschätzt
"Diese Befunde sind auch insofern von klimapolitischer Bedeutung, da sie die Beurteilung des aktuellen Klimawandels im Vergleich zu den historischen Warmphasen beeinflussen."
Längerfristigen Abkühlungstrend Abkühlung von -0.3°C pro Jahrtausend
Die neue Klimakurve zeigt neben diesen Kalt- und Warmphasen aber noch ein Phänomen, mit dem in dieser Form nicht zu rechnen war.
Erstmalig konnten die Forscher anhand der Baumjahrringe einen viel längerfristigen Abkühlungstrend, der sich kontinuierlich über die letzten 2.000 Jahre abspielte, präzise berechnen.
Auf Grundlage der neuen Befunde macht dieser Trend, der durch langsame Veränderungen des Sonnenstandes aber auch der Distanz der Erde zur Sonne verursacht wurde, ein Abkühlung von -0.3°C pro Jahrtausend aus.
"Eigentlich erscheint diese Zahl nicht sonderlich imposant", so Professor Esper, "allerdings ist sie im Vergleich zur globalen Erwärmung, die bis heute auch weniger als 1°C beträgt, nicht zu vernachlässigen.
Wir konnten nun zeigen, dass die großräumigen Klimarekonstruktionen, die auch vom internationalen Klimarat 'IPCC' verwendet werden, den langfristigen Abkühlungstrend über die letzten Jahrtausende unterschätzen."
Temperaturrekonstruktion der letzten 2000 Jahre für Nordskandinavien.
![]()
![]() Temperaturrekonstruktion der letzten 2000 Jahre für Nordskandinavien
Temperaturrekonstruktion der letzten 2000 Jahre für Nordskandinavien
2000-jährigen Untersuchuchungszeitraum mit Abweichungen um 2 Grad.
Wenn man die Sommertemperaturen von 5-Jahres-Perioden betrachtet, findet man Unterschiede von bis zu 5 Grad.
Temperaturentwicklung von Zentral-Grönland für die letzten 4000 Jahre.
![]()
![]() Temperaturentwicklung von Zentral-Grönland für die letzten 4000 Jahre
Temperaturentwicklung von Zentral-Grönland für die letzten 4000 Jahre
Quelle / Source:
-
Die kalte Sonne (Fritz Vahrenholt & Sebastian Lüning)
2012-07-10 de Langfristiger Abkühlungstrend Nordeuropas über die letzten Jahrtausende erstmals präzise berechnet: Temperaturen zur Römerzeit und im Mittelalter wurden bis dato als zu kühl eingeschätzt
↑
Klaus-Eckart Puls:
G l o b a l C o o l i n g : Wo bleibt die Erderwärmung
en
"Goodbye Warming - Hello Cooling"
![]()
![]()
de
Wo bleibt die vorhergesagte Erderwärmung?
en Goodbye Warming - Hello Cooling
![]()
![]() Wo bleibt die vorhergesagte Erderwärmung?
Wo bleibt die vorhergesagte Erderwärmung?
-
EIKE Europäisches Institut für Klima und Energie
2012-02-25 de G l o b a l C o o l i n g : Wo bleibt die Erderwärmung ?
-
Die kalte Sonne (Fritz Vahrenholt & Sebastian Lüning)
2012-02-25 de Klaus-Eckart Puls: Wo bleibt die vorhergesagte Erderwärmung?
-
No Tricks Zone (P Gosselin)
2012-02-25 en Veteran Meteorologist Klaus Eckhart Puls: "Goodbye Warming - Hello Cooling". From Wrong Science To Fraud Science
| Klaus-Eckart Puls |
Dipl.-Meteorologe, FU Berlin
▶Klaus-Eckart Puls: Who is who (Skeptiker) ▶Klaus-Eckart Puls: Video (Präsentationen) |
⇧ 2011
↑ Weltweite Temperaturmessungen beweisen: Kein anthropogen verursachter Klimawandel
-
EIKE Europäisches Institut für Klima und Energie
Prof. em. Dr. Friedrich-Karl Ewert
2011-05-23 de Weltweite Temperaturmessungen beweisen: Kein anthropogen verursachter KlimawandelAuf der ersten UN-Umweltkonferenz in Stockholm 1972 ging es um Maßnahmen zum Schutze unserer Umwelt.
Zwanzig Jahre später, 1992 in Rio de Janeiro wurde der Grundstein für die UN- Klimaverhandlungen gelegt.
Es war ein Beginn und man beschloss, solche Konferenzen fortzusetzen, um Maßnahmen zum Schutze des Klimas zu verabreden, denn inzwischen stand der Klimaschutz im Vordergrund:
Man glaubte eine globale Erwärmung diagnostiziert zu haben, die vor allem durch das Treibhausgas CO2 verursacht würde, und dass es "...um den Planeten zu retten..." vor allem darauf ankam, die CO2-Emissionen der Industrieländer zu senken.
Auf der Konferenz in Kyoto 1997 verabschiedete die Staatengemeinschaft eine Klima-Rahmenkonvention, welche die völkerrechtliche Grundlage für den internationalen Klimaschutz bilden sollte.
Weitere 20 Jahre später wird von den offiziellen Klimainstituten die angeblich vom Menschen verursachte globale Erwärmung immer noch als die Hauptaufgabe der Menschheit angesehen, denn diese Erwärmung gefährdet angeblich ihre Existenz. Tatsächlich wurde bis heute nie bewiesen, dass das vom Menschen direkt oder indirekt produzierte CO2 die ihm zugedachte Wirkung hat.
Diese Annahme beruht lediglich auf Modellrechnungen für die künftige Entwicklung der Temperatur.
Im Gegenteil: Nach den Grundgesetzen der Physik ist die vom Weltklimarat (IPCC) befürchtete Wirkung des CO2gar nicht möglich.
Der "Klimawandel" ist dank massiver Unterstützung der Medien und der Politik zum Zeitgeist geworden.
Dies wurde möglich, weil die aus den mittels Modellrechnungen generierten Szenarien in der öffentlichen Wahrnehmung zu Prognosen wurden, die für die Zukunft lebensfeindliche Zustände voraussagen und Angst erzeugen.
Angst fördert bekanntlich die Regierbarkeit.
| Friedrich-Karl Ewert |
Prof. em. Dr. Universität Paderborn, i.R. Beiratsmitglied von EIKE ▶Friedrich-Karl Ewert: Who is who (Skeptiker) ▶Friedrich-Karl Ewert: Präsentationen (Bilder & Grafiken) ▶Friedrich-Karl Ewert: Video (Präsentationen) |
↑ Langzeit-Temperaturreihen widerlegen menschen-gemachten Klimawandel
-
Prof. em. Dr. Friedrich-Karl Ewert
de
Langzeit-Temperaturreihen widerlegen menschen-gemachten Klimawandel
↑
de
Temperaturmessungen ab 1701 widerlegen den globalen Klimawandel und den
angeblich dominierenden Einfluss des anthropogenen
CO2
en
Temperature readings beginning in early 18th century disprove
global warming
-
Prof. em. Dr. Friedrich-Karl Ewert
2009-07-25 de Temperaturmessungen ab 1701 widerlegen den globalen Klimawandel und den angeblich dominierenden Einfluss des anthropogenen CO2Fazit
Die Berücksichtigung auch früherer Temperaturmessungen beweist, dass wir nicht wirklich einen globalen Klimawandel haben, sondern dass es gegenwärtig sowohl regionale Erwärmungen als auch regionale Abkühlungen gibt, und dass diese nicht von uns Menschen verursacht werden:
Die Sonne wärmt uns - nicht unser CO2.
Der Zeitgeist vom globalen Klimawandel wurde nicht durch klimatologische Fakten, sondern durch menschliche Verhaltensweisen initiiert.
Die Geschichte kennt genügend Beispiele dafür, wie auch schlimme Entwicklungen 'wissenschaftlich' begründet, unterstützt und zum eigenen Vorteil propagiert wurden; das ist heute nicht anders - im Gegenteil: infolge der technologischen Entwicklung, der weltweiten Vernetzung und der Omnipotenz der Medien wirkt es leider sehr viel produktiver und folgenschwerer als früher.
Im Internet findet man zu den Stichworten Klimalüge oder Klimaschwindel oder CO2-lüge etc. -zigtausende von Arbeiten, die die offizielle Sicht des IPCC mit belastbaren Argumenten widerlegen.
Es ist hohe Zeit, dass die gesellschaftlich relevanten Kräfte ihr klimatologisches Weltbild der Realität anpassen, denn wenn sich in wenigen Jahren diese Realität nicht mehr verdrängen lässt, wird jeder, der weiter an die Klimakatastrophe glaubt, ziemlich dumm da stehen.
-
Prof. em. Dr. Friedrich-Karl Ewert
en
Temperature readings beginning in early 18th century disprove
global warming
⇧ 2010
↑ Weltweite Langzeit-Thermometer Daten zeigen mehrheitlich keine Erwärmung!
↑ en Repräsentative Beispiele von NASA-Temperaturkurven
-
Prof. em. Dr. Friedrich-Karl Ewert
2010-07-24 de
Repräsentative Beispiele von NASA-Temperaturkurven
↑ en Global Warmth Getting Ready To Collapse
-
Joe Bastardi Channel
2010-02-26 en
Global Warmth Getting Ready To Collapse
Yes, it is warm globally, but what is lurking is a big drop.
↑ Worldwide Cold Not Seen since '70s Ice Age Scare
-
Joe Bastardi Channel
2010-01-06 en
Worldwide Cold Not Seen since '70s Ice Age Scare
Some of the same people screaming "global warming" now were screaming "ice age" then... A WORLDWIDE look at a blast from the past... Jan. 1-10, 1977.
⇧ 2009
↑ en Is the Earth Cooling, or Is the Data Just Fooling
-
Joe Bastardi Channel
2009-09-24 en
Is the Earth Cooling, or Is the Data Just Fooling
My apologies to Led Zepplin on the paraphrasing of the title. A look at the PDO in the last century and the chance it has a lot to do with the .6C rise in the earths temperatures.
↑ en Debunking Global Warming in California's Wildfires
-
Joe Bastardi Channel
2009-09-04 en
Debunking Global Warming in California's Wildfires
The facts speak for themselves. I will show them
↑ en UAH: global temperature down in August by .181°C, SH sees biggest drop of 0.4°C
-
Watts UP With That? (Antony Watts)
2009-09-04 en UAH: global temperature down in August by .181°C, SH sees biggest drop of 0.4°C
↑ UAH Globally Averaged Satellite-Based Temprerature of Lower Atmosphere Jan.1979-June 2009
![]()
![]()

-
Roy Spencer
2009-07-05 en UAH Globally Averaged Satellite-Based Temprerature of Lower Atmpsphere Jan.1979-June 2009
-
Page authors: Dr. Roy Spencer and Dr. Danny Braswell, GHCC
en Daily Earth Temperatures from Satellites
↑ June 2009 Global Temperatures Drop Again, 8 Year Downtrend Continues
![]()
![]()

-
ICECAP / Joseph D'Aleo
2009-07-05 en June 2009 Global Temperatures Drop Again, 8 Year Downtrend Continues
-
ICECAP / Joseph D'Aleo
2009-07-05 en Daily Earth Temperatures from Satellites
⇧ 2008
↑
Craig Loehle: Temperaturrekonstruktion der letzten 2000 Jahre
en
Craig Loehle: 2000-Year Global Temperature Reconstruction
↑ Craig Loehle | Ph.D., Principal Scientist with the National Council for Air and Stream Improvement (NCASI |
|---|
Mit folgendem Link wird von anderen Webseiten auf diese Seite verwiesen.
| Craig Loehle |
Ph.D., Principal Scientist with the National Council for Air and Stream
Improvement (NCASI) His research interests include ecological modeling, landscape ecology, life history theory, and natural resource management. He is the author of over 100 scientific publications. ▶Craig Loehle: Who is who (Skeptiker) |
|
|
de Das Ergebnis der Studie zeigt, dass es sich beim mittelalterlichen Wärmeoptimum und der kleinen Eiszeit um reale Ereignisse handelte und dass diese globale Auswirkungen hatten. en It clearly shows that natural climate variability happens, and these proxies coincide with known events in human history.
Roy Spencer Ph.D. |

de Temperaturrekonstruktion der letzten 2000 Jahre - ohne Baumring-Proxies
-
Craig Loehle hat sich die Kritiken an seiner Veröffentlichung zu Herzen genommen, die Kritikpunkte aufgegriffen und nun einen korrigierte Fassung, in Zusammenarbeit mit J. Huston McCulloch, veröffentlicht. Anbei die Rekonstruktion:
-
Das Ergebnis der Studie zeigt, dass es sich beim mittelalterlichen Wärmeoptimum und der kleinen Eiszeit um reale Ereignisse handelte und dass diese globale Auswirkungen hatten, was in anderen Studien bezweifelt wurde (z.B. Crowley und Lowery, 2000).
Das mittelalterliche Wärmeoptimum und die kleine Eiszeit wird ebenfalls in den Veröffentlichungen von Moberg et al. (2005) und Viau et al. (2006) nachgewiesen.
-
Diese Temperaturrekostruktionen widersprechen klar den Hockeystick-Rekonstruktionen vom "Team" (Crowley, 2000; Crowley and Lowery, 2000; Jones, 1998; Jones et al., 1999; Mann and Jones, 2003; Mann et al., 1995, 1998, 1999; Overpeck et al., 1997) und damit der daraus resultierenden Behauptung, die Temperaturänderung in den letzten 150 Jahren wäre beispiellos in den letzten 2000 Jahren.
en Temperatures published by Craig Loehle in 2007, and later revised in 2008
-
This graph shows the average of 18 non-tree ring proxies of temperature from 12 locations around the Northern Hemisphere, published by Craig Loehle in 2007, and later revised in 2008.
It clearly shows that natural climate variability happens, and these proxies coincide with known events in human history.
-
Loehle also published in 2008 a paper that described why tree rings can not be trusted as a proxy for past temperature variations.
Tree ring data have what is called a "divergence problem" in the late 20th Century where the tree ring data data suggests cooling, when in fact there has been warming.
This, by itself, should cast serious doubt on whether tree ring reconstructions (such as Michael Mann's famous "hockey stick" curve) can be used to estimate past global temperature variability.
-
Craig Loehle, J. Huston McCulloch
2008-01-10 en
Correction to: A 2000-Year Global Temperature Reconstruction Based on
Non-Tree Ring Proxies
↑ Klimaerwärmung in Deutschland nicht nachweisbar: Der DWD hantiert mit falschen Daten - Eine Bestandsaufnahme der Deutschlandtemperaturen
![]()
![]()
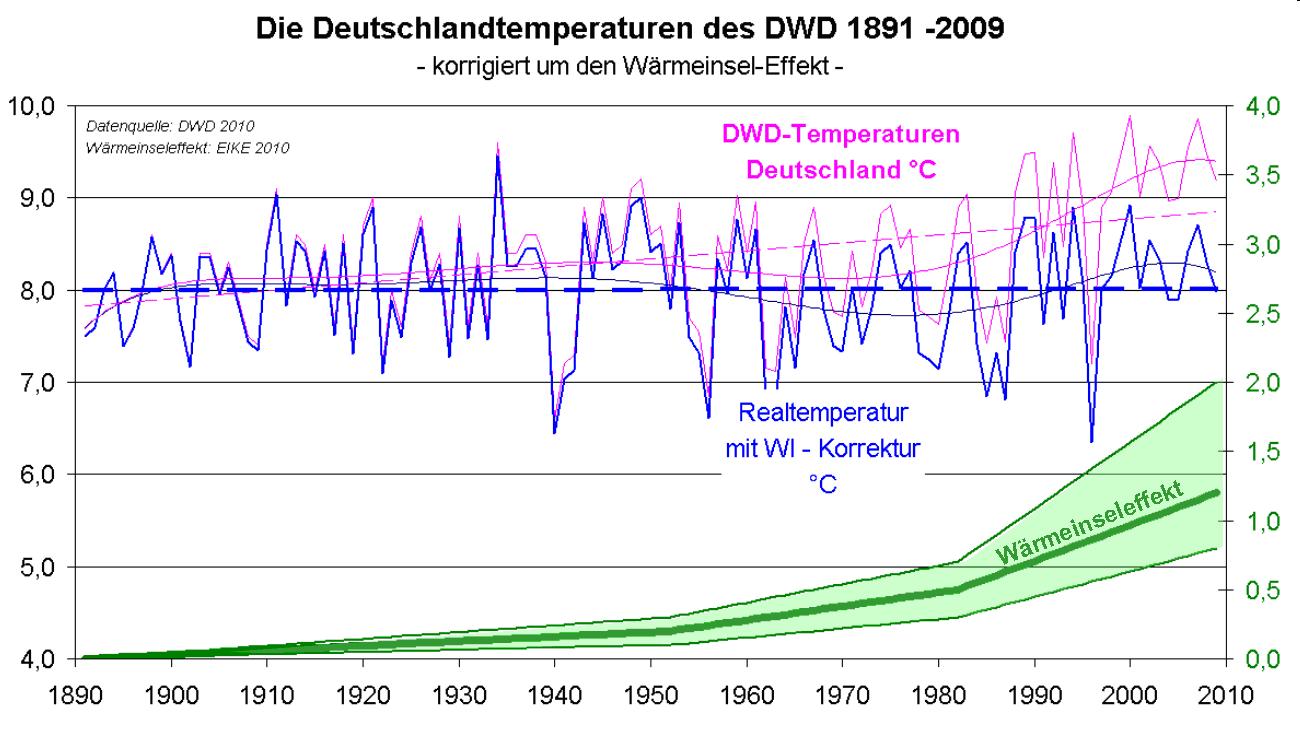
-
EIKE Europäisches Institut für Klima und Energie
Raimund Leistenschneider
2010-12-05 de Klimaerwärmung in Deutschland nicht nachweisbar: Der DWD hantiert mit falschen Daten - Eine Bestandsaufnahme der DeutschlandtemperaturenIn unseren beiden Beiträgen am 04. und 14.10.2010 hatten wir Ihnen gezeigt, dass die DWD-Messstationen nicht annähernd das halten, was der DWD der Nation in Sachen Temperaturentwicklung glauben machen will - eine wissenschaftlich und somit korrekte Wiedergabe der Temperaturentwicklung in unserem Land
und wie das ZDF einzelne Warmstationen (Frankfurter Flughafen) herauspickt und daraus sein eigenes Wetter macht, welches weder mit der Realität, nicht einmal mit den DWD-Messwerten übereinstimmt.
In diesem Artikel zeigen wir Ihnen erstmalig den tatsächlichen Temperaturverlauf für Deutschland auf,
da es uns anhand einer Referenzstation des DWD gelungen ist, den Betrag des Wärmeinselseffekts (WI) für verschiedene Zeitepochen zu berechnen.
Die Datenquellen der Berechnungen stammen dabei vom Deutschen Wetterdienst.
Die tatsächliche Temperaturkurve für Deutschland für die letzten 130 Jahre wird auf EIKE erstmalig veröffentlicht.
Nicht nur die weltweit zunehmende Verlagerung der Temperaturmessstationen auf Flughäfen verfälscht die Messwerte deutlich nach oben und zwar bis um zu 2,5°C, wie wir in unseren beiden ersten Beiträgen zeigen konnten, sondern die schleichende Landschaftsveränderung und der Wärmeeintrag der Städte.
| Raimund Leistenschneider |
Physiker
▶Raimund Leistenschneider: Who is who (Skeptiker) |
↑
b Temperaturen in der Arktis
en Arctic Temperatures
|
Arktis (Nordpol) |
de Nordpol: Keine Erwärmung seit fast 14 Jahren en Nord Pole: No warming for nearly 14 years |
|
|
Antarktis (Südpol) |
de Südpol: Keine Erwärmung seit 37 Jahren! en Südpol: Keine Erwärmung seit 37 Jahren! |
Entwicklung des arktischen und antarktischen Meereises
![]()
![]()

-
Die kalte Sonne
2016-05-08 de Arktisches Meereis wohl doch robuster als zuvor angenommen
Temperaturen
![]()
![]()

Temperatur-Entwicklung in der Arktis, 1860-2000
![]()
![]() Temperatur-Entwicklung in der Arktis, 1860-2000
Temperatur-Entwicklung in der Arktis, 1860-2000

-
Die kalte Sonne
2016-01-05 de Warum ist die arktische Eisbedeckung immer noch nicht verschwunden? trotz der zahlreichen Ankündigungen?
Temperaturentwicklung auf der Antarktischen Halbinsel
![]()
![]() Temperaturentwicklung auf der Antarktischen Halbinsel seit 1979
(schwarze Kurven).
Temperaturentwicklung auf der Antarktischen Halbinsel seit 1979
(schwarze Kurven).
Rote Linien stellen Trends dar.
Grauer Balken bei 1998 markiert Trendumkehr von Erwärmung auf Abkühlung.

Quellen / Sources:
-
Die kalte Sonne
2016-08-21 de British Antarctic Survey: Antarktische Halbinsel kühlt sich seit 1998 ab
-
Die kalte Sonne
2015-12-14 de 'Die Welt' erinnert an Lehre aus der Geschichte: Der Klimawandel hat Europa schon einmal zerstört - während der Kleinen Eiszeit!
-
EIKE Europäisches Institut für Klima und Energiee
2015-12-24 de Satelliten: Keine ,globale Erwärmung seit 18½ Jahren
Nordpol: Keine Erwärmung seit fast 14 Jahren
Südpol: Keine Erwärmung seit 37 Jahren!2016-02-16 de Globale Erwärmung? Die Antarktis kühlt dramatisch ab. Und die Arktis folgt.
-
Climate Depot
2015-12-17 en Satellites show no 'global warming' for 18 1/2 years
Nord Pole: No warming for nearly 14 years
Südpol: Keine Erwärmung seit 37 Jahren!

|
|
|
|
|


|
|
Die Arktis war in den 1930er und 40er Jahren bereits einmal so warm wie heute. In den 1940er bis 60er Jahren hat sich die Region rapide abgekühlt - und zwar um etwa den gleichen Betrag, um den sich das Gebiet in den nachfolgenden Jahrzehnten dann wiedererwärmt hat. Die HadCRUT4-Arktistemperaturdaten lassen wenig Zweifel an dieser Feststellung |

en
Science With "97% Consensus" and "99% Certainty"
Sees 0% Of Its Scientists Willing To Bet On It!
de
Eiszuwachs an den Polen überrascht Klimaforscher
29 Prozent mehr Eisfläche am Nordpol
Immer weniger Sonnenflecken
en
"Huge Ice Growth Surprises Climate Scientists"
Antarctic ice growth "problem for penguins"
Max Planck scientists: "colder winters and cooler summers"
![]() Umfahrung Grönlands und des sibirischen Nordmeers 1421-1423
Umfahrung Grönlands und des sibirischen Nordmeers 1421-1423
|
Temperaturen in der Arktis |
||
|
||

| de | en | fr |
|---|---|---|
|
Auswirkungen des Klimas Arktis (Nordpol) |
Effects of Climate Change Arctic (North Pole) |
Conséquences climatiques Arctique (Pôle Nord) |
| Temperaturen in der Arktis | Arctic Temperatures | Températures dans l'arctique |
| Meereis in der Arktis | Arctic Sea Ice | Banquise arctique |
↑
c Temperaturen in der Antarktis
en antarctic Temperatures
|
|
Wikipedia Map of Antarctica |
|
|
|
|
|
|
|
|


|
|
|
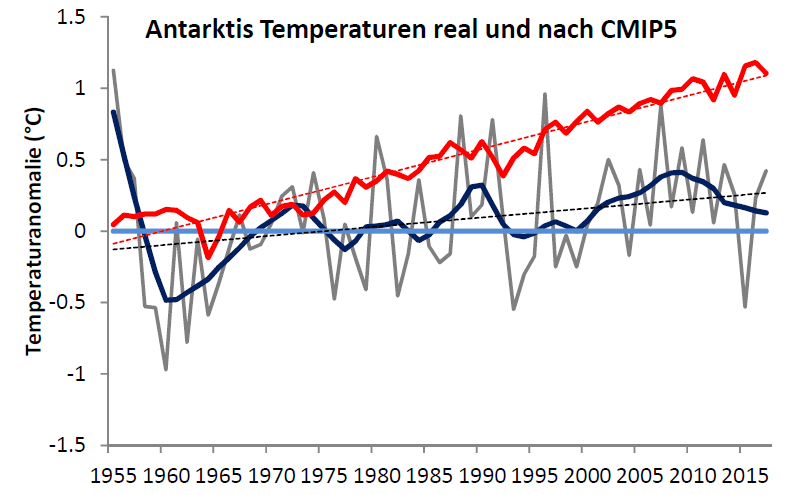

| de | en | fr |
|---|---|---|
|
Auswirkungen des Klimas Antarktis (Südpol) |
Effects of Climate Change Antarctic (South Pole) |
Conséquences climatiques Antarctique (Pôle Sud) |
↑
d Vergleich von Oberflächen- und Satelliten-Temperaturen
en ComparingSurface and Satellite Temperatures
|
Vergleich von
Oberflächen- und
Satelliten-Temperaturen |
de Die seit 1979 von Satelliten gemessenen Temperaturen werden vom Weltklimarat und der Politik ignoriert.
Satellite measurement has a number of substantial advantages
over surface temperature measurement. |
↑ Why Does NASA Oppose Satellites?
-
en One of the ironies of climate science is that perhaps the most prominent opponent of satellite measurement of global temperature is James Hansen, head of ... wait for it ... the Goddard Institute for Space Studies at NASA!
As odd as it may seem, while we have updated our technology for measuring atmospheric components like CO2, and have switched from surface measurement to satellites to monitor sea ice, Hansen and his crew at the space agency are fighting a rearguard action to defend surface temperature measurement against the intrusion of space technology.
For those new to the topic, the ability to measure global temperatures by satellite has only existed since about 1979, and is admittedly still being refined and made more accurate.
However, satellite measurement has a number of substantial advantages over surface temperature measurement:
-
It is immune to biases related to the positioning of surface temperature stations, particularly the temperature creep over time for stations in growing urban areas.
-
It is relatively immune to the problems of discontinuities as surface temperature locations are moved.
-
It is much better geographic coverage, lacking the immense holes that exist in the surface temperature network.
Anthony Watts has done a fabulous job of documenting the issues with the surface temperature measurement network in the US, which one must remember is the best in the world.
-
-
Climate Skeptic
2008-07-19 en Why Does NASA Oppose Satellites? A Modest Proposal For A Better Data Set
-
Real Science (Steven Goddard)
2016-02-07 en The Wrong StufflFour years ago, the people with The Right Stuff sent this letter to NASA satellite deniers James Hansen and Gavin Schmidt, who are completely destroying the agency's reputation with their junk science.
March 28, 2012
Letter to The Honorable Charles Bolden, Jr. NASA Administrator NASA Headquarters Washington, D.C. 20546-0001We, the undersigned, respectfully request that NASA and the Goddard Institute for Space Studies (GISS) refrain from including unproven remarks in public releases and websites.
We believe the claims by NASA and GISS, that man-made carbon dioxide is having a catastrophic impact on global climate change are not substantiated, especially when considering thousands of years of empirical data.
With hundreds of well-known climate scientists and tens of thousands of other scientists publicly declaring their disbelief in the catastrophic forecasts, coming particularly from the GISS leadership, it is clear that the science is NOT settled.
The unbridled advocacy of CO2 being the major cause of climate change is unbecoming of NASA's history of making an objective assessment of all available scientific data prior to making decisions or public statements.
As former NASA employees, we feel that NASA's advocacy of an extreme position, prior to a thorough study of the possible overwhelming impact of natural climate drivers is inappropriate.
We request that NASA refrain from including unproven and unsupported remarks in its future releases and websites on this subject.
At risk is damage to the exemplary reputation of NASA, NASA's current or former scientists and employees, and even the reputation of science itself.
For additional information regarding the science behind our concern, we recommend that you contact Harrison Schmitt or Walter Cunningham, or others they can recommend to you.
| de | en | fr |
|---|---|---|
| Temperatur | Temperature | Température |
| Temperaturmessungen durch Satelliten | Satellite Temperature Data | Température mesurages par satelllites |
| de | en | fr |
|---|---|---|
| Temperatur | Temperature | Température |
| Offizielle, weltweite, amtliche Temperaturbestimmungen | Official worldwide temperature measurement | Mesurages officielles des températures mondiales |
| de | en | fr |
|---|---|---|
| Temperatur | Temperature | Température |
| Wärme-Inseln | Urban Heat Islands | Îlots de chaleur urbain |
↑
e Baumringdaten
en Tree ring data
↑ CRU Abandons Yamal Superstick
|
|
Quelle/Source:
|

-
Minnesotans For Global Warming
2010-04-22 en
Hide the decline - satire on global warming alarmists
de Panik-Küche en Panic laboratory fr Marmite alarmiste
-
Real Climate
2012-05-11 en Yamalian yawns
⇧
3 Meerestemperaturen
en Ocean temperatures
fr Températures des océans
- a Oberflächentemperaturen der Meere
- b Wärmeinhalt Nord-Atlantik
- c de
Suche nach der angeblich im Ozean versunkenen Wärme endet mit Fehlschlag:
Tiefe Meeresschichten kühlten sich in den letzten 20 Jahren ab
en The "heat went to the oceans" excuse and Trenberth's missing heat is AWOL - deep ocean has not warmed since 2005
↑ a Oberflächentemperaturen der Meere
↑
Oberflächentemperaturen der Meere
en
Sea surface temperature anomalies
|
Oberflächentemperaturen der Meere |
|
|
|
|
|
|
|
|
|
|
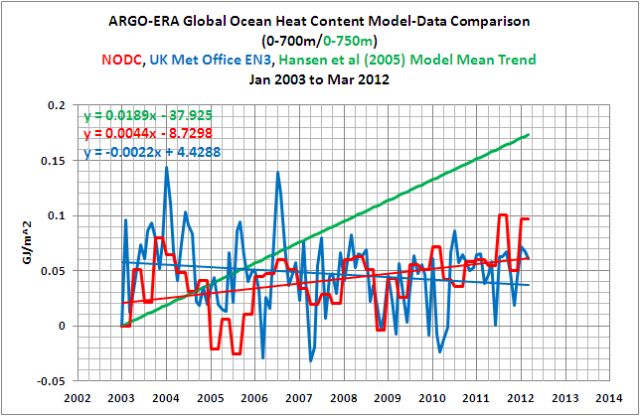


↑ Messungen der Ozeantemperatur seit 2003 mit dem ARGO-System
|
|
Die Klimamodelle sage vorher, dass sich die Ozeane erwärmen. Saubere Messungen der Ozeantemperatur gibt es aber erst seit 2003 mit dem ARGO-System. Sie sagen, dass sich die Temperatur der Ozeane seit 2003 praktisch nicht verändert hat. Und wieder sieht die Realität ganz anders aus, als die Klimamodelle vorgeben. |

-
EIKE Europäisches Institut für Klima und Energie
2011-10-21 de Untersuchung der Mechanismen zur Festsetzung der KohlenstoffsteuerSaubere Messungen der Ozeantemperatur gibt es aber erst seit 2003 mit dem ARGO-System.
In diesem System taucht eine Boje rasch bis 2000 m ab, um dann langsam wieder nach oben zu steigen.
Während dieses Aufstiegs misst sie die Temperatur und übermittelt die Daten via Satellit an die Zentrale.
Dreitausend ARGO-Bojen führen diese Messungen weltweit konstant durch.
Sie sagen, dass sich die Temperatur der Ozeane seit 2003 praktisch nicht verändert hat.
Und wieder sieht die Realität ganz anders aus, als die Klimamodelle vorgeben.
| AMSR-E | = |
Advamced Microwave Scanning Radiometer for EOS instrument on NASA's Aqua satellite (Aqua was launched in 2002) |
| SST | = | Sea Surface Temperature |
|
GLOBAL OCEANS In the figure below are plotted the 5 ocean products for the global ice free-oceans (56N to 56S)
|
TROPICAL OCEANS The figure shows the ocean product anomalies for just the deep tropics (20N to 20S latitude)
|

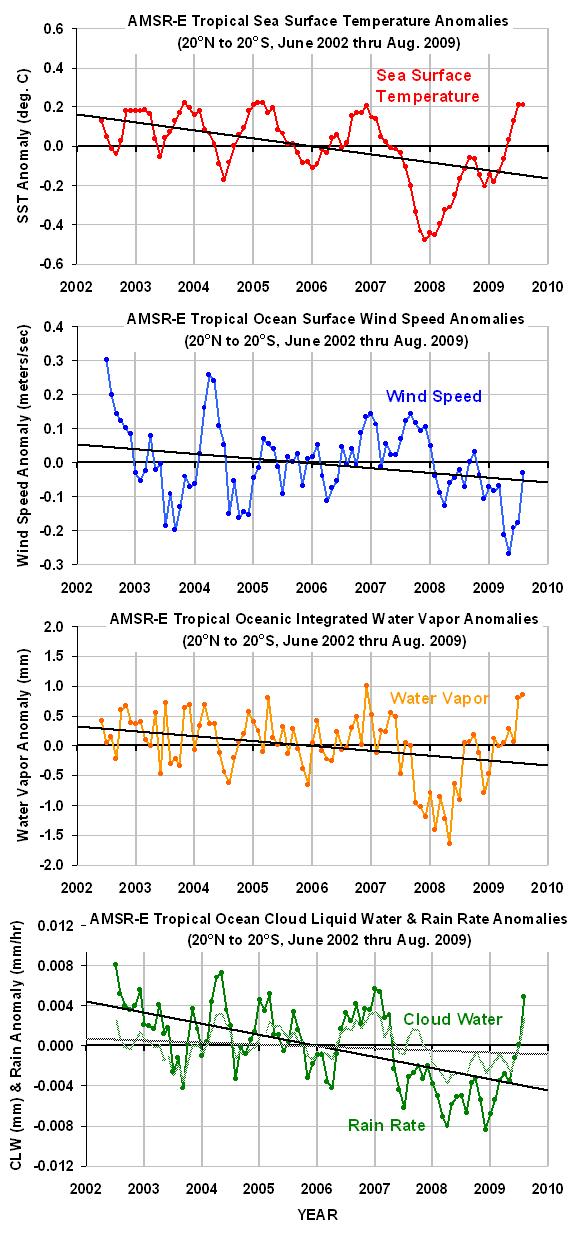
-
Roy W. Spencer, Ph. D.
2009-09-01 en Global Oceanic Climate Update for August 2009
This is the first of what might turn into a series of monthly updates of some maritime climate parameters monitored by the AMSR-E instrument on NASA's Aqua satellite.
-
Watts Up With That? (Antony Watts)
2009-09-08 en Global Oceanic Climate Update for August 2009
↑ en Global Oceanic Climate Updates
| AMSR-E | = |
Advamced Microwave Scanning Radiometer for EOS instrument on NASA's Aqua satellite (Aqua was launched in 2002) |
| SST | = | Sea Surface Temperature |
|
GLOBAL OCEANS In the figure below are plotted the 5 ocean products for the global ice free-oceans (56N to 56S)
|
TROPICAL OCEANS The figure shows the ocean product anomalies for just the deep tropics (20N to 20S latitude)
|
-
Roy W. Spencer, Ph. D.
2009-09-01 en Global Oceanic Climate Update for August 2009
This is the first of what might turn into a series of monthly updates of some maritime climate parameters monitored by the AMSR-E instrument on NASA's Aqua satellite.
-
Watts Up With That? (Antony Watts)
2009-09-08 en Global Oceanic Climate Update for August 2009
↑
Erwärmung der Ozeane: nicht sehr stark und zur falschen Zeit
en The Ocean Warms: Not Very Much And At The Wrong Time
|
|
|

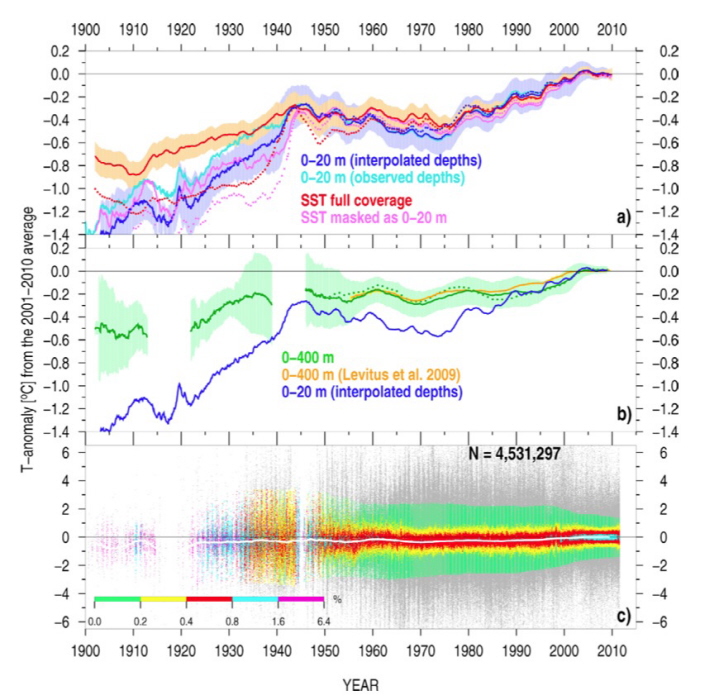
-
EIKE Europäisches Institut für Klima und Energie
2012-11-21 de Erwärmung der Ozeane: nicht sehr stark und zur falschen ZeitEine der wichtigsten Fragen der Klimawissenschaft ist die nach der Erwärmung der Ozeane, und zwar sowohl an der Oberfläche als auch in tieferen Schichten.
Wann haben sie sich erwärmt?
Wie verhält sich deren Erwärmung zum Antrieb des Klimas durch Treibhausgase?
Sind die Schichten unter der Wasseroberfläche diejenigen, in die die größte Menge der Energie der globalen Erwärmung geht?
Kommentar von U. Langer
Bestätigen sich die Ergebnisse dieser Studie, ist sie ein weiterer Genickschlag für die AGW-These (und dann ist zu erwarten, dass sie von der AGW-Gemeinde (PIK bis IPCC) komplett ignoriert wird).
Es ergeben sich nämlich aus dieser Studie einige Problemchen für AGW:
- Der Großteil der Erwärmung der Ozeane der letzten 100 Jahre fand vor 1950 statt und ist somit natürlichen Ursprungs!
- Der Großteil des Meeresspiegelanstiegs im 20. Jahrhunderts ist natürlichen Ursprungs!
- Selbst wenn die Erwärmung der Atmosphäre seit 1950 zum Großteil vom Menschen verursacht sein sollte (AGW-These), hat sie im Vergleich zu den natürlichen Klimaschwankungen im 20. ahrhundert nur eine geringe Bedeutung für den Wärmehaushalt der Erde!
-
GWPF The Global Warming Policy Forum
2012-11-09 en The Ocean Warms: Not Very Much And At The Wrong TimeSome of the most important questions in climatic science concern the warming of the oceans, both the surface and the sub-surface.
When did it warm?
How does its warming relate to greenhouse gas forcing of the climate?
Is the sub-surface of the oceans the place where most of the energy of global warming is going?
| de | en | fr |
|---|---|---|
| Temperatur | Temperature | Température |
| Temperatur und Wärmeinhalt der Ozeane | Temperatures and Heat content of the oceans | Températures et contenu thermique des océans |
↑ b Wärmeinhalt Nord-Atlantik
↑
Nordatlantik Wärmeinhalt in 0-700 m Tiefe
en
North Atlantic heat content 0-700 m depth
|
|
Climate4you
|

↑
c Suche nach der angeblich im Ozean versunkenen Wärme endet mit
Fehlschlag: Tiefe Meeresschichten kühlten sich in den letzten 20 Jahren
ab
en
The "heat went to the oceans" excuse and Trenberth's missing heat
is AWOL - deep ocean has not warmed since 2005
-
Die kalte Sonne (Fritz Vahrenholt & Sebastian Lüning)
2014-08-05 de Suche nach der angeblich im Ozean versunkenen Wärme endet mit Fehlschlag: Tiefe Meeresschichten kühlten sich in den letzten 20 Jahren abEs hat sich mittlerweile herumgesprochen, dass die Erderwärmung seit 16 Jahren pausiert.
Entgegen den IPCC-Prognosen stagnieren die Temperaturen, es wird einfach nicht mehr wärmer.
Händeringend wird jetzt im Lager des Weltklimarats nach Ursachen gesucht.
Wie konnte dies passieren?
Die Forscher ersannen eine Vielzahl von Hypothesen.
Das am weitesten verbreitete Modell besagt dabei, dass die Oberflächentemperaturen der Erde zwar stagnieren, sich aber in aller Stille die Wassermassen der Tiefsee kräftig aufheizen würden.
Und falls sich diese angestaute Wärme irgendwann an die Erdoberfläche vorkämpfen könnte, dann droht uns die Hitzekatastrophe!
Die Behauptung "Die mittleren Tiefenschichten der Meere haben sich in den vergangenen 60 Jahren 15-mal schneller erwärmt als bei jeder natürlichen Schwankung der vergangenen 10.000 Jahre" ist schlichtweg falsch.
Eigentlich müsste Spiegel Online schnellstmöglch eine Korrekturmeldung nachschieben.
Man hat den Lesern einen Bären aufgebunden, vermutlich um die klimaalarmistische Bewegung zu befördern.
-
Watts Up With That? (Antony Watts)
2014-10-06 en The "heat went to the oceans" excuse and Trenberth's missing heat is AWOL - deep ocean has not warmed since 2005
Meeres-Temperaturen: kein Erwärmungstrend
|
|
|
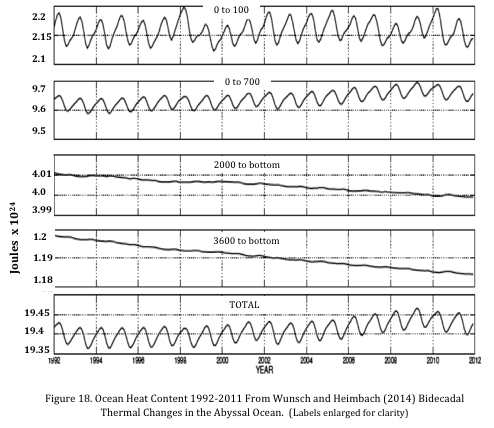
|
|
|
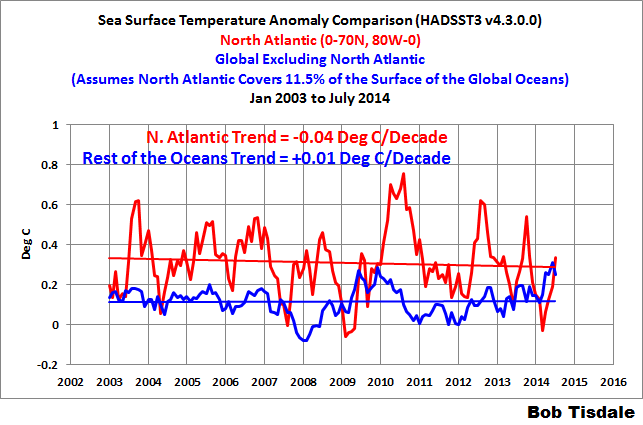
⇧
4 Temperaturen der Troposphäre
en Troposhere temperatures
fr Températures de la troposphère
↑ en Temperature lower Troposphere (TLT): RSS MSU lower trop. global mean
|
Temperature lower Troposphere (TLT): RSS MSU lower trop. global mean |
|
|
|
|
↑
Die Temperaturen der Troposphäre und der Wasseroberflächen: seit
18 Jahren ohne signifikanten Trend
en Separating signal and noise in atmospheric
temperature changes: The importance of timescale
|
|
|
-
Die kalte Sonne (Fritz Vahrenholt & Sebastian Lüning) / Frank Bosse
2012-11-09 de Die Temperaturen der Troposphäre und der Wasseroberflächen: seit 18 Jahren ohne signifikanten Trend
-
JOURNAL OF GEOPHYSICAL RESEARCH
2011-11-18 en Separating signal and noise in atmospheric temperature changes: The importance of timescaleKey Points
- Models run with human forcing can produce 10-year periods with little warming
- S/N ratios for tropospheric temp. are ~1 for 10-yr trends, ~4 for 32-yr trends
- Trends > 17 yrs are required for identifying human effects on tropospheric temp
⇧
5 Das Versagen der offiziellen Tempreaturvoraussagen
en The abject failure of official global-warming predictions
- a de
Das Versagen der offiziellen Tempreaturvoraussagen
en The abject failure of official global-warming predictions - b de Bitterer Fehlschlag: Klimamodell-Prognosen liegen bei europäischen Wintertemperaturen komplett daneben
↑
a Das Versagen der offiziellen Tempreaturvoraussagen
The abject failure of official global-warming predictions
![]()
![]()

-
Watts Up With That? (Antony Watts)
2016-01-13 en The abject failure of official global-warming predictions
| de | en | fr |
|---|---|---|
|
Klimawandel: Probleme Prognosen |
Climate change: Problems Prognostics |
Climat: Problèmes Pronostiques |
| de | en | fr |
|---|---|---|
|
IPCC Intergovernmental Panel on Climate Change Fundamental falsche Klima-Modelle |
IPCC Intergovernmental Panel on Climate Change Fundamentally wrong Climate Models |
GIEC Groupe d'experts intergouvernemental sur l'évolution du climat Modèles du climat erronés |
| de | en | fr |
|---|---|---|
|
Neue Kälteperiode Kaltzeit |
New Cold Period Cold Period |
Nouvelle periode froide Periode froide |
| Voraussagen | Predictions | Prédictions |
| Kälte: Warnungen | Cooling: Warnings | Refroidissement: Avertissements |
| Erwärmung: Entwarnung | Warming: All-Clear | Réchauffement: Fin de l'alerte |
| Eiszeiten | Ice Ages | Glaciations |
↑ b Bitterer Fehlschlag: Klimamodell-Prognosen liegen bei europäischen Wintertemperaturen komplett daneben
-
Die kalte Sonne (Fritz Vahrenholt & Sebastian Lüning) / Frank Bosse
2016-10-09 de Bitterer Fehlschlag: Klimamodell-Prognosen liegen bei europäischen Wintertemperaturen komplett danebenAllmählich tröpfelt die Wahrheit ans Licht.
Eine Forschergruppe um Claudio Saffiotti von der ETH Zürich verglich die realen Temperaturen mit Klimamodell-Prognosen.
Als Beispiel nahmen sich die Wissenschaftler die europäischen Wintertemperaturen des Zeitraums 1989-2012 vor.
Die Messwerte zeigen eine ausgeprägte Abkühlung der Winter von fast vier Zehntelgraden pro Jahrzehnt an.
Die Klimamodelle hingegen hatten fälschlicherweise eine starke Erwärmung prognostiziert.
Ganz schön peinlich.
Hier die Kurzfassung der Arbeit:
Geophysical Research Letters
2016-08-08 en Reconciling observed and modeled temperature and precipitation trends over Europe by adjusting for circulation variabilityEurope experienced a pronounced winter cooling of about -0.37°C/decade in the period 1989-2012,
in contrast to the strong warming simulated by the Coupled Model Intercomparison Project Phase 5 multimodel average during the same period.
Even more pronounced discrepancies between observed and simulated short-term trends are found at the local scale, e.g., a strong winter cooling over Switzerland and a pronounced reduction in precipitation along the coast of Norway.
We show that monthly sea level pressure variability accounts for much of the short-term variations of temperature over most of the domain and of precipitation in certain regions.
Removing the effect of atmospheric circulation through a regression approach reconciles the observed temperature trends over Europe and Switzerland and the precipitation trend along the coast of Norway with the corresponding multimodel mean trends.
⇧
6 Fehlerhafte Temperaturmessungen
en Not reliable temperature measurements
fr Faux mesurages de températures
- d en Surface temperature records: Policy driven deception
- e de Links auf dieser Website en Links on this Website fr Liens sur ce site web
|
|
|
Just as the Medieval Warm Period was an obstacle to those trying to suggest that today's temperature is exceptional, and the UN and its supporters tried to abolish it with the "Hockeystick" Graph, the warmer temperatures in the 1930s and 1940s were another inconvenient fact that needed to be "fixed". |

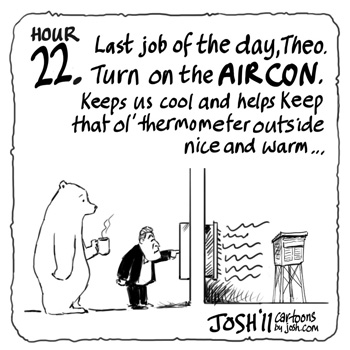
↑
a Die wunderbare Welt der Temperaturdaten-Korrekturen: Und plötzlich
hatte sich der Trend ins Gegenteil verkehrt...
en New paper blames about half of global warming on weather station data
homogenization
|
|
↑
b Neue Studie enthüllt: US Wetterbehörde NOAA setzt die Erwärmung der
letzten 30 Jahre doppelt so hoch an wie gemessen!
en New study shows half of the global warming in the USA is artificial
|
|
|
|
↑
c Globale Temperaturen -
Erfindung von Daten mit Erwärmung dort, wo es gar keine gibt
en
Meshing issues on global temperatures -
warming data where there isn't any
-
EIKE Europäisches Institut für Klima und Energie
Tim Crome / Chris Frey
2017-11-18 de Globale Temperaturen - Erfindung von Daten mit Erwärmung dort, wo es gar keine gibt
-
Watts UP With That? (Antony Watts) / Tim Crome
2017-11-10 en Meshing issues on global temperatures - warming data where there isn't any
↑ d en Surface temperature records: Policy driven deception
|
|
Around 1990, NOAA lost more than three-quarters of the climate measuring stations around the world. It can be shown that country by country, they lost stations with a bias towards higher-latitude, higher-altitude and rural locations, all of which had a tendency to be cooler. The Climategate whistleblower proved what those of us dealing with data for decades already knew. The data were not merely degrading in quantity and quality: they were being manipulated. In absolute terms the 1930s had a much higher frequency of maximum temperature extremes than the 1990s or 2000s or the combination of the last two decades. The 1930s were, by far, the hottest period for the timeframe. |

Statements:
Temperature adjustments: We were astonished to find that strong adjustments have indeed been made. About half the adjustments actually created a warming trend where none existed; the other half greatly exaggerated existing warming.
"The shocking truth is that the oldest readings have been cranked way down and later readings artificially lifted to give a false impression of warming."
Climategate: The Climategate whistleblower proved what those of us dealing with data for decades already knew. The data were not merely degrading in quantity and quality: they were being manipulated.
The Climategate emails detail efforts to deny access to global temperature data.
WOULD YOU LIKE YOUR DATA HOMOGENIZED, OR PASTEURIZED?
Whether or not the homogeneity adjustment is warranted, it has an
effect that calls into question just how much the earth has in fact
warmed over the past 120-150 years.
There are many iterations of the data sets available from CRU, NOAA and NASA. The differences between them is much greater than the changes over time calling into question our ability to accurately assess climate trends.
HadCRUT (UK): To make an urbanization assessment for all the stations used in the HadCRUT dataset would require suitable meta-data (population, siting, location, instrumentation, etc.) for each station for the whole period since 1850. No such complete meta-data are available.
GISS The GISS sites are defined to be *rural* if the town has a population under 10,000. Unfortunately, the GISS population data are out of date. Stations at cities with populations greatly exceeding 10,000 are incorrectly classified as rural.
NOAA: Before the "adjustment" by NOAA, temperatures in Darwin were falling at 0.7 Celsius per century, but after the homogenization they were rising at 1.2 Celsius per century. The gross upward adjustment was 2 Celsius per century.
NASA: NASA also constantly tampers with the data.
Russia: "It is only when data from the more southerly, warmer locations is used in the interpolation to the vacant grid boxes that an artificial warming is introduced."
Canada:
Just one thermometer remains for everything north of the 65th parallel.
That station is Eureka, which has been described as 'The Garden Spot of the Arctic'."
UK: "Far from being warmer due to assumed global warming, comparison of actual temperature data shows that UK summers in the 20th century were cooler than those of two centuries previously."
Eurasia "If we add the inadequacy of the records for Eurasia, it is reasonable to say that we are ignorant of weather and climate north of 55° N in the Northern Hemisphere."
Australia: "These graphs all use the raw GHCN data, and they show virtually no trend in temperatures in Northern Australia in 125 years."
-
EIKE Europäisches Institut für Klima und Energie
2010-02-21 de Messungen der Oberflächentemperaturen: Eine politisch betriebene Täuschung?Am 26.Januar 2010 wurde in der Zeitschrift Science and Public Policy Institute (SPPI Original Paper) diese 111 Seiten umfassende Studie der Autoren D'aleo und Watts publiziert.
Die Autoren schreiben in der Einführung, dass ....jüngste Enthüllungen, die sich aus den ClimateGate-e-Mails der Klima-Forschungs-Abteilung der Universität von East Anglia ergeben, zeigen, wie sehr angesehene Daten-Zentren, wie NOAA und NASA, sich dazu verschworen haben, die weltweiten Temperaturaufzeichnungen zu manipulieren, um den Eindruck zu erwecken, dass die Temperaturen im 20. Jahrhundert schneller angestiegen seien, als sie es tatsächlich taten.
Diese Entdeckungen haben weltweit die Klimaforscher veranlasst, sich die angebotenen Daten genau anzusehen, um sie mit den Originaldaten und den Daten aus anderen Quellen zu vergleichen.
Dieser Bericht stellt einige der alarmierenden Entdeckungen zusammen.
-
Watts Up With That? (Antony Watts)
2010-02-20 en New Compendium Paper on Surface Temperature Records
-
Watts Up With That? (Antony Watts)
2010-01-29 en Must see: John Coleman's Global Warming Special #2 - now online at YouTube
↑
e Links auf dieser Website
en Links on this Website
fr Liens sur ce site web
| de | en | fr |
|---|---|---|
| Temperatur | Temperature | Température |
| Temperaturmessungen durch Satelliten | Satellite Temperature Data | Température mesurages par satelllites |
| de | en | fr |
|---|---|---|
| Temperatur | Temperature | Température |
| Offizielle, weltweite, amtliche Temperaturbestimmungen | Official worldwide temperature measurement | Mesurages officielles des températures mondiales |
| de | en | fr |
|---|---|---|
| GISS - Goddard Institute for Space Studies (NASA) | GISS - Goddard Institute for Space Studies (NASA) | GISS - Goddard Institute for Space Studies (NASA) |
| GISS-Oberflächentemperaturen | GISS-Surface temperatures | GISS-Températures des surfaces |
| de | en | fr |
|---|---|---|
| Temperatur | Temperature | Température |
| Wärme-Inseln | Urban Heat Islands | Îlots de chaleur urbain |
| de | en | fr |
|---|---|---|
| Temperatur | Temperature | Température |
| Wie man Temperaturen nicht misst | How not to measure temperature | Comment on ne mesure pas les températures |
| de | en | fr |
|---|---|---|
| Temperatur | emperature | Température |
| Qualität der Temperaturdaten | Station Site Quality Rating | Qualité des mesures de températures |
| de | en | fr |
|---|---|---|
|
Klimawandel: Probleme Temperatur-Manipulationen Skandal Manipulationen Teil I, II, III Climategate Institute, Who's who, Mails |
Climate change: Problems Temperature Manipulations Scandal Manipulations Part I, II, III Climategate Institutes, Who's who, Mails |
Climat: Problèmes Manipulation des températures Scandale Manipulations partie I, II, III Climategate Instituts, Qui est qui, Méls |
⇧
7 Temperatur-Manipulationen

en Temperature Manipulations
fr Manipulation des températures
Links zur Klimaschau
|
|
Temperatur‑Manipulationen:
▶Probleme,
▶Wissenschaft
Wissenschaft: ▶Gefälschte Temperaturdaten Wissenschaft: ▶Nachträgliche Temperatur‑Manipulationen Wissenschaft: ▶Temperaturmessungen durch Satelliten Manifestationen: ▶Temperaturen Klima-Skandal: ▶Manipulationen |
- a de
Die GISS-Daten werden nachträglich verändert
en USHCN and GISS decided to "adjust" the temperature record - b de
Gitterpunktsabstand
en Smoothing Radius - c de
NOAA hat alle ausser 1,500 von 6,000 Thermometern gelöscht
en NOAA had deleted all but 1,500 of the 6,000 thermometers - d en Black Swan Climate Theory
- e de
NOAA in Not: Erwärmungspause der letzten 15 Jahre lässt sich nicht
so einfach wegtricksen
en NOAA erases 'pause' in warming - f de
NASA/GISS Hansen: Drei Jahrzente Temperaturdaten-Anpassung
en NASA/GISS Hansen: Three decades of Temperature Adjustments - g de
1940 wärmer als 1998? - Ja!
en 1940 warmer than 1998? - Yes!
fr 1940 plus chaud que 1998? - Oui! - h en UK Met Office Hadley Centre / Professor Phil Jones
- i de
Das Hockeyschläger Diagramm
en The Hockey stick curve
fr La courbe en crosse de hockey - j de
Als das IPCC das Mittelalterliche Klimaoptimum verschwinden ließ
en IPCC changed viewpoint on the MWP in 2001
fr Comme le GIEC avait disparu le Optimum médiéval climatique
de Verzeichnis en Contents fr Sommaire
- de Allgemein en General fr Générale
- 2018
- de
NOAA-Datenmanipulation um 1,4°C:
"Schlimmer kann Wissenschaft nicht degenerieren"
en NOAA 2.5 Degrees F Data Tampering - 'Science Doesn't Get Any Worse Than This' - 2017
- de Temperaturdatenmanipulation von GISS (NASA) erneut nachgewiesen
- en Robust Evidence NOAA Temperature Data Hopelessly Corrupted By Warming Bias, Manipulation
- 2015
- de
NOAA in Not: Erwärmungspause der letzten 15 Jahre lässt sich nicht
so einfach wegtricksen
en NOAA erases 'pause' in warming - en Black Swan Climate Theory
- de
NOAA versteckt die Rohdaten hinter einem Viertel-Millionen-Dollar
Schutzwall
en NOAA demands $262,000 fee for looking at their 'public' data - 2011
- de
Wärmegehalt der Ozeane ist geringer als bisher gedacht
en Ocean Heat Content Adjustments: Follow-up and More Missing Heat
de Text en Text fr Texte
⇧ de Allgemein en General fr Générale
|
|
|


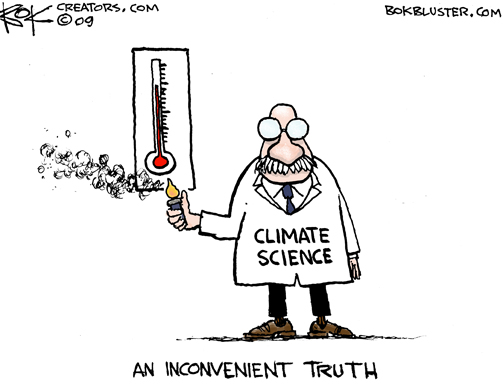
![]()
![]()
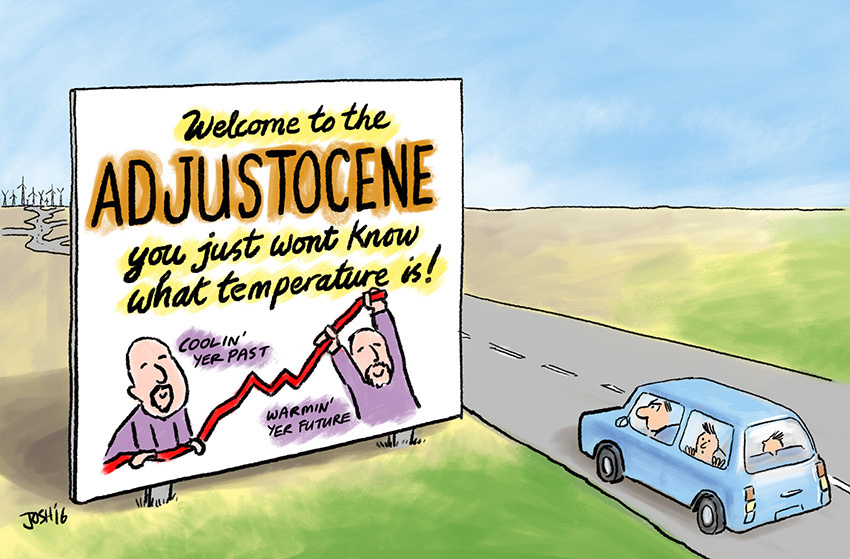
| de | en | fr |
|---|---|---|
|
Klimawandel: Probleme Temperatur-Manipulationen Skandal Manipulationen Teil I, II, III Climategate Institute, Who's who, Mails |
Climate change: Problems Temperature Manipulations Scandal Manipulations Part I, II, III Climategate Institutes, Who's who, Mails |
Climat: Problèmes Manipulation des températures Scandale Manipulations partie I, II, III Climategate Instituts, Qui est qui, Méls |
| NOAA |
National Oceanic and Atmospheric Administration
▶NOAA: Who is who (Institute & Organisationen der Globalen Erwärmung)
Manipulationen |
| NASA/GISS |
NASA National Aeronautics and Space Administration GISS Goddard Institute for Space Studies ▶NASA/GISS: Who is who (Institute & Organisationen der Globalen Erwärmung)
Manipulationen |
↑
a Die GISS-Daten werden nachträglich verändert
en
USHCN and GISS decided to "adjust" the temperature record
-
Real Science
2016-01-15 en "If the facts don't fit the theory, change the facts."
NASA US temperature data is based on NOAA USHCN data, which is
massively altered to create the appearance of warming.
The graph below shows how the NOAA data is altered.
The blue line shows the averaged measured temperature at all USHCN stations, and the red line shows the average adjusted temperature.The warming trend over the last century is entirely due to "adjustments" by NOAA.
Note how the "1940s blip" has been largely removed.
|
|
|
|
|
de
(a) = Ursprüngliche Angabe
en
(a) = Original indication |
|
|
|
|
|
|
|
|
|
|
|
|
|
|
en
GISS 1999 vs 2008 Data interpretation |
↑
b Gitterpunktsabstand
en
Smoothing Radius
|
de Die erste Graphik zeigt die Anomalien im Juni 2010, vom GISS interpoliert aus einem Gitterpunktsabstand von 1200 km Die grüne Linie markiert den 80. Breitengrad Nord. Man erkennt, dass die Darstellung von GISS im Wesentlichen in der Region nördlich von 80° eine Temperaturabweichung bis +4 K zeigt. en GISS June 2010 anomalies smoothed to 1200 km. The green line marks 80N latitude. Note that GISS shows essentially the entire region north of 80N up to four degrees above normal. |
de Diese Graphik zeigt das Gleiche, jedoch mit einem Abstand der Gitterpunkte von 250 km. Wie man sieht, hat das GISS nur sehr wenige oder gar keine Daten nördlich von 80° N. en This map is the same, but with 250 km smoothing. As you can see, GISS has little or no data north of 80N. |
|
|
|
|
de James Hansen (NASA/GISS): ... die über 12 Monate gleitende mittlere globale Temperatur hat in den Analysen des GISS im Jahre 2010 einen neuen Rekord erreicht... Die GISS-Analysen weisen das Jahr 2005 als das wärmste Kalenderjahr aus, während die Analyse vom HadCRUT 1998 als das wärmste Jahr zeigen. Hauptursache [für diese Diskrepanz] ist, dass wir die geschätzte Temperatur der Arktis mit einbezogen haben. Mit anderen Worten die Daten vom GISS basieren auf inkorrekten, konstruierten Daten. Warum hat es Hansen offensichtlich gefallen, die gemessenen Daten des DMI zu ignorieren und stattdessen auf "geschätzte" Daten aus der Arktis zurückzugreifen? Die Temperaturanomalien in der Arktis sind nach GISS bis zu 4 K zu hoch, und doch behauptet er, einen gemessenen Rekord um ein paar Hundertstel Grad zu haben. |
en James Hansen (NASA/GISS): ... the 12-month running mean global temperature in the GISS analysis has reached a new record in 2010... GISS analysis yields 2005 as the warmest calendar year, while the HadCRUT analysis has 1998 as the warmest year. The main factor is our inclusion of estimated temperature change for the Arctic region. In other words the GISS record high is based on incorrect, fabricated data. Why did Hansen apparently choose to ignore the DMI data when "estimating" Arctic temperatures? GISS Arctic anomalies are high by as much as 4 degrees, and yet he claims a global record measured in hundredths of a degree. |


↑
c NOAA hat alle ausser 1,500 von 6,000 Thermometern gelöscht
en
NOAA had deleted all but 1,500 of the 6,000 thermometers
|
|
|
|
|
|

↑ d en Black Swan Climate Theory
In this five part video series, Engineering Physicist Michael W. Brakey discusses the corrupt data being provided by the National Oceanic and Atmospheric Association in order to promote the theory of Global Warming.
![]()
![]() "Get Out Of Adjusting Business !
"Get Out Of Adjusting Business !
Grün/Green (local source): Lewiston-Auburn area of Maine
Schwarz/Black (NOAA 2013): Maine's overall state
Blau/Blue (NOAA 2014)
(3° Fahrenheit ≅ 1,5° Celsius)
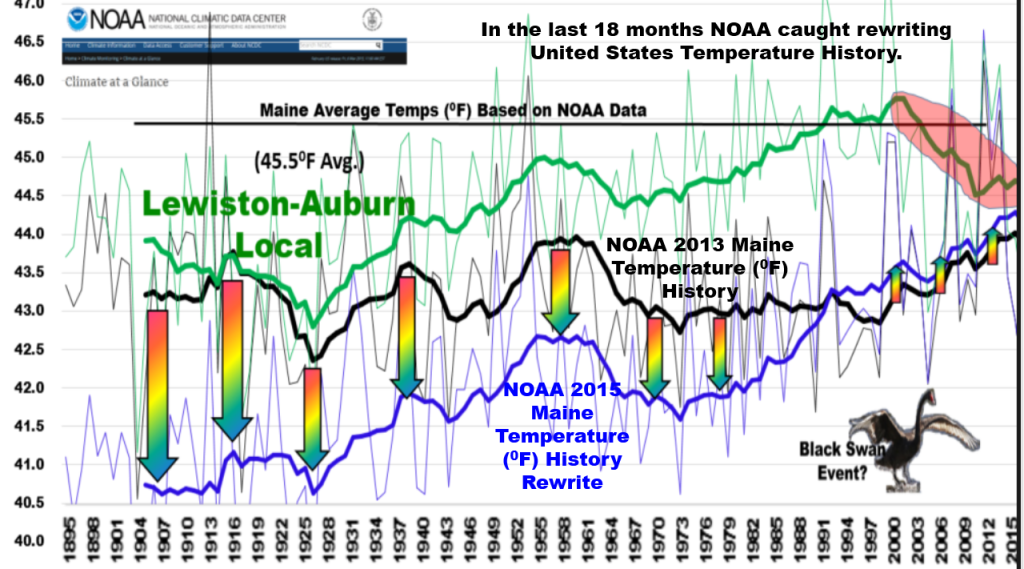
-
EIKE Europäisches Institut fü Klima und Energie
2015-05-12 de Black Swan Climate Theory
-
NoTricksZone (Pierre L. Gosselin)
2015-05-09 en Energy Physicist Implores NOAA To Return To Credibility "Get Out Of Adjusting Business !
-
NoTricksZone (Pierre L. Gosselin)
2015-06-01 en Bombshell: Comprehensive Analysis Reveals NOAA Wrongfully Applying "Master Algorithm" To Whitewash Temperature History
-
NoTricksZone (Pierre L. Gosselin)
2015-07-07 en NOAA's Data Debacle ... Alterations Ruin 120 Years Of Painstakingly Collected Weather Data (Part 2/2)
↑
e NOAA in Not: Erwärmungspause der letzten 15 Jahre lässt sich nicht
so einfach wegtricksen
en NOAA erases 'pause' in warming
2015: NOAA Data Tampering Since Last Year
|
|
|

-
Die kalte Sonne (Fritz Vahrenholt & Sebastian Lüning)
2015-12-09 de IPCC-Autor Gerald Meehl verurteilt fragwürdige Rettungsaktionen von Klimaaktivisten zur Erwärmungspause: Der Hiatus ist real und ist erklärungsbedürftig2015-07-02 de NOAA in Not: Erwärmungspause der letzten 15 Jahre lässt sich nicht so einfach wegtricksen
2015-06-15 de Max Planck Gesellschaft: "Die Temperaturen stagnieren ungefähr seit 1998, wenn auch auf hohem Niveau"
-
Watts Up With That? (Antony Watts)
2015-06-09 en Climate scientists criticize government paper (Karl et al. 2015) that erases 'pause' in warmingUntil last week, government data on climate change indicated that the Earth has warmed over the last century, but that the warming slowed dramatically and even stopped at points over the last 17 years.
National Oceanic and Atmospheric Administration has readjusted the data
But a paper released May 28 by researchers at the National Oceanic and Atmospheric Administration has readjusted the data in a way that makes the reduction in warming disappear, indicating a steady increase in temperature instead.
But the study's readjusted data conflict with many other climate measurements, including data taken by satellites, and some climate scientists aren't buying the new claim.
"While I'm sure this latest analysis from NOAA will be regarded as politically useful for the Obama administration, I don't regard it as a particularly useful contribution to our scientific understanding of what is going on," Judith Curry, a climate science professor at Georgia Tech, wrote in a response to the study.
"The new NOAA dataset disagrees with a UK dataset, which is generally regarded as the gold standard for global sea surface temperature datasets," she said.
"The new dataset also disagrees with ARGO buoys and satellite analyses."
-
EIKE Europäisches Institut für Klima und Energie
2016-01-24 de Die "Karlisierung" der Temperatur der Erde
-
Watts Up With That? (Antony Watts)
2016-01-21 en The 'Karlization' of Earth's Temperature
-
Gerald A. Meehl, National Center for Atmospheric Research
2015 en
Decadal climate variability and the early-2000s hiatus
-
Die kalte Sonne (Fritz Vahrenholt & Sebastian Lüning)
Frank Bosse und Fritz Vahrenholt
2016-02-09 de Die Sonne im Januar 2016, Rekorde und Ozeanströmungen: Der Golfstrom bleibt stabil!Das Rekordjahr 2015 und was dazu beitrug
Das Jahr 2015 endete mit einem Rekordwert: Die Temperaturreihe GISS verzeichnete +0,87 °C Anomalie gegenüber dem Referenzzeitraum 1951-1981.
Dies waren nochmals 0,13°C mehr als im Vorjahr 2014 global festgestellt wurde. Besonders stark stiegen die Ozeantemperaturen an.
Ein Blick zurück auf einen nur wenige Monate älteren Datensatz GISS vom Mai 2015 zeigt, dass die globalen Mitteltemperaturen 2014 damals noch um 0,06°C geringer angezeigt wurden als im Januar 2016.
Wie kann das sein? Im Sommer 2015 wurde eine Korrektur der Meerestemperaturen eingeführt, wir hatten u.a. hier darüber berichtet.
Der Auslöser:
Die Messmethoden zur Erfassung der Oberflächentemperaturen der Meere (SST- Sea Surface Temperature) änderten sich ab 1998.Wurden früher die SST von Schiffen aus bestimmt, oft indem die Wassertemperatur in Eimern oder über das angesaugte Kühlwasser gemessen wurde, ging man später zu präziseren Bojenmessungen über.
Dieser Übergang trug, so die Wissenschaftler um T. Karl von der NOAA, eine negative Verfälschung ein, die man mit Korrekturen (für die offensichtlich zu warmen Messungen der Vergangenheit nach unten, für die präzisen Messungen der Gegenwart nach oben) minimierte.
Diese Maßnahme wurde sehr schnell für die globalen Bodentemperatur-Reihen übernommen.
Es gibt hierfür nicht nur Beifall in der Fachwelt, wie unser Artikel "IPCC-Autor Gerald Meehl verurteilt fragwürdige Rettungsaktionen von Klimaaktivisten zur Erwärmungspause: Der Hiatus ist real und ist erklärungsbedürftig" zeigte.
Es erscheint recht fragwürdig, gute neuere Bojenmessungen nach oben zu verändern, um sie an die schlechten alten Eimermessungen anzupassen.
...
 NOAA in Not: Erwärmungspause der letzten 15 Jahre lässt sich nicht so
einfach wegtricksen
NOAA in Not: Erwärmungspause der letzten 15 Jahre lässt sich nicht so
einfach wegtricksen
Update: University of Alabama in Huntsville (UAH) lehnt fragwürdige Veränderungen am RSS-Satelliten-Temperaturdatensatz abEinfluss des El Nino
Einen deutlich höheren Einfluss auf die weltweiten Temperaturen sehen Sie in Abb. 4 im äquatorialen Pazifik: den bereits im November 2015 voll entwickelten ElNino.
Über die Entstehung und den Verlauf dieser internen Variabilität unseres Klimas hatten wir hier berichtet.
Bereits im Jahre 2014 kündigte er sich an, zumindest bis zum Mai.
Ab Anfang August 2014 war er abgesagt, wie wir hier meldeten.
Nun also kam er mit einiger Wucht in 2015 und bescherte den globalen Temperaturen im Jahr 2015 im Mittel einen Anstieg von ca. 0,09 °C.
Das viele rot in Abb. 4 hinterließ seine Spuren in den Troposphären-und Bodentemperaturen.
Alle genannten Beiträge zum Rekord in Summe belaufen sich auf ca. 0,16°C. Nach GISS hätten wir dann etwa die globalen Temperaturen des Vorjahres.
Der Rekord in 2015 ist also zu ganz großen Teilen auf natürliche Variabilität
und eine umstrittene Korrektur von Messdaten größtenteils der Vergangenheit zurückzuführen,
die die Trends ansteigen ließ, gewissermaßen "on top" auf die klimatische Entwicklung.
Im Übrigen zeigen die Satellitenmessungen der Troposphäre keinen Rekordanstieg : beide Messreihen, sowohl UAH als auch RSS, geben 2015 nur als drittwärmstes Jahr seit 1979 an.
Dass die Troposphärentemperaturen langsamer steigen als die Bodentemperaturen ist ein Sachverhalt, den die Klimamodelle nicht reproduzieren. Sie erwarten es genau anders herum.
...
Was erwarten wir von 2016?
Zunächst werden die Temperaturen weiter hoch bleiben.
Die Wärme des ElNino ist noch vorhanden: Sie schlägt sich in verstärkter Wolkenbildung im Ostpazifik nieder. Diese latente Wärme wird erst später in den Weltraum abgestrahlt.
Der ganze Vorgang sollte noch etwa 4-5 Monate dauern,
dann werden die globalen Temperaturen sinken.
Es kündigt sich dann nämlich eine LaNina an. Dies ist nicht etwa das Gegenteil eines ElNino mit seiner Strömungsumkehr.
Vielmehr sind es "verstärkte Normalbedingungen".
Die Passatwinde wehen heftiger als normal und fördern sehr viel kühles Tiefenwasser vor Südamerika an die Oberfläche.
Dadurch wird ein Teil des erwärmten Wassers eines ElNino wieder in die Tiefe vor Indonesien verfrachtet und in die Oberflächentemperaturen geht eine große Kaltwasserfläche im äquatorialen Teil des Pazifiks ein.
In die globalen Temperaturen wird dieser doch recht heftige Umschwung sehr wahrscheinlich erst in 2017 voll durchschlagen.
Für klimatische Einschätzungen wird es so auch in 2017 noch zu früh sein, denn erst nach der zu erwartenden LaNina wird sich ein "neutrales Niveau" einstellen.
Wo das liegt ist noch unbestimmt.
Entwarnung im Atlantik
Erinnern Sie sich noch an die medial so "ausführlich" ausgeschlachteten Meldungen vom Frühjahr 2015, dass sich der Golfstrom dramatisch abgeschwächt hat durch das Schmelzen des Grönlandeises?
Wir hatten uns hier sehr kritisch mit einer Arbeit (Rahmstorf 2015) von Stefan Rahmstorf vom PIK und Kollegen auseinandergesetzt, die den neuerlichen Hype auslöste.
Die Süddeutsche Zeitung beispielsweise vermied das Wort "Katastrophe", zitierte jedoch die Autoren, die ihrer Besorgnis Ausdruck verliehen, dass stark reduzierte Atlantikströme "massive Folgen" für Mensch und Umwelt haben, ergänzten die Forscher.
Die Ökosysteme in den Meeren könnten gestört werden, was die Fischerei und die Lebensgrundlage vieler Menschen entlang der Küsten treffe.
Auch trügen Veränderungen zu einem regionalen Meeresspiegelanstieg etwa in den US-Städten New York und Boston bei.
Zudem seien auch Wetterveränderungen sowohl in Nordamerika als auch in Europa denkbar."
Im Januar 2015 erschien nun eine Arbeit von Parker & Ollier, die die Schlüsse von Rahmstorf2015 entschieden zurückweist.
Wie wir in unserem Artikel damals schon zeigten hatte Rahmstorf 2015 einen Stellvertreter ("Proxy") für die Stärke der AMOC (Atlantic Meridional Overturning Circulation, der Wärmetransport nach Norden) verwendet, der bei näherer Betrachtung offensichtlich Schwierigkeiten mit der Kausalität hatte: er reagierte auf AMOC- Veränderungen bevor diese eintraten.
Die Autoren der widerlegenden Arbeit um Albert Parker von der James Cook- Universität in Townsville, Australien verwendeten einen vertrauenserweckenden Parameter, der auch kürzere Schwankungen der AMOC gut abbildet.
-
EIKE Europäisches Institut für Klima und Energie
Klaus-Eckart Puls
2016-02-17 de Klima-Fakten 2015/16Das Jahr 2015 wurde von den Klima-Alarmisten in bewährtem engen Schulterschluß mit den deutschen(!) Medien zum "wärmsten Jahr aller Zeiten" und zum "endgültigen Klimasignal" hoch gejubelt. Jedoch - die Nachprüfung zeigt:
Es war ein so genannter "Super-El-Nino",
der die Temperatur trieb - wie zuletzt 1998. Eine nahezu verzweifelte Aktion, um nach 18 Jahren der Temperatur-Stagnation eine angeblich anthropogen verursachte Klima-Katastrophen-Hypothese zu retten, anhand eines einzigen Jahres.
Alle anderen Parameter machen auch nicht mit:
Weder die Stürme, noch die Sturmfluten, noch der Meeres-Anstieg!
EIKE Europäisches Institut für Klima und Energie
Quang M. Nguyen, P.E.
2016-02-16 de Wärmer, noch wärmer, am wärmsten - NOAA und NASA erwischt mit der Manipulation der AufzeichnungenFAZIT
Wie so häufig von den Mainstream-Medien seit April 2015 wiederholt, erklärten NOAA und NASA offiziell, dass 2015 heißer als 2014 war, das alte wärmste Jahr der Aufzeichnungen und "versprechen", dass 2016 heißer als 2015 sein könnte!
Jedoch, unleugbare Beweise zeigen, dass die von NOAA und der NASA berechneten durchschnittlichen globalen Temperaturen ungenau, unzuverlässig und nicht mit den Satellitendaten konsistent erscheinen.
1997 war das heißeste Jahr
Laut Daten der NOAA Website, war 1997 wirklich das heißeste Jahr der Aufzeichnung mit 16,9°C (62.45°F).
Die globale Durchschnittstemperatur im Jahr 2015 betrug 14,8°C (58.62°F) oder 2,12K (3.83F) von unter der Temperatur 1997. [... und unter der "Normal" Temperatur von 15°C gemäß PIK u.ä., der Übersetzer]
Nach den Daten der NOAA Website, haben die Parameter wie beispielsweise die Durchschnittstemperatur des 20. Jahrhunderts und der jährlichen Temperaturanomalien, die konstant sein müssten, unterschiedliche Werte in den jährlichen globalen Analysen.
Korrigierte historische Temperaturdaten
NOAA und NASA korrigierten historische Temperaturdaten und stellten Temperaturdaten in Gebieten ohne Temperaturaufzeichnung systematisch her, weit verbreitet und unidirektional zum "kühlen" der Vergangenheit, in dem Versuch, einen steigenden Temperaturtrend zu beweisen.
NOAA und NASAm diskreditieren ihre eigenen Satellitendaten.
NOAA und der NASA haben Anstrengungen unternommen, um ihre eigenen Satellitendaten zu diskreditieren - die im Einklang mit dem Ballon Daten sind - weil eine globale Erwärmung Pause seit 1998 im Widerspruch mit der von NOAA und der NASA bevorzugten Behauptung steht.
NOAA und NASA weigern sich die angeforderten Daten heraus zugeben
NOAA und NASA haben sich geweigert, die durch das US-Repräsentantenhaus für Wissenschaft, Weltraum und Technologie angeforderten Daten und Informationen heraus zugeben.
Es gibt keinen Grund für sie die Daten und Informationen, die öffentlich zugänglich sind, zurückzuhalten, es sei denn, sie haben etwas zu verbergen.
↑
f NASA/GISS Hansen: Drei Jahrzente Datenanpassung
en
NASA/GISS Hansen: Three decades of Temperature Adjustments
|
|
|
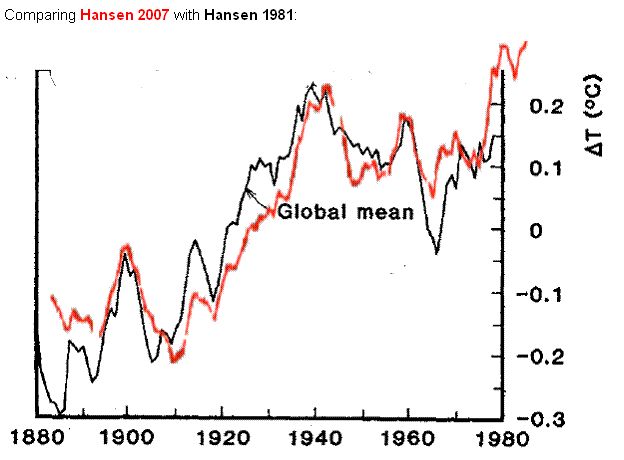
|
with 2010 almost 0.1°C warmer than the actual warmest year of 1998. |
and 2010 about 0.1°C cooler than the warmest year 1998. |
|
|
|


↑
g Wie wird die Abkühlung versteckt: 1940 Spitze löschen!
1940 wärmer als 1998 ? - Ja !
en
How To Hide Global Cooling: Delete The "1940's Blip"
1940 warmer than 1998 ? - Yes !
fr
Comment cacher le refroidissement: Effacer la pointe 1940!
1940 plus chaud que 1998 ? - Oui !
Mit folgenden Links wird von anderen Webseiten auf diese Seite verwiesen:
| de | en | fr |
|---|---|---|
|
Klima Probleme: Fehler I Temperatur-Manipulationen 1940 wärmer als 1998? - Ja ! |
Climate problems: Errors I Temperatur-Manipulationen 1940 warmer than 1998? - Yes ! |
Problèmes: Erreurs I Temperatur-Manipulationen 1940 plus chaud que 1998? - Oui ! |
- en How To Hide Global Cooling: Delete The "1940's Blip"
- de
Steigen die Arktis-Temperaturen wirklich auf ein Rekordhoch?
en Comments on "Arctic air temperatures climb to record levels - en ETH Zurich: Swiss Glaciers melted in the 1940's faster than today"
↑ en How To Hide Global Cooling: Delete The "1940's Blip"
|
A: Delete The "1940's Blip"
|
B: Warming Contradicted by Satellite Records
|
|
Look at the 1940's blip here, it is nothing. Was it really this low, or did the CRU con men use statistics to cool it way down, only to have to put the 'raw' data back into the later decades to make the temperature appear higher now than in the 1940's and 1950's? |
|
|
|
en Well, thanks to the CRU data dump we have some of their temp runs from 2008 and 2005. Let's look at the CRU Land Temp Data from some selected countries around the globe (and yes, I cherry picked them, but it was not hard since all countries nearby these saw similar patterns). |

-
The Strata-Sphere
2009-11-24 en How To Hide Global Cooling: Delete The "1940's Blip"
As I and others dive into the CRU data dump we learn more and more about how the Global Warming conspiracy was pulled off. We now know all you need to do to pull this off is statistically cover up true data that tells the wrong story with 'bad' data that tells the story you want to have told.
2009-12-03 en Climategate Escalating, Smoking Gun Could Be 1940's 'Blip'
-
E-mail
2009-09-27 en From: Tom Wigley To: Phil Jonesen If you look at the attached plot you will see that the land also shows the 1940s blip (as I'm sure you know).
So, if we could reduce the ocean blip by, say, 0.15 degC, then this would be significant for the global mean -- but we'd still have to explain the land blip.
I've chosen 0.15 here deliberately.This still leaves an ocean blip, and i think one needs to have some form of ocean blip to explain the land blip (via either some common forcing, or ocean forcing land, or vice versa, or all of these). When you look at other blips, the land blips are 1.5 to 2 times (roughly) the ocean blips -- higher sensitivity plus thermal inertia effects. My 0.15 adjustment leaves things consistent with this, so you can see where I am coming from.
Removing ENSO does not affect this.It would be good to remove at least part of the 1940s blip, but we are still left with "why the blip".
fr Quelques spéculations sur comment corriger les mesures des températures de surface des océans (SST) afin d'expliquer en partie la petite hausse des températures dans les années 1940.
Si tu regardes le graphique joint, tu remarqueras que les continents ont également connu cette petite anomalie des années 1940 (comme tu le sais sûrement).
Donc, si nous pouvions réduire l'anomalie océanique par, disons, 0,15° C, cela aurait alors un impact important sur la moyenne planétaire -- mais il faudrait toujours expliquer la petite anomalie continentale.
J'ai choisi 0,15 à dessein.Il restera toujours une petite hausse océanique, et je crois qu'il faut avoir un type de petite pointe océanique pour expliquer la petite anomalie continentale (via soit un type de forçage commun, soit l'océan qui force les continents, ou vice versa, ou tous à la fois). Si tu regardes les autres petites anomalies, les anomalies continentales sont 1,5 à 2 fois (approximativement) plus fortes que les anomalies océaniques -- plus grande sensibilité et effets de l'inertie thermique.
Mon ajustement de 0,15 rentre dans ces paramètres, tu vois donc ce que je veux dire.
Éliminer ENSO n'a pas d'effet sur ceci.Il serait bon d'éliminer au moins une partie de l'anomalie des années quarante, mais la question demeure «pourquoi cette petite anomalie».
| de | en | fr |
|---|---|---|
| Temperatur | Temperature | Température |
| Offizielle, weltweite, amtliche Temperaturbestimmungen | Official worldwide temperature measurement | Mesurages officielles des températures mondiales |
↑
Steigen die Arktis-Temperaturen wirklich auf ein Rekordhoch?
enComments on "Arctic air temperatures climb to record levels"
|
|
|
| de | en | fr |
|---|---|---|
|
Auswirkungen des Klimas Arktis (Nordpol) |
Effects of Climate Change Arctic (North Pole) |
Conséquences climatiques Arctique (Pôle Nord) |
| Temperaturen in der Arktis | Arctic Temperatures | Températures dans l'arctique |
| Meereis in der Arktis | Arctic Sea Ice | Banquise arctique |
↑ en ETH Zurich: Swiss Glaciers melted in the 1940's faster than today
|
|
|

| de | en | fr |
|---|---|---|
|
Auswirkungen des Klimas Gletscher |
Impacts of Climate Change Glaciers |
Impacts du changement climatique Glaciers |
↑ h UK Met Office Hadley Centre / Professor Phil Jones
UK Met Office Hadley Centre
|
|
|
|
|
|

|
|
en
Source: 2010-02-13 en BBC News |

| Phil Jones |
Director of the Climatic Research Unit (CRU) and a Professor in the
School of Environmental Sciences at the University of East Anglia in
Norwich
▶Phil Jones: Who is who (Aktivisten der anthropogenen Globalen Erwärmung) |
| de | en | fr |
|---|---|---|
|
Klimawandel: Probleme Temperatur-Manipulationen Skandal Manipulationen Teil I, II, III Climategate Institute, Who's who, Mails |
Climate change: Problems Temperature Manipulations Scandal Manipulations Part I, II, III Climategate Institutes, Who's who, Mails |
Climat: Problèmes Manipulation des températures Scandale Manipulations partie I, II, III Climategate Instituts, Qui est qui, Méls |
↑
i Das Hockeyschläger Diagramm
en The Hockey stick curve
fr La courbe en crosse de hockey
-
de Diese Annahmen für das Kyoto-Protokoll sind falsch
-
en These data used as basis for the Kyoto-protocol are wrong
-
fr Ces valeurs pris comme base du protocole de Kyoto sont fausses
|
|
de Aus der Panik-Küche en From the panic laboratory fr De la marmite des alarmistes
|
![]()
![]()

de Das Holozän en The Holocene fr Le holocène
|
|
||||||
|

![]() Die unterschlagene historische COMNISPA-Temperaturkurve
Die unterschlagene historische COMNISPA-Temperaturkurve
![]()
![]() Temperaturentwicklung der letzten 2000 Jahre auf der außertropischen
Nordhemisphäre
Temperaturentwicklung der letzten 2000 Jahre auf der außertropischen
Nordhemisphäre
RWP = Roman Warm Period
DACP = Dark Ages Cold Period
MWP = Medieval Warm Period
LIA = Little Ice Age
CWP = Modern Warm Period
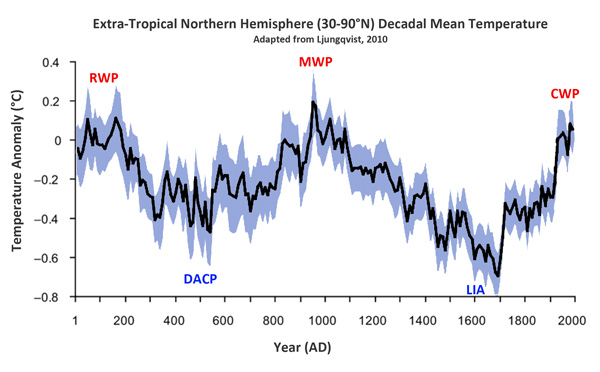
![]()
![]() Wassertemperaturen der vergangenen 2000 Jahre
Wassertemperaturen der vergangenen 2000 Jahre

↑
j Als das IPCC das Mittelalterliche Klimaoptimum verschwinden ließ
en IPCC changed viewpoint on the MWP in 2001
fr Comme le GIEC avait disparu le Optimum médiéval climatique
![]() de
de
![]() en
en
![]()
MWP = Medieval Warm Period (Mittelalterliche Warmzeit)
LIA = Little Ice Age (Kleine Eiszeit)
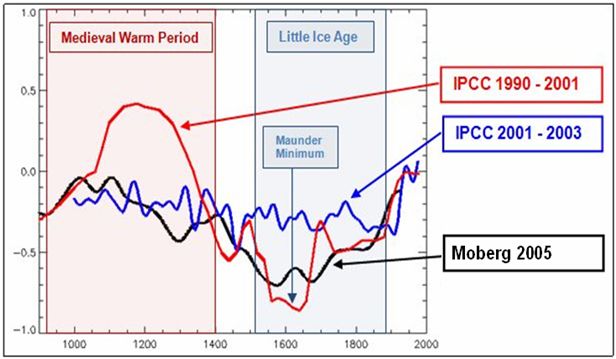
![]()
![]()
The "Hockey stick" curve
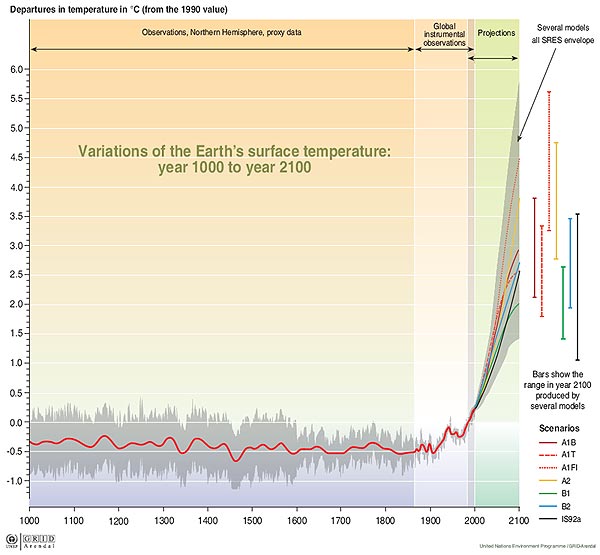
Ab 2001 verschwindet dieses geschichtlich belegte Phänomen.
-
Klimaskeptiker Info
2010-03-10 de Als das IPCC das Mittelalterliche Klimaoptimum verschwinden ließ...In älteren Veröffentlichungen des IPCC war das Mittelalterliche Klimaoptimum (Medieval Warm Period, MWP) enthalten.
Ab 2001 verschwindet dieses geschichtlich belegte Phänomen.
Es paßte nicht zu der Behauptung, die Erwärmung des 20. Jahrhunderts sei beispiellos gewesen.
Im Jahr 2001 reflektierte die Darstellung einer MWP die Mehrheitsmeinung innerhalb der Paläoklimatologie.
Das IPCC aber verbreitete ab 2001 einen neuen Standpunkt.
In der Folge erschienen mehrere Studien, die die Nichtexistenz des Mittelalterlichen Klimaoptimums bestätigte.Nach ClimateGate gibt es den Verdacht, daß bestimmte IPCC-verbundene Wissenschaftler wie Phil Jones das Erscheinen bzw. Nicht-Erscheinen von Studien manipuliert haben, um ihren Standpunkt der beispiellosen anthropogenen Erwärmung zu untermauern.
IPCC oder ihm nahestehende Personen haben also die wissenschaftliche Arbeit kontrolliert oder manipuliert.
Fazit: Die IPCC-Berichte haben mit seriöser Wissenschaft nichts zu tun.
Diese Veröffentlichungen sind nichts als bloße politische Propaganda.
-
Hide the decline
2010-03-08 en IPCC changed viewpoint on the MWP in 2001 - did this have effect on scientific results?
-
2006-12-06 en
"We have to get rid of the Medieval Warm Period!"
Video of Dr David Deming's statement to the U.S. Senate Committee on Environment & Public Works on December 6, 2006.
Dr Deming reveals that in 1995 a leading scientist emailed him saying "We have to get rid of the Medieval Warm Period".
A few years later, Michael Mann and the IPCC did just that by publishing the now throughly discredited hockey stick graph.
⇧ 2018
↑
NOAA-Datenmanipulation um 1,4°C:
"Schlimmer kann Wissenschaft nicht degenerieren"
en
NOAA 2.5 Degrees F Data Tampering -
'Science Doesn't Get Any Worse Than This'
![]()
![]() Man beachte die blauen tatsächlichen Messungen: Kaum Erwärmung.
Man beachte die blauen tatsächlichen Messungen: Kaum Erwärmung.
Dann betrachte man die in rot dargestellten adjustierten Daten:
so sollte ein globaler Erwärmungstrend aussehen.
Ein globaler Fake-Erwärmungstrend, heißt das.
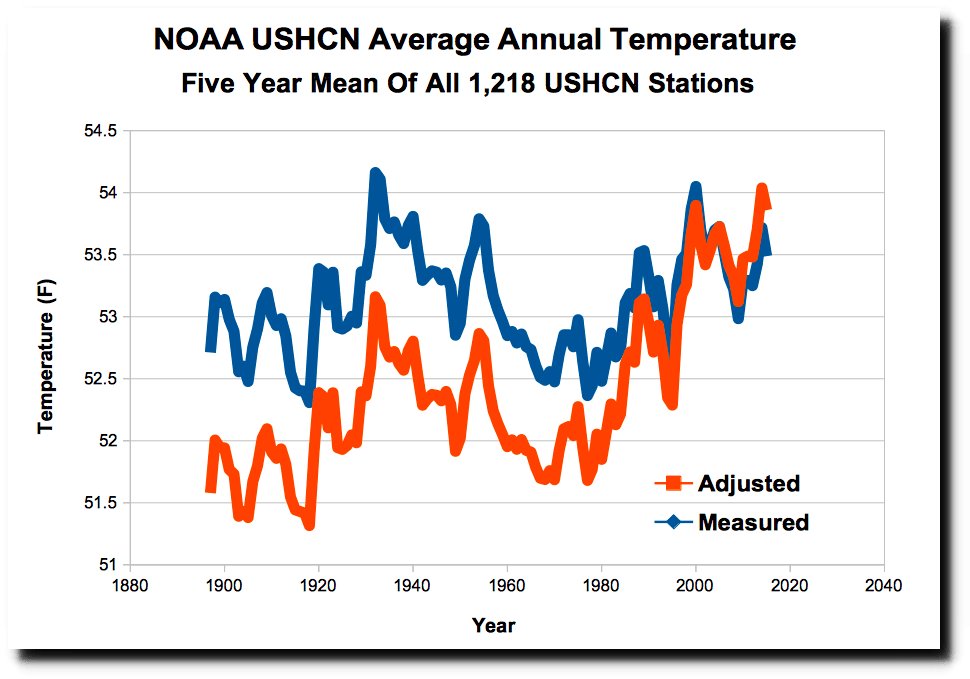
-
EIKE Europäisches Institut für Klima und Energie
James Delingpole / Chris Frey
2018-03-28 de NOAA-Datenmanipulation um 1,4°C: "Schlimmer kann Wissenschaft nicht degenerieren"Die Datenmanipulationen bei der NOAA sind sogar noch viel schlimmer als wir bisher dachten:
Während des vorigen Jahrhunderts wurde die "globale Erwärmung" in den USA um bis zu 1,4°C* übertrieben!Mit anderen Worten, so gut wie die gesamte, von den Torwächtern der weltweit führenden Temperaturaufzeichnungen "gemessene" Erwärmung könnte ein Fake sein.
-
Breitbart James Delingpole
2018-03-21 en Delingpole: NOAA 2.5 Degrees F Data Tampering - 'Science Doesn't Get Any Worse Than This'The data tampering at National Oceanic and Atmospheric Administration (NOAA) is even worse than we thought:
over the last century it has exaggerated "global warming" in the U.S. by as much as 2.5 degrees F.In other words, pretty much the entirety of the 20th century warming in the U.S. "measured" by the world's primary temperature record gatekeeper may be fake.
Quelle / Source:
-
The Deplorable Climate Science Blog / Tony Heller
2018-03-20 en NOAA Data Tampering Approaching 2.5 Degrees FNOAA's US temperature record shows that US was warmest in the 1930's and has generally cooled as CO2 has increased.
This wrecks greenhouse gas theory, so they "adjust" the data to make it look like the US is warming.
Science doesn't get any worse than how NOAA handles US
temperature data.
NASA uses the NOAA data as the basis for their temperature graphs, which have also been massively altered to turn cooling into warming.
⇧ 2017
↑ Temperaturdatenmanipulation von GISS (NASA) erneut nachgewiesen
-
2017-06-09 en
NASA manipuliert Klima-Daten !
-
EIKE Europäisches Institut für Klima und Energie
2017-06-12 de Temperaturdatenmanipulation von GISS (NASA) erneut nachgewiesenManipulation der Temperaturdaten
Seit langem ist bekannt, dass das das zur NASA gehörende Goddard Institute for Space Sciences (GISS) die weltweiten Temperaturdaten manipuliert.
Und zwar fast ausschließlich so, dass heute eine stärkerer Erwärmung erkennbar sein soll.
Zugleich wird auch kein nachvollziehbarer Grund für diese ständige Manipulation angegeben.

Damit sind diese Daten für die Klimawissenschaft wertlos.
Doch selten konnten diese Manipulationen so eindeutig und vor allem so einprägsam und daher auch für Laien überzeugend gezeigt werden, wie in diesem Ausschnitt aus dem Recherche-Video "Schulbuch belegt Schwindel mit Globaler Erwärmung".
↑ en Robust Evidence NOAA Temperature Data Hopelessly Corrupted By Warming Bias, Manipulation
-
NoTricksZone (Pierre L. Gosselin)
Kenneth Richard
2017-01-30 en Robust Evidence NOAA Temperature Data Hopelessly Corrupted By Warming Bias, ManipulationDr. Thomas Karl recently retired as Director of the National Oceanic and Atmospheric Administration (NOAA).
In 1989, Karl's stated position was that global temperatures cooled between 1921 and 1979.
"Analysis of warming since 1881 shows most of the increase in global temperature happened before 1919 - before the more recent sharp rise in the amount of carbon dioxide in the atmosphere, said Thomas Karl of the National Oceanic and Atmospheric Administration's National Climatic Data Center in Asheville, N.C.
While global climate warmed overall since 1881, it actually cooled from 1921 to 1979, Karl said."
Today, not only has the 1921-1979 cooling disappeared from NOAA's official temperature record,
it has been replaced by a +0.45°C warming trend during that nearly 60-year period.
Conclusion
The global temperature dataset available from NOAA suffers from massive and uncorrected warm biases (as preferred by its purveyors), woefully inadequate contemporary measurement coverage, and even worse historical coverage (with inherently non-uniform data collection methodologies).
Consequently, a substantial portion of the temperature data available from NOAA should be regarded as artificial and untrustworthy.
Those who faithfully uphold NOAA's global temperature dataset as "truth" will need to address its demonstrable speciousness - and why they are inclined to believe in it anyway.
⇧ 2015
↑
NOAA in Not: Erwärmungspause der letzten 15 Jahre lässt sich nicht
so einfach wegtricksen
en NOAA erases 'pause' in warming
2015: NOAA Data Tampering Since Last Year
|
|
|
-
Die kalte Sonne (Fritz Vahrenholt & Sebastian Lüning)
2015-12-09 de IPCC-Autor Gerald Meehl verurteilt fragwürdige Rettungsaktionen von Klimaaktivisten zur Erwärmungspause: Der Hiatus ist real und ist erklärungsbedürftig2015-07-02 de NOAA in Not: Erwärmungspause der letzten 15 Jahre lässt sich nicht so einfach wegtricksen
2015-06-15 de Max Planck Gesellschaft: "Die Temperaturen stagnieren ungefähr seit 1998, wenn auch auf hohem Niveau"
-
Watts Up With That? (Antony Watts)
2015-06-09 en Climate scientists criticize government paper (Karl et al. 2015) that erases 'pause' in warmingUntil last week, government data on climate change indicated that the Earth has warmed over the last century, but that the warming slowed dramatically and even stopped at points over the last 17 years.
National Oceanic and Atmospheric Administration has readjusted the data
But a paper released May 28 by researchers at the National Oceanic and Atmospheric Administration has readjusted the data in a way that makes the reduction in warming disappear, indicating a steady increase in temperature instead.
But the study's readjusted data conflict with many other climate measurements, including data taken by satellites, and some climate scientists aren't buying the new claim.
"While I'm sure this latest analysis from NOAA will be regarded as politically useful for the Obama administration, I don't regard it as a particularly useful contribution to our scientific understanding of what is going on," Judith Curry, a climate science professor at Georgia Tech, wrote in a response to the study.
"The new NOAA dataset disagrees with a UK dataset, which is generally regarded as the gold standard for global sea surface temperature datasets," she said.
"The new dataset also disagrees with ARGO buoys and satellite analyses."
-
EIKE Europäisches Institut für Klima und Energie
2016-01-24 de Die "Karlisierung" der Temperatur der Erde
-
Watts Up With That? (Antony Watts)
2016-01-21 en The 'Karlization' of Earth's Temperature
-
Gerald A. Meehl, National Center for Atmospheric Research
2015 en
Decadal climate variability and the early-2000s hiatus
-
Die kalte Sonne (Fritz Vahrenholt & Sebastian Lüning)
Frank Bosse und Fritz Vahrenholt
2016-02-09 de Die Sonne im Januar 2016, Rekorde und Ozeanströmungen: Der Golfstrom bleibt stabil!Das Rekordjahr 2015 und was dazu beitrug
Das Jahr 2015 endete mit einem Rekordwert: Die Temperaturreihe GISS verzeichnete +0,87 °C Anomalie gegenüber dem Referenzzeitraum 1951-1981.
Dies waren nochmals 0,13°C mehr als im Vorjahr 2014 global festgestellt wurde. Besonders stark stiegen die Ozeantemperaturen an.
Ein Blick zurück auf einen nur wenige Monate älteren Datensatz GISS vom Mai 2015 zeigt, dass die globalen Mitteltemperaturen 2014 damals noch um 0,06°C geringer angezeigt wurden als im Januar 2016.
Wie kann das sein? Im Sommer 2015 wurde eine Korrektur der Meerestemperaturen eingeführt, wir hatten u.a. hier darüber berichtet.
Der Auslöser:
Die Messmethoden zur Erfassung der Oberflächentemperaturen der Meere (SST- Sea Surface Temperature) änderten sich ab 1998.Wurden früher die SST von Schiffen aus bestimmt, oft indem die Wassertemperatur in Eimern oder über das angesaugte Kühlwasser gemessen wurde, ging man später zu präziseren Bojenmessungen über.
Dieser Übergang trug, so die Wissenschaftler um T. Karl von der NOAA, eine negative Verfälschung ein, die man mit Korrekturen (für die offensichtlich zu warmen Messungen der Vergangenheit nach unten, für die präzisen Messungen der Gegenwart nach oben) minimierte.
Diese Maßnahme wurde sehr schnell für die globalen Bodentemperatur-Reihen übernommen.
Es gibt hierfür nicht nur Beifall in der Fachwelt, wie unser Artikel "IPCC-Autor Gerald Meehl verurteilt fragwürdige Rettungsaktionen von Klimaaktivisten zur Erwärmungspause: Der Hiatus ist real und ist erklärungsbedürftig" zeigte.
Es erscheint recht fragwürdig, gute neuere Bojenmessungen nach oben zu verändern, um sie an die schlechten alten Eimermessungen anzupassen.
...
NOAA in Not: Erwärmungspause der letzten 15 Jahre lässt sich nicht so
einfach wegtricksen
Update: University of Alabama in Huntsville (UAH) lehnt fragwürdige Veränderungen am RSS-Satelliten-Temperaturdatensatz abEinfluss des El Nino
Einen deutlich höheren Einfluss auf die weltweiten Temperaturen sehen Sie in Abb. 4 im äquatorialen Pazifik: den bereits im November 2015 voll entwickelten ElNino.
Über die Entstehung und den Verlauf dieser internen Variabilität unseres Klimas hatten wir hier berichtet.
Bereits im Jahre 2014 kündigte er sich an, zumindest bis zum Mai.
Ab Anfang August 2014 war er abgesagt, wie wir hier meldeten.
Nun also kam er mit einiger Wucht in 2015 und bescherte den globalen Temperaturen im Jahr 2015 im Mittel einen Anstieg von ca. 0,09 °C.
Das viele rot in Abb. 4 hinterließ seine Spuren in den Troposphären-und Bodentemperaturen.
Alle genannten Beiträge zum Rekord in Summe belaufen sich auf ca. 0,16°C. Nach GISS hätten wir dann etwa die globalen Temperaturen des Vorjahres.
Der Rekord in 2015 ist also zu ganz großen Teilen auf natürliche Variabilität
und eine umstrittene Korrektur von Messdaten größtenteils der Vergangenheit zurückzuführen,
die die Trends ansteigen ließ, gewissermaßen "on top" auf die klimatische Entwicklung.
Im Übrigen zeigen die Satellitenmessungen der Troposphäre keinen Rekordanstieg : beide Messreihen, sowohl UAH als auch RSS, geben 2015 nur als drittwärmstes Jahr seit 1979 an.
Dass die Troposphärentemperaturen langsamer steigen als die Bodentemperaturen ist ein Sachverhalt, den die Klimamodelle nicht reproduzieren. Sie erwarten es genau anders herum.
...
Was erwarten wir von 2016?
Zunächst werden die Temperaturen weiter hoch bleiben.
Die Wärme des ElNino ist noch vorhanden: Sie schlägt sich in verstärkter Wolkenbildung im Ostpazifik nieder. Diese latente Wärme wird erst später in den Weltraum abgestrahlt.
Der ganze Vorgang sollte noch etwa 4-5 Monate dauern,
dann werden die globalen Temperaturen sinken.
Es kündigt sich dann nämlich eine LaNina an. Dies ist nicht etwa das Gegenteil eines ElNino mit seiner Strömungsumkehr.
Vielmehr sind es "verstärkte Normalbedingungen".
Die Passatwinde wehen heftiger als normal und fördern sehr viel kühles Tiefenwasser vor Südamerika an die Oberfläche.
Dadurch wird ein Teil des erwärmten Wassers eines ElNino wieder in die Tiefe vor Indonesien verfrachtet und in die Oberflächentemperaturen geht eine große Kaltwasserfläche im äquatorialen Teil des Pazifiks ein.
In die globalen Temperaturen wird dieser doch recht heftige Umschwung sehr wahrscheinlich erst in 2017 voll durchschlagen.
Für klimatische Einschätzungen wird es so auch in 2017 noch zu früh sein, denn erst nach der zu erwartenden LaNina wird sich ein "neutrales Niveau" einstellen.
Wo das liegt ist noch unbestimmt.
Entwarnung im Atlantik
Erinnern Sie sich noch an die medial so "ausführlich" ausgeschlachteten Meldungen vom Frühjahr 2015, dass sich der Golfstrom dramatisch abgeschwächt hat durch das Schmelzen des Grönlandeises?
Wir hatten uns hier sehr kritisch mit einer Arbeit (Rahmstorf 2015) von Stefan Rahmstorf vom PIK und Kollegen auseinandergesetzt, die den neuerlichen Hype auslöste.
Die Süddeutsche Zeitung beispielsweise vermied das Wort "Katastrophe", zitierte jedoch die Autoren, die ihrer Besorgnis Ausdruck verliehen, dass stark reduzierte Atlantikströme "massive Folgen" für Mensch und Umwelt haben, ergänzten die Forscher.
Die Ökosysteme in den Meeren könnten gestört werden, was die Fischerei und die Lebensgrundlage vieler Menschen entlang der Küsten treffe.
Auch trügen Veränderungen zu einem regionalen Meeresspiegelanstieg etwa in den US-Städten New York und Boston bei.
Zudem seien auch Wetterveränderungen sowohl in Nordamerika als auch in Europa denkbar."
Im Januar 2015 erschien nun eine Arbeit von Parker & Ollier, die die Schlüsse von Rahmstorf2015 entschieden zurückweist.
Wie wir in unserem Artikel damals schon zeigten hatte Rahmstorf 2015 einen Stellvertreter ("Proxy") für die Stärke der AMOC (Atlantic Meridional Overturning Circulation, der Wärmetransport nach Norden) verwendet, der bei näherer Betrachtung offensichtlich Schwierigkeiten mit der Kausalität hatte: er reagierte auf AMOC- Veränderungen bevor diese eintraten.
Die Autoren der widerlegenden Arbeit um Albert Parker von der James Cook- Universität in Townsville, Australien verwendeten einen vertrauenserweckenden Parameter, der auch kürzere Schwankungen der AMOC gut abbildet.
-
EIKE Europäisches Institut für Klima und Energie
Klaus-Eckart Puls
2016-02-17 de Klima-Fakten 2015/16Das Jahr 2015 wurde von den Klima-Alarmisten in bewährtem engen Schulterschluß mit den deutschen(!) Medien zum "wärmsten Jahr aller Zeiten" und zum "endgültigen Klimasignal" hoch gejubelt. Jedoch - die Nachprüfung zeigt:
Es war ein so genannter "Super-El-Nino",
der die Temperatur trieb - wie zuletzt 1998. Eine nahezu verzweifelte Aktion, um nach 18 Jahren der Temperatur-Stagnation eine angeblich anthropogen verursachte Klima-Katastrophen-Hypothese zu retten, anhand eines einzigen Jahres.
Alle anderen Parameter machen auch nicht mit:
Weder die Stürme, noch die Sturmfluten, noch der Meeres-Anstieg!
EIKE Europäisches Institut für Klima und Energie
Quang M. Nguyen, P.E.
2016-02-16 de Wärmer, noch wärmer, am wärmsten - NOAA und NASA erwischt mit der Manipulation der AufzeichnungenFAZIT
Wie so häufig von den Mainstream-Medien seit April 2015 wiederholt, erklärten NOAA und NASA offiziell, dass 2015 heißer als 2014 war, das alte wärmste Jahr der Aufzeichnungen und "versprechen", dass 2016 heißer als 2015 sein könnte!
Jedoch, unleugbare Beweise zeigen, dass die von NOAA und der NASA berechneten durchschnittlichen globalen Temperaturen ungenau, unzuverlässig und nicht mit den Satellitendaten konsistent erscheinen.
1997 war das heißeste Jahr
Laut Daten der NOAA Website, war 1997 wirklich das heißeste Jahr der Aufzeichnung mit 16,9°C (62.45°F).
Die globale Durchschnittstemperatur im Jahr 2015 betrug 14,8°C (58.62°F) oder 2,12K (3.83F) von unter der Temperatur 1997. [... und unter der "Normal" Temperatur von 15°C gemäß PIK u.ä., der Übersetzer]
Nach den Daten der NOAA Website, haben die Parameter wie beispielsweise die Durchschnittstemperatur des 20. Jahrhunderts und der jährlichen Temperaturanomalien, die konstant sein müssten, unterschiedliche Werte in den jährlichen globalen Analysen.
Korrigierte historische Temperaturdaten
NOAA und NASA korrigierten historische Temperaturdaten und stellten Temperaturdaten in Gebieten ohne Temperaturaufzeichnung systematisch her, weit verbreitet und unidirektional zum "kühlen" der Vergangenheit, in dem Versuch, einen steigenden Temperaturtrend zu beweisen.
NOAA und NASAm diskreditieren ihre eigenen Satellitendaten.
NOAA und der NASA haben Anstrengungen unternommen, um ihre eigenen Satellitendaten zu diskreditieren - die im Einklang mit dem Ballon Daten sind - weil eine globale Erwärmung Pause seit 1998 im Widerspruch mit der von NOAA und der NASA bevorzugten Behauptung steht.
NOAA und NASA weigern sich die angeforderten Daten heraus zugeben
NOAA und NASA haben sich geweigert, die durch das US-Repräsentantenhaus für Wissenschaft, Weltraum und Technologie angeforderten Daten und Informationen heraus zugeben.
Es gibt keinen Grund für sie die Daten und Informationen, die öffentlich zugänglich sind, zurückzuhalten, es sei denn, sie haben etwas zu verbergen.
↑ en Black Swan Climate Theory
In this five part video series, Engineering Physicist Michael W. Brakey discusses the corrupt data being provided by the National Oceanic and Atmospheric Association in order to promote the theory of Global Warming.
![]()
![]() "Get Out Of Adjusting Business !
"Get Out Of Adjusting Business !
Grün/Green (local source): Lewiston-Auburn area of Maine
Schwarz/Black (NOAA 2013): Maine's overall state
Blau/Blue (NOAA 2014)
(3° Fahrenheit ≅ 1,5° Celsius)
-
EIKE Europäisches Institut fü Klima und Energie
2015-05-12 de Black Swan Climate Theory
-
NoTricksZone (Pierre L. Gosselin)
2015-05-09 en Energy Physicist Implores NOAA To Return To Credibility "Get Out Of Adjusting Business !
-
NoTricksZone (Pierre L. Gosselin)
2015-06-01 en Bombshell: Comprehensive Analysis Reveals NOAA Wrongfully Applying "Master Algorithm" To Whitewash Temperature History
-
NoTricksZone (Pierre L. Gosselin)
2015-07-07 en NOAA's Data Debacle ... Alterations Ruin 120 Years Of Painstakingly Collected Weather Data (Part 2/2)
↑
NOAA versteckt die Rohdaten hinter einem Viertel-Millionen-Dollar
Schutzwall
en
NOAA demands $262,000 fee for looking at their 'public' data
-
Die kalte Sonne (Fritz Vahrenholt & Sebastian Lüning)
2015-04-17 de Verdacht auf Temperaturdatenmanipulation: NOAA versteckt die Rohdaten hinter einem antklimatischen Viertel-Millionen-Dollar Schutzwall
-
Watts Up With That? (Antony Watts)
2015-03-27 en Outrageous: NOAA demands $262,000 fee for looking at their 'public' data
⇧ 2011
↑
Wärmegehalt der Ozeane ist geringer als bisher gedacht
en
Ocean Heat Content Adjustments: Follow-up and More Missing Heat
![]()
![]()
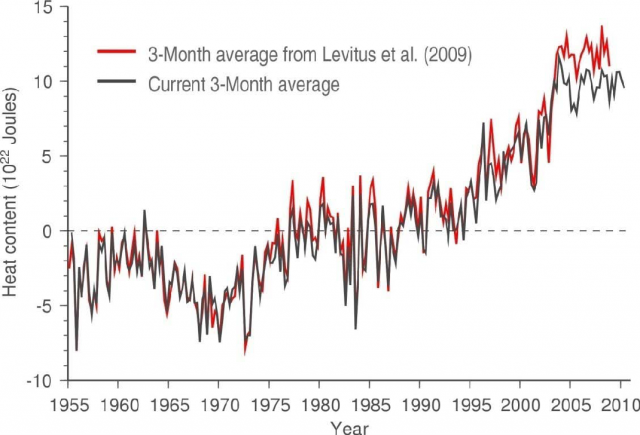
-
Klimaskeptiker Info
2011-03-20 de Wärmegehalt der Ozeane ist geringer als bisher gedacht
-
Watts Up With That? (Antony Watts)
2011-03-20 en Ocean Heat Content Adjustments: Follow-up and More Missing Heat
Update
![]()
![]()
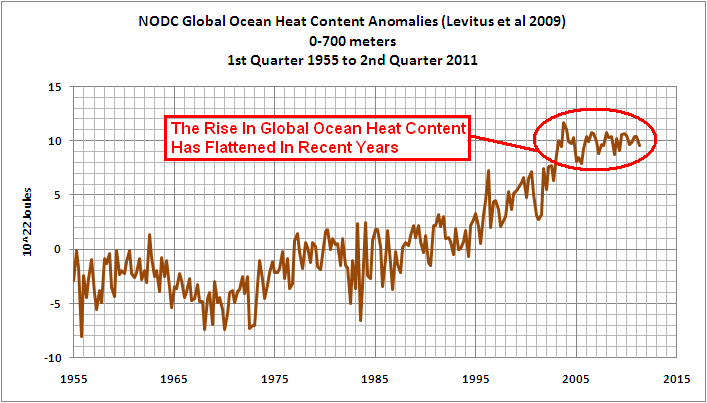
![]()
![]()
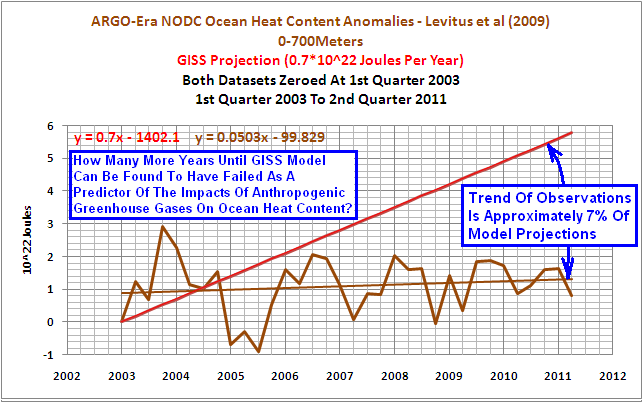
-
Watts Up With That? (Antony Watts)
2011-09-18 en Trenberth's missing heat? Look to the deep
⇧
8 Sonnenaktivität
en Solar activity
fr Activité solaire
↑ en a Solar Cycle / Sunspot Number Progression
|
|
|
|
|

↑
b Neuste Meldungen über die Sonnenaktivität
en News on the activity of the Sun
fr Nouvelles informations sur l'activité du soleil
↑ Die Sonne im Juli 2019: Die Erde wird grüner - die ausbleibende Katastrophe
-
Die kalte Sonne (Fritz Vahrenholt & Sebastian Lüning)
Fritz Vahrenholt und Frank Bosse
2019-08-29 de Die Sonne im Juli 2019, Teil 1/2
![]()
![]()
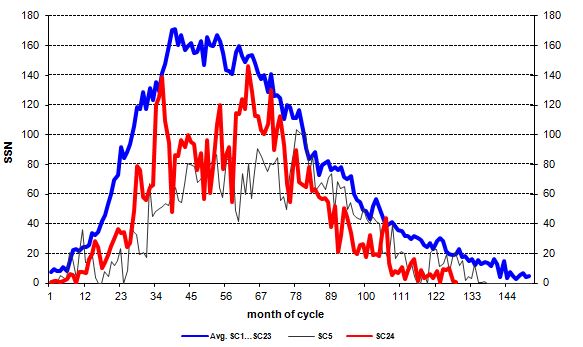
-
Die kalte Sonne (Fritz Vahrenholt & Sebastian Lüning)
Fritz Vahrenholt und Frank Bosse
2019-08-29 de Die Erde wird grüner - die ausbleibende Katastrophe
Fritz Vahrenholt und Frank Bosse, Teil 2/2 von "Die Sonne im Juli 2019"
Die grüner werdende Erde saugt das CO₂ auf
Für die Klimamodelle ist die Senkendiskussion von zentraler Bedeutung.
Und nun, 6 Jahre nach dem Bericht des IPCC vom Jahre 2013, stellt sich heraus, dass die Modelle vollständig daneben lagen, in dem sie die Aufnahmefähigkeit von Ozean und Land dramatisch unterschätzten.
Die Erde wird grüner - Implikationen für den Kohlenstoffkreislauf
Eine der entscheidenden Fragen hinsichtlich der weiteren Entwicklung der CO₂-Konzentration in der Atmosphäre, ist der Einfluss der CO₂-Senken.
Wie groß ist die CO₂-Aufnahme durch die Ozeane und an Land, dort maßgeblich also durch die Pflanzenwelt?
Jahr für Jahr stößt die Menschheit mehr CO₂ aus als zuvor.
Waren es 1959 noch 8,5 Milliarden Tonnen sind es heute schon etwa 37 Milliarden Tonnen.
Und egal wie hoch die Emissionen wurden, zunächst knapp die Hälfte, heute mehr als die Hälfte der Emissionen wurden durch die Ozeane und das vermehrte Pflanzenwachstum aufgesogen.
Das ist sogar im letzten IPCC-Bericht von 2013 nachzulesen (Summary for policymakers, S.26).
Allerdings wird in den vom IPCC zugrunde gelegten Modellen die zukünftige Aufnahmefähigkeit des CO₂ in Frage gestellt.
Auf der gleichen Seite 26 heißt es: "Basierend auf Erdsystem-Modellen, gibt es hohe Konfidenz, dass das feedback zwischen Klimaentwicklung und Kohlenstoffkreislauf im 21. Jahrhundert positiv ist.
Als Resultat wird mehr des emittierten anthropogenen CO₂ in der Atmosphäre verbleiben."
IPCC-Bericht von 2013
en
Summary for Policymakers
E.7 Carbon and Other Biogeochemical Cycles
• Ocean uptake of anthropogenic CO₂ will continue under all four RCPs through to 2100, with higher uptake for higher concentration pathways (very high confidence).
The future evolution of the land carbon uptake is less certain.
A majority of models projects a continued land carbon uptake under all RCPs, but some models simulate a land carbon loss due to the combined effect of climate change and land use change. {6.4}
• Based on Earth System Models, there is high confidence that the feedback between climate and the carbon cycle is positive in the 21st century; that is, climate change will partially offset increases in land and ocean carbon sinks caused by rising atmospheric CO₂.
As a result more of the emitted anthropogenic CO₂ will remain in the atmosphere.
A positive feedback between climate and the carbon cycle on century to millennial time scales is supported by paleoclimate observations and modelling. {6.2, 6.4}
Mit der hohen Konfidenz, mit der die abnehmende Aufnahmefähigkeit der Biosphäre und der Ozeane durch den IPCC prognostiziert wurde, ist es vorerst vorbei.
Denn das Global Carbon Project, an dem unter anderem die UN-Organisation WMO (World Meteorological Organisation) beteiligt ist, zeigt in seinem vor kurzem erschienenen Bericht,
dass die Pflanzenwelt mehr CO₂ aufnimmt als gedacht.
Die Forscher fanden, dass "globale Land- und Ozeansenken im Großen und ganzen Schritt gehalten haben mit den wachsenden CO₂- Emissionen seit 1958,
da sie 60 Jahre später immer noch rund 50 % des in die Atmosphäre abgegebenen CO₂ aufnehmen.
Global Carbon Project / Future Earth
Long-term data on atmospheric carbon dioxide reveals an
intensification of carbon uptake by Northern Hemisphere vegetation
Northern Hemisphere vegetation has kept pace in absorbing increasing amounts of carbon dioxide in the atmosphere due to human activities over the last 60 years, partially offsetting the effects of global warming.
Scientists analyzed data since 1958 that showed the Northern Hemisphere land sink, mainly forests, had intensified its absorption as plants thrived due to more CO₂ in the atmosphere.
Accelerated increases in fossil fuel emissions during the 2000s, due to increased economic output from countries in east and south Asia, caused a group international scientists to examine if land and ocean sinks would be able to keep up with this increase in atmospheric CO₂.
On average, global lands and oceans have been known to absorb as much as 50 percent of the CO₂ emitted from human activities.
These are known as carbon sinks.
The portion left over in the atmosphere is known as the airborne fraction.
As more and more CO₂ has entered the atmosphere, the scientists suspected the airborne fraction could have increased over this time, as plants, soils, and oceans may not have been able absorb the same percentage of CO₂ as in the past.
What they found was that global land and ocean sinks have largely kept pace with increasing carbon dioxide emissions since 1958, as 60 years later they are still absorbing about 50 percent of atmospheric CO₂.
This intensification of absorption can be traced to the Northern Hemisphere land sink responding to continued emissions growth, mainly through forests.
Pep Canadell, co-author of the new paper and Executive Director of the Global Carbon Project at CSIRO, Australia, finds these results so remarkable because of their unseen, and often unacknowledged, benefits:
"The CO₂ sinks are like a 50 percent discount on climate change.
If it wasn't for the sinks, we would have double the accumulation of CO₂ in the atmosphere, and a doubling of the impacts due to global warming."
Diese Intensivierung der Absorption kann zurückverfolgt werden auf die in der Nordhemisphäre gelegenen Landsenken, die auf die wachsenden Emissionen reagieren, vor allen Dingen durch Wälder."
Die Nordhemisphäre beheimatet ungefähr zwei Drittel der Landfläche und der Vegetation der Erde, während die Südhemisphäre durch die Ozeansenken bestimmt wird.
Das Global Carbon Project stellt also von 1958 bis 2016 eine Intensivierung der Aufnahme in der Nord- Hemisphäre fest.
Die vom IPCC behauptete Abnahme der Aufnahmefähigkeit hat sich zumindest bis heute durch neuere Untersuchungen nicht bestätigt, eher im Gegenteil.
Zur Zukunft kommen wir weiter unten.
![]()
![]() Abbildung 4
Abbildung 4
Die CO₂- Bilanz bis 2018
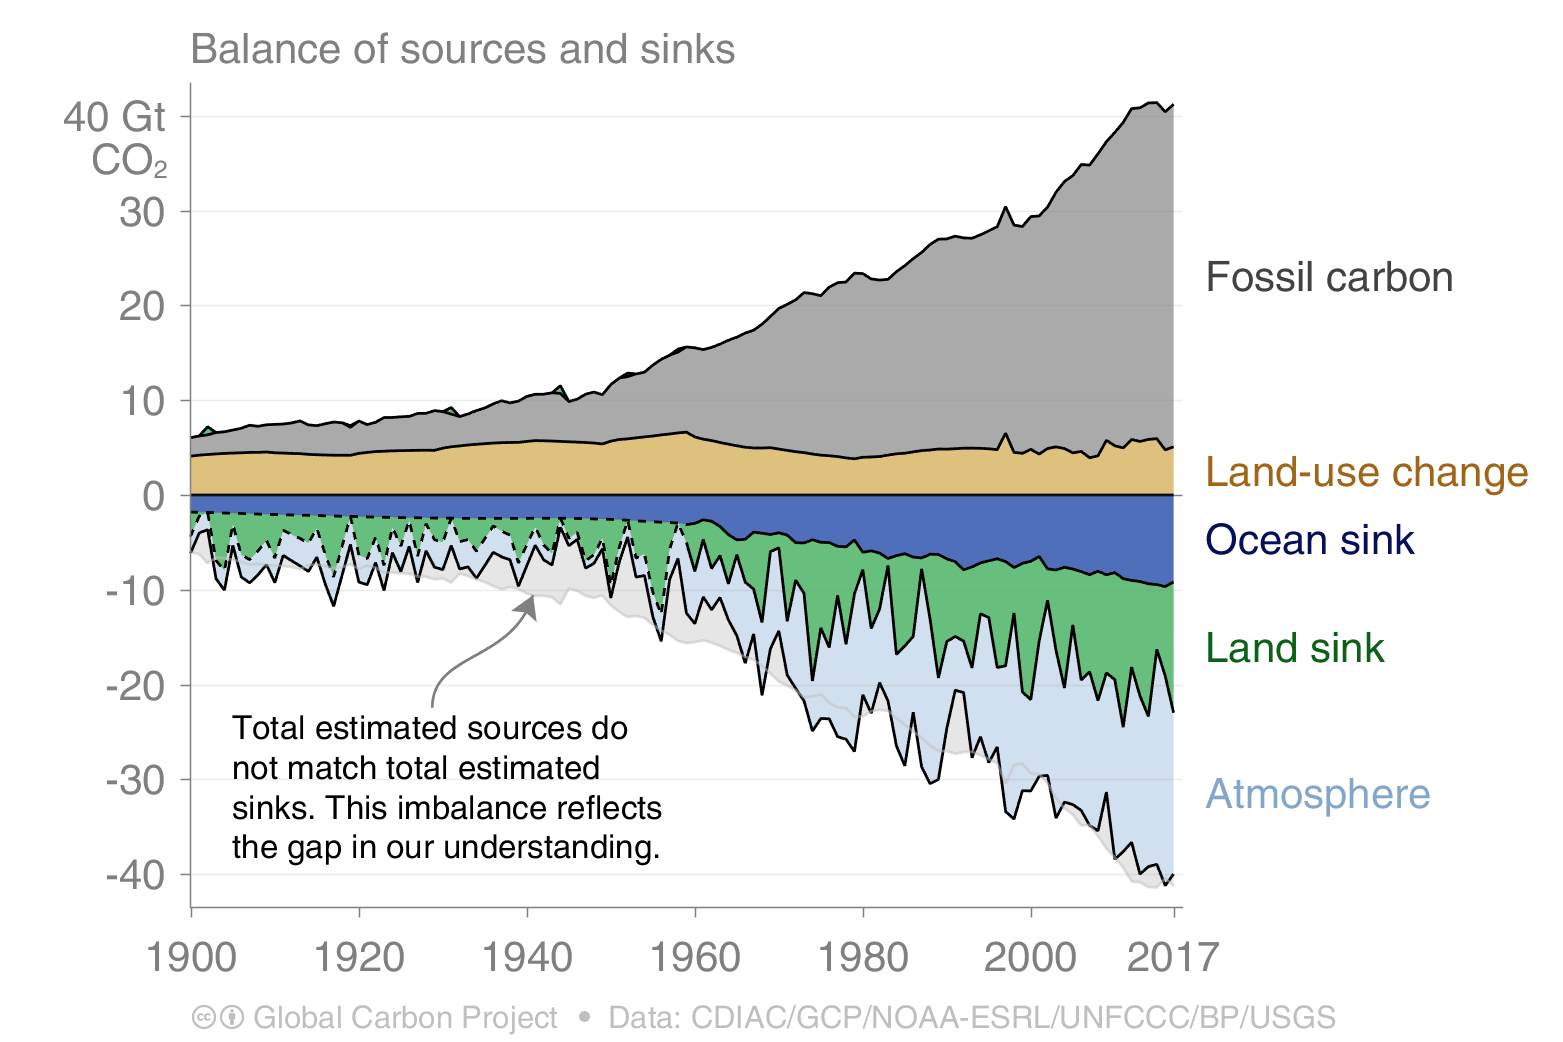
Wie kommt es überhaupt zu dieser starken Dämpfung durch Pflanzen?
Für Pflanzen ist CO₂ überlebensnotwendig. 90 % aller Pflanzen sind sogenannte C3-Pflanzen, die unterhalb von 150 ppm CO₂ die Photosynthese einstellen, sie sterben ab.
Unsere Bäume, aber auch Weizen, Roggen, Reis wachsen besser mit steigendem CO₂-Gehalt der Luft. C4-Pflanzen wie Gräser und Mais reagieren nicht ganz so empfindlich auf CO₂.
Von der vorindustriellen Zeit bis heute hat sich die Photosyntheseleistung der meisten Pflanzen um 65 % gesteigert.
Bei einem weiteren Anstieg des CO₂ in der Luft von den heutigen 410 ppm auf 600 ppm legen die Pflanzen noch einmal 35 % zu.
Manche Gewächshausbesitzer machen sich das zunutze, in dem sie die Treibhäuser auf 600 ppm CO₂ anreichern, um damit eine entsprechend bessere Nahrungsmittelausbeute von mehr als einem Drittel zu erreichen.
![]()
![]() Abbildung 5a
Abbildung 5a
Die Pflanzenproduktivität hat durch den CO₂-Anstieg seit 1850 um 65 % zugenommen.

CO₂ macht die Erde grüner
Die Erde wird grüner.
Das zeigen Satellitenbilder eindeutig. Etwa auf einem Viertel bis zur Hälfte der bewachsenen Gebiete der Erde hat sich die Vergrünung breit gemacht.
![]()
![]() Abbildung 5b
Abbildung 5b
CO₂ macht die Erde grüner

Die Zunahme an grüner Biomasse entspricht einem neuen grünen Kontinent, doppelt so groß wie die USA.
Etwa 70 % ist auf die gesteigerte Photosynthese durch CO₂ zurückzuführen.
Geholfen hat natürlich auch die Erwärmung um 1 Grad Celsius seit 1850.
Und diese Erwärmung hat zusätzlich die Feuchtigkeit in der Luft erhöht.
Die Ernteerträge sind gestiegen, nicht nur, aber vor allen Dingen auch wegen des Klimakillers CO₂.
Die grüner werdende Erde saugt das CO₂ auf
Für die Klimamodelle ist die Senkendiskussion von zentraler Bedeutung.
Und nun, 6 Jahre nach dem Bericht des IPCC vom Jahre 2013, stellt sich heraus, dass die Modelle vollständig daneben lagen, in dem sie die Aufnahmefähigkeit von Ozean und Land dramatisch unterschätzten.
In einer im Februar diesen Jahres erschienenen Studie (hier die Pressemitteilung) stellen Alexander Winkler und Victor Brovkin vom Max-Planck-Institut für Meteorologie in Hamburg und Ranga Myeni vom Department of Earth and Environment der Boston University fest:
"Diese Modelle, die die wissenschaftliche Basis für die IPCC Assessment Reports sind, unterschätzen wahrscheinlich auch die zukünftige Kohlenstoffaufnahme durch Photosynthese - ein zentraler Aspekt für Klimaprojektionen.
In den letzten beiden Jahrzehnten entstanden im Mittel 310 000 km² zusätzliche Blatt- und Nadelfläche, - ungefähr die Größe Polens und Deutschlands - jedes Jahr."
Max Planck Institut for Meteorology (MPI-M)
en
Rising CO₂ has unforeseen strong impact on Arctic plant
productivity
In a new study, a team of researchers around Alexander Winkler and Prof Victor Brovkin from the department "The Land in the Earth system" at the Max Planck Institute for Meteorology (MPI-M) show that most Earth system models (ESM) underestimate the response of Arctic plant productivity to rising atmospheric carbon dioxide (CO₂) concentration.
These models, which serve as the scientific basis for the IPCC Assessment Reports, likely also underestimate future carbon uptake by photosynthesis - a key aspect for climate projections.
This is a surprising result as some previous studies suggested that ESMs overestimate the response of plants to rising CO₂.
"Unsere zentrale Erkenntnis ist", so die Forscher weiter, "dass der Effekt der CO₂-Konzentration auf die terrestrische Photosynthese größer als zuvor gedacht ist und daher bedeutende Implikationen für den zukünftigen Kohlenstoffkreislauf hat."
Der CO₂-Dämpfungseffekt ist 60 % höher als das Mittel der Modelle angenommen hatte, bei einer Verdoppelung von 280 ppm auf 560 ppm CO₂.
Und die Realität gibt den Forschern Recht.
Schon heute verbleiben nur 46 % CO₂ in der Atmosphäre, 24 % in den Ozeanen und 30 % auf Land und in Pflanzen.
Nature Communication
en
Earth system models underestimate carbon fixation by plants in the high
latitudes
Abstract ...
Our EC estimate is 60% larger than the conventionally used multi-model average (44% higher at the global scale).
This suggests that most models largely underestimate photosynthetic carbon fixation and therefore likely overestimate future atmospheric CO₂ abundance and ensuing climate change, though not proportionately.
Introduction ...
Predicting climate change requires knowing how much of the emitted CO₂CO2 (currently ~40?Pg?CO2?yr-1) will remain in the atmosphere (~46%)
and how much will be stored in the oceans (~24%) and lands (~30%).
Der Weltklimarat IPCC nahm bislang an, dass der Verbleib des CO₂ in der Luft uns viel länger zu schaffen machen würde.
Von mehreren hundert Jahren Verweildauer war noch in den ersten Weltklimaberichten zu lesen.
Im letzten Bericht von 2013 gab es dann schon ein kleinlautes Heranpirschen an die Realität und man schätzte die Verweildauer des CO₂ in der Luft auf 30 bis 100 Jahre.
Die Erkenntnisse des Hamburger MPI über die unterschätzte CO₂-Senke durch Pflanzen müsste zu einer Revision der Verweildauer führen.
Und weder bei der Vegetation noch bei der der Verlagerung des CO₂ in die tieferen Schichten der Ozeane ist eine Sättigung in Sicht.
Erst bei 1500 ppm bleibt die Aufnahme von CO₂ durch die Pflanzen nahezu konstant.
Aber 1500 ppm erreichen wir niemals, eher geht uns Kohle, Erdöl oder Erdgas aus.
Drastische Emissionsminderung nicht erforderlich
Und nun kommt das höchst überraschende: Entschließt sich die Menschheit, in den nächsten Jahren einfach, die weiteren Emissionen nicht weiter ansteigen zu lassen, sozusagen die Gesamtemissionen bei 37 Mrd. Tonnen CO₂ einzufrieren, wird sich nach geraumer Zeit eine neues Gleichgewicht einpendeln zwischen den jährlichen Emissionen und den Ozeanen und Pflanzen.
Roy Spencer von der Universität Alabama hat das in einem einfachen Modell berechnet, bei welchem CO₂-Niveau man landen wird.
Er kommt bei einem Festhalten an den CO₂-Emissionen des Jahres 2018 zum Ergebnis, dass ein Niveau von 500 bis 520 ppm nicht überschritten wird.
Denn er kann zeigen, dass die Rate der Entfernung des CO₂ aus der Atmosphäre in den letzten Jahren 50 Jahren von 40 % auf über 50 % der jährlichen Emission angestiegen ist.
Roy Spencer
en
A Simple Model of the Atmospheric CO₂ Budget
SUMMARY ...
A simple model of the CO₂ concentration of the atmosphere is presented which fairly accurately reproduces the Mauna Loa observations 1959 through 2018.
The model assumes the surface removes CO₂ at a rate proportional to the excess of atmospheric CO₂ above some equilibrium value.
It is forced with estimates of yearly CO₂ emissions since 1750, as well as El Nino and La Nina effects.
The residual effects of major volcanic eruptions (not included in the model) are clearly seen.
Two interesting finding are that
(1) the natural equilibrium level of CO₂ in the atmosphere inplied by the model is about 295 ppm, rather than 265 or 270 ppm as is often assumed,
and (2) if CO₂ emissions were stabilized and kept constant at 2018 levels, the atmospheric CO₂ concentration would eventually stabilize at close to 500 ppm, even with continued emissions.
Eine sehr schöne Ableitung mit einem ähnlichen Ergebnis ist bei Dr. Rainer Link nachzulesen.
Dr. Rainer Link
CO₂ Grenzwert in der Atmosphäre in Abhängigkeit von seiner
Lebensdauer
Das von den Menschen anthropogen in die Atmosphäre im Wesentlichen durch Verbrennung fossiler Rohstoffe emittierte CO₂ wird nach einer bestimmten Zeit durch Vegetation und Ozeane wieder aufgenommen.
Die typische Angabe für die Verweilzeit ist die Lebensdauer, die Zeit in der die Konzentration um einen Faktor 1/e=0,3679 abgenommen hat.
Wir haben dieses einfache CO₂- Modell nachgebildet und für folgenden Fall berechnet.
Bis 2030 steigen die globalen Emissionen auf 45 Milliarden Tonnen an.
Danach bleiben sie konstant. China wird bis 2030 die Emissionen von heute 9,5 auf 12,5 Milliarden Tonnen CO₂ ansteigen lassen und Indien wie viele andere sich entwickelnde Länder werden mehr Emissionen ausstoßen.
Die Verweildauer ist mit Tau= 65 Jahren (IPCC 30-100 Jahre) angenommen worden. *)
National Center for Climate Change Strategy and International
Cooperation (NCSC)
en
Pursuing an Innovative Development Pathway: Understanding China's NDC
*) Fussnote: die Abklingzeit Tau ist definiert als die Zeit, in der die Konzentration des CO₂ auf 37 % zurückfällt
![]()
![]() Abbildung 6
Abbildung 6
Die CO₂-Konzentration übersteigt niemals 560 ppm bei konstanter Emission ab 2030 (435ppm),
Verweildauer des CO₂ in der Atmosphäre 65 Jahre

▶CO₂-Senken & CO₂‑Verweildauer
Es ist also nicht erforderlich, dass die Emissionen auf Null zurückgefahren werden.
Wir können solange fossile Energieträger nutzen, bis sie alle sind - unter einer einzigen Voraussetzung: wir dürfen nicht wesentlich mehr als 45 Mrd. Tonnen pro Jahr ausstoßen und sollten diese Emissionen auch niemals mehr ansteigen lassen.
Durch ein Einfrieren der CO₂-Emissionen würde eine Verdopplung der CO₂-Konzentrationen von vorindustriellen 280 ppm auf 560 ppm eintreten.
Bei einer Verdoppelung auf 560 ppm wäre eine Erwärmung von 1,8 Grad Celsius zu erwarten, legt man die neuesten empirischen Klimaempfindlichkeitsberechnungen (ECS) zum CO₂ zugrunde.
Nicholas Lewis, Judith Curry
en
The impact of recent forcing and ocean heat uptake data on estimates
of climate sensitivity
Abstract ...
Energy budget estimates of equilibrium climate sensitivity (ECS) and transient climate response (TCR) are derived based on the best estimates and uncertainty ranges for forcing provided in the IPCC Fifth Assessment Scientific Report (AR5).
Recent revisions to greenhouse gas forcing and post-1990 ozone and aerosol forcing estimates are incorporated and the forcing data extended from 2011 to 2016.
...
These results imply that high ECS and TCR values derived from a majority of CMIP5 climate models are inconsistent with observed warming during the historical period.
Fazit
Der schon beschlossene Schritt der Bundesregierung, die CO₂-Emissionen auf 80 % zurückzufahren, ist überflüssig und die Ankündigung der Kanzlerin, das Ziel auf 100 % hochzuschrauben, ist mehr als fragwürdig und sinnlos.
Nun kann man darüber diskutieren, wieviel die entwickelten Länder zurückfahren müssen, um den sich entwickelnden Nationen einen Nachholbedarf in Sachen CO₂-Emissionen zu ermöglichen.
Das sollte aber nicht in der Weise erfolgen, dass Deutschland seine Emissionen bis 2030 um 300 Millionen Tonnen reduziert und China um 3000 Millionen hochfährt.
Immerhin emittiert China schon heute mehr CO₂ pro Kopf als Europa, nämlich 6,9 Tonnen pro Kopf.
5 Tonnen pro Kopf bei einer 9 Milliarden Weltbevölkerung wäre doch eine akzeptable weltweite Größe.
Macht insgesamt die obengenannten 45 Milliarden Tonnen pro Jahr.
Das hieße für Deutschland eine Reduktion auf nicht einmal 50 %.
Das wärs.
Panik ist also völlig unnötig.
Mutter Erde hält das CO₂-Problem für uns in Grenzen.
Wir sollten ihr dabei helfen.
Je mehr Pflanzen und Bäume wachsen, umso mehr kann auch an CO₂ aufgenommen werden.
Das macht jedenfalls sehr viel mehr Sinn als abenteuerliche Konzepte von Elektromobilität bis zum Zupflastern schöner Landschaften mit Windkraftanlagen.
|
|
Die Erde wird grüner - die ausbleibende Katastrophe Die Erde wird grüner - die ausbleibende Katastrophe Kohlenstoffdioxid (CO₂): CO₂-Webseiten, CO₂-Senken & CO₂-Verweildauer Bioplanet: CO₂ = Pflanzendünger, Erde wird grüner Fehler der "Klimamacher", Teil I: CO₂-Senken & CO₂-Verweildauer |
↑ Die Sonne im April 2019 und der € 4600 Milliarden Flop
-
Die kalte Sonne (Fritz Vahrenholt & Sebastian Lüning)
Fritz Vahrenholt und Frank Bosse
2019-05-07 de Die Sonne im April 2019 und der € 4600 Milliarden Flop
Der 4600 Milliarden Flop der Energiewende
Die Forderungen nach dem Ausstieg aus Kohle, Kraftstoff und Erdgas
werden immer schriller:
Es fing schon mit dem waghalsigen Vorschlag der Kohlekommission an, die vom Bundeskanzleramt zur Hälfte mit grünen Aktivisten besetzt wurde - Ausstieg aus der Kohle bis 2038.
Dann folgte die Forderung Robert Habecks und seiner grünen Freunde nach dem Aus für den Verbrennungsmotor im Jahre 2030.
Und als es vier Wochen im April sehr trocken war (sehr schlimm, hat es noch nie gegeben) rief Annalena Baerbock die Klimakrise aus: Verdopplung des CO2-Preises und ein starkes Ordnungsrecht!
Nun fordern die Freitagskinder von Lummerland eine CO2-Steuer von 180 € noch in diesem Jahr, bis 2035 "Treibhausemissionen auf Netto- Null", 100 % Erneuerbare Energien.
"Energiesysteme der Zukunft"
Da lohnt es sich ja doch einmal, in die Studie des Akademieprojektes "Energiesysteme der Zukunft" der "Union der Deutschen Akademien der Wissenschaften", die Ende letzten Jahres unter dem Titel "Sektorkopplung - Untersuchungen und Überlegungen zur Entwicklung eines integrierten Energiesystems veröffentlicht wurde, zu schauen.
Es soll an dieser Stelle nicht hinterfragt werden, wieso der gesammelte technische Sachverstand unserer deutschen Akademien die Zukunft unserer Energieversorgung im Wesentlichen auf
allein zwei Technologien stützen will: Windenergie und Photovoltaik.
Warum geben die Wissenschaftler der Kernfusion, der inhärent sicheren Kernenergie ohne langlebige Rückstände (dual fluid reactor) oder der CO2-freien Kohlenutzung (Carbon capture and sequestration) nicht den Hauch einer Chance ?
Weil Wissenschaft in Deutschland nur noch in der Bandbreite des Mainstreams denken darf,
etwa von CDU-Parteitagsbeschluss bis Greenpeace-Resolution.
Es lohnt sich trotzdem reinzuschauen, um zu erahnen, was uns bevorsteht.
Es werden alle Sektoren, Strom, Verkehr und Wärme zusammen betrachtet.
Und siehe da:
80% der Energie werden fossil erzeugt,
7,5 % durch Kernenergie
und 13 % durch Erneuerbare Energien.
Wenn man bei den Erneuerbaren Energien die Biomasse (einschl. Biogas und Biosprit) abzieht, bleiben übrig:
1,5 % der Primärenergie wird durch Windkraft erzeugt
und 1% durch Photovoltaik. (S.10 der Studie).
Das ist ein langer Weg bis zu 100%.
Die Studie kommt zum Schluss, wenn man den Weg einer Dekarbonisierung um 90% bis 2050 gehen will, dann "wird mit rund 1150 Terawattstunden sogar fast doppelt so viel Strom benötigt wie heute" (S.10), weil Verkehr und Wärme ebenfalls aus Strom erzeugt werden soll.
Da man sich nur auf Photovoltaik und Windkraft verkrampft hat, kommt die Studie zum Schluss:
"Die installierte Leistung an Windkraft und Photovoltaik müsste in diesem Fall (bei gleichbleibendem Energieverbrauch) gegenüber heute versiebenfacht werden."
Wir haben heute etwa 28'000 Windkraftanlagen mit einer Kapazität von 57'000 Megawatt und 46'000 Megawatt Photovoltaik.
Eine Versiebenfachung der Photovoltaikfläche würde fast alle in Deutschland möglichen Dach-Fassaden- und andere Siedlungsflächen erfassen.
Eine Versiebenfachung der Kapazität der Windenergieanlagen würde selbst
bei Verdopplung der Kapazität der einzelnen Anlagen Deutschland verändern.
Alle 1,5 Kilometer würde eine 200 m hohe 3-5 MW- Anlage stehen.
Die Studie lässt auch den Abgrund erahnen, auf den wir auf diesem Weg zugehen.
"Die Dominanz der fluktierenden Erneuerbaren Energien erfordert eine hohe Flexibilität auf der Stromerzeugungsseite und der Verbrauchsseite" (!!)
Das heißt mit anderen Worten, wenn die Natur nicht genügend Wind und Sonnenstrom liefert, muss man auch zeitweise ohne Strom auskommen.
Interessant ist das Ergebnis, dass es auch in der schönen neuen Welt der dezentralen Energieerzeugung nicht ohne zentrale Grosskraftwerke gehen wird.
Die Studie schätzt, das etwa 100'000 Megawatt Großkraftwerke, die natürlich auf Biogasbasis oder synthetischem Methan oder Wasserstoff gefahren werden, kurzfristige Zusammenbrüche verhindern helfen.
Zum Vergleich: heutige Großkraftwerkskapazität 90'000 MW.
Wohltuend ist die Aussage, dass Batterien nur eine Lösung als Kurzzeitspeicher haben können.
Voraussetzung für Langzeitspeicher ist die erfolgreiche Entwicklung von power-to-gas, also Windstrom per Elektrolyse in Wasserstoff oder gar Methan zu verwandeln.
Das ist zwar heute noch absurd teuer, aber das schaffen wir schon.
Allerdings warnen die Autoren,
dass es in Tagen der kalten Dunkelflaute (keine Sonne und kein Wind im Winter) zu Konflikten zwischen power to heat (also der Wärme auf Windstrombasis) und dem Strombedarf bei knappem Angebot geben kann.
Will sagen: Licht oder warme Heizung, das ist dann die Frage.
Das Auto bleibt dann sowieso stehen.
Die Autoren korrigieren auch die weithin verbreitete Fehleinschätzung des Autos als Stromspeicher.
"Die Pufferkapazität der Elektroflotte, liegt im Bereich von einigen Stunden" hängt zudem davon ab, ob die "Autobesitzer bereit sein werden, ihre Batterien dem System zur Verfügung zu stellen.
Sind sie größtenteils nicht bereit, die Souveränität über Ladung und Entladung zeitweise abzugeben, ist der Betrag gering.
Schlimmstenfalls könnte zeitgleiches Laden vieler Autos zu bestimmten Tageszeiten zu einer zusätzlichen Belastung für das Stromnetz werden.
Wie undankbar diese Autofahrer sind.
Da hat man jede Straße in den Städten für sie aufgerissen, um dem "Ausbau der Verteilnetze" Rechnung zu tragen und nun wollen sie auch noch bestimmen, wann sie fahren wollen und wann nicht.
Aber die schöne neue Welt von Gretl, Annalena und Robert hat einen Preis.
Die Autoren setzten 60% CO2 Minderung, die ja bis 2030 erreicht werden soll, voraus.
Bis dahin kostet das 4000 Milliarden in gut 10 Jahren.
Das heutige Energieversorgungssystem kostet pro Jahr 250 Milliarden €.
Das wird schon mal 1500 Milliarden teurer.
Bei 60 auf 75 % CO2 Minderung rechnen die Autoren mit weiteren 800 Milliarden.
Von 75 auf 85 % mit weiteren 1000 Milliarden.
Von 85 auf 90 % CO2 Minderung noch einmal weitere 1300 Milliarden.
Also bis 60 % 1500 Milliarden, bis 90 % 3100 Milliarden, machen zusammen 4600 Milliarden.
4600 Milliarden € geben die deutschen Haushalte aus, um 800 Millionen t CO2 zu vermeiden.
Dies ist eine Menge an CO2, die jedes Jahr China zusätzlich ausstößt.
Damit die Eltern von Fridays for future die 4600 Milliarden richtig verstehen:
das sind im Jahr 153 Milliarden, bei 40 Millionen Haushalten in Deutschland bezahlt jeder Haushalt monatlich 382 € im Monat - netto.
Und wenn es nach Gretl und ihren followern geht, nämlich in 15 Jahren 100% Erneuerbare Energien zu erreichen, dann wären das 764 € im Monat
- wenn es denn nicht vorher zu einem Zusammenbruch der deutschen Energieversorgung kommen wird, was sehr wahrscheinlich ist.
764 € sind bei einem monatlichen Durchschnittsverdienst in Deutschland von netto 1890 €.
Damit fallen diese Haushalte dann unter die Armutsgrenze (60 % des Durchschnittsnettoeinkommens). Schöne neue Welt.
Wir kommen nicht einmal klar mit dem Umbau der Stromversorgung (siehe hierzu die Warnung der Bundesnetzagentur zum Aufbau von Reservekraftwerkskapazität in 2022 in Höhe von 10 000 Megawatt (10 Kernkraftwerke).
Da erweitern wir das Problem auf Wärme und Mobilität.
Alle drei Sektoren, die bislang von unterschiedlichen Energieträgern (Kohle, Erdgas, Erdöl) geprägt waren, sollen von einem einzigen abhängig gemacht werden: Strom, gespeist aus Wind und Sonne.
Wind und Sonne entscheiden, wann wir unser Auto bewegen können, wieviel Wärme wir im Winter nutzen dürfen und wann das Licht angeschaltet werden kann.
Das nennt man einen nachhaltigen Kurzschluss.
Und warum das alles?
Natürlich wegen der anfangs erwähnten Klimakrise.
Und deswegen sind solche Blogs wie dieser notwendig, um allen Entscheidern klarzumachen:
Ja, wir müssen am Ende dieses Jahrhunderts die fossile Ära hinter uns gelassen haben.
Aber diese Zeit haben wir auch, denn die Klimasensitivität des CO2 ist deutlich kleiner als uns die Panikmacher und Systemveränderer erzählen wollen.
↑ Mai 2018
-
Die kalte Sonne (Fritz Vahrenholt & Sebastian Lüning)
2018-06-22 de Die Sonne im Mai 2018 und antarktische Alpträume
|
|
|
Professor Dr. Fritz Vahrenholt schreibt dazu in einem Mail
Da die Temperaturentwicklung nicht den Erwartungen der Klimaalarmisten entspricht - wir sind heute wieder auf dem Niveau des Jahres 2014 angelangt - müssen neue Alpträume her, um das erlahmende Interesse an Klimapolitik wachzurufen.
So lasen wir kürzlich in der FAZ die Schlagzeile "
Das ewige Eis schmilzt dahin ", gemeint war das Eis der Antarktis.
Der Artikel beschriebe den Alptraum:
"Würde das gesamte Eis in der Antarktis verschwinden, hätte das dramatische Folgen:
der globale Meeresspiegel würde um fast 60 Meter ansteigen."
Was war passiert ?
Eine Arbeit von 40 (!) Autoren des Klima-mainstreams kommen zu dem Schluss, dass die Massenbilanz aller Regionen in der Antarktis negativ ist.
109 Gigatonnen soll der Verlust pro Jahr betragen.
Das hört sich nach viel an.
Der Eisschild weist jedoch 27,6 Millionen Gigatonnen an Eis auf.
Selbst wenn die Annahme richtig wäre und sich der Eisverlust fortsetzte, würde es tausend Jahre dauern, bis 1% der antarktischen Kappe geschmolzen wäre.
Die Gletscher der Antarktis reichen in das Meereswasser.
Entscheidend sind die Temperaturen unter der Wasserlinie.
Und da sieht man einen rückläufigen Effekt.
Von 1955 bis 2004 hat sich die Wassersäule bis 700 m Tiefe um 0,003 °C pro Jahr erwärmt, ab 2004 ist dieser Anstieg auf 0,001 °C pro Jahr zurückgegangen.
Ein Zusammenhang mit steigenden CO2-Emissionen ist so jedenfalls nicht zu konstruieren.
Vieles spricht dagegen für natürliche Schwankungen, denen die Meeresgewässer um die Antarktis unterworfen sind.
Offensichtlich verhalten sich arktische und antarktische Meeresgewässer wie eine Wippe , die in einem 60-jährigen Rhythmus zwischen wärmeren und kälteren Phasen hin und herschwingt.
Noch 2015 hatte die NASA durch ihren Glaziologen Jay Zwally bekannt gegeben, dass die Westantarktis Eis verliert, die Ostantarktis aber Eis gewinnt.
Die Bilanz war danach positiv mit 200 Gigatonnen pro Jahr.
Nach Zwallys Untersuchungen trägt die Antarktis zur einer Senkung des Meeresspiegelanstiegs von 0,23 mm/ Jahr bei.
Beim Schmelzen der Westantarktis sind sich die Forscher also einig, bei der Ostantarktis kommen sie zu unterschiedlichen Ergebnisse.
Der Lead Autor der Studie, Andrew Shepherd von der Universität Leeds, räumt mittlerweile ein, dass man sich hinsichtlich der Ostantarktis am wenigsten sicher sei.
Das war nicht unklug.
Denn Zwally hat schon eine neue Veröffentlichung angekündigt, wonach
seine Ergebnisse von 2015 bestätigt werden, dass das Eis der
Ostantarktis in einem Maße wächst, das die Verluste der Westantarktis
mehr als ausgleicht.
| de | en | fr |
|---|---|---|
|
Auswirkungen des Klimas Antarktis (Südpol) |
Effects of Climate Change Antarctic (South Pole) |
Conséquences climatiques Antarctique (Pôle Sud) |
↑ April 2018
-
Die kalte Sonne (Fritz Vahrenholt & Sebastian Lüning)
Fritz Vahrenholt
2018-06-11 de Fritz Vahrenholts Sonnenkolumne 5/18: Klimaempfindlichkeit gegenüber CO2 und die Kohlekommission
↑ März 2018
-
Die kalte Sonne (Fritz Vahrenholt & Sebastian Lüning)
Fritz Vahrenholt und Frank Bosse
2018-04-24 de Die Sonne im März 2018 und Neues über die Treibhausgas-Empfindlichkeit unseres KlimasUnser Energiespender war im März noch inaktiver als in den Vormonaten.
Die festgestellte SSN (SunSpotNumber) betrug sage und schreibe noch 2,5, dies sind ganze 8% des in diesem Zyklusmonat (Monat 112) Üblichen.
Lediglich an 6 der 31 Tage des Monats war überhaupt ein Sonnenfleck zu bemerken.
Eine Beobachtung am 10. April 2018 lässt aufhorchen:
Bei etwa 30° südlicher heliosphärischer Breite erspähte der Sonnenforschungssatellit "SDO" einen winzigen Fleck ( er war viel zu klein um Eingang in die offizielle SSN zu finden) der etwas Besonderes darstellte:
der erste sicher nachgewiesene Sonnenfleck, der zum nächsten Zyklus ( Nr. 25) gehört.
↑ Februar 2018
-
Die kalte Sonne (Fritz Vahrenholt & Sebastian Lüning)
Frank Bosse und Fritz Vahrenholt
2018-03-18 de Die Sonne im Februar 2018 und der Status der Ozeane zu Beginn des JahresDie Sonne
Die Aktivität des Zyklus SC 24 (rot)
im Vergleich mit einem mittleren Zyklus (blau)
und dem seit vielen Monaten recht ähnlichen SC 5 (schwarz)

Unser Heimatstern war auch im Februar 2018 sehr unterdurchschnittlich aktiv.
Die festgestellte mittlere SSN (SunSpotNumber) für den Monat betrug 10,6.
Sie lag bei 30% dessen, was in diesem Zyklusmonat im Mittel (Zyklus 1...23) bisher zu verzeichnen war.
An 11 der 28 Tage war überhaupt kein Fleck zu beobachten, zwischen dem 4. und dem 16. des Monats war auf der Südhemisphäre der Sonne ein wenig Aktivität zu verzeichnen.
Auf der Nordhemisphäre waren nur während der letzten 3 Tage d.M. Flecke sichtbar.
Der gegenwärtige Status der Ozeane
Die globalen Meeresoberflächentemperaturen
(SST: SeaSurfaceTemperatures)
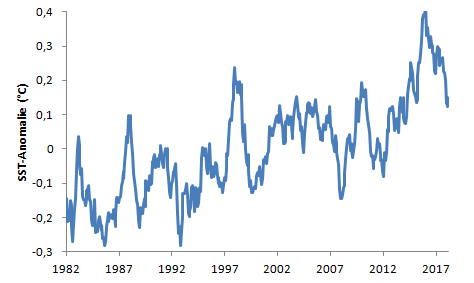
Die SST sind nach ihrem ElNino-bedingten Höhenflug inzwischen wieder auf dem mittleren Niveau von 2014 angekommen, etwa +0,12°C.
Der Wärmeimpuls der jüngeren Vergangenheit war zeitlich und in der Amplitude deutlich stärker als der letzte große Ausreißer 1997/98.
Warum, darüber hatten wir hier vor Jahresfrist berichtet und hier bestätigt: die freigesetzte Wärmemenge aus dem Unterwasserreservoir des westpazifischen Warmpools war etwa doppelt so groß als beim letzten großen ElNino.
Es ist jetzt deutlich sichtbar, wie stark die natürliche Erscheinung ElNino in Zeit und Amplitude wirkte und wie sich danach alles normalisiert.
Ob wir eine "Treppenstufe" sehen wie nach 2002 im Vergleich zu den 90ern auf etwas höherem Niveau...das bleibt abzuwarten.
Jedenfalls werden wir wohl von weiterem "Rekord-Gebrüll" vorerst verschont bleiben.
Die "Oszillationen" der Ozeane der Nordhalbkugel
Atlantische multidekadische Oszillation (AMO)
Die AMO seit 1950 leicht geglättet mit einem 3-Jahrestiefpass.
Bis etwa 1965 war sie in ihrer positiven Phase,
bis Mitte der 70er dann ein sehr markanter Dip.
Nach 1995 dann ein rasanter Anstieg in die positive Phase zurück in der sie gegenwärtig noch ist.

Beide großen Ozeane , Atlantik und Pazifik, weisen in ihrem nördlichen Teil periodische Temperaturschwankungen auf, genannt Atlantische multidekadische Oszillation (AMO) und Pazifische dekadische Oszillation (PDO).
Beide beschreiben streng genommen etwas Unterschiedliches:
Die AMO stellt eine Temperaturvarianz der SST des gesamten außer-tropischen atlantischen Beckens dar. Sie wird definitionsgemäß (das war zu Beginn der 2000er) als trendbereinigte Reihe dargestellt. Dies ist jedoch nicht mehr Stand des Wissens, eine einfache Trendbefreiung ist kaum physikalisch. Es gibt daher den Ansatz, die globalen Temperaturen von den SST des nördlichen Atlantiks durch eine Regression zu entfernen. Wir benutzen diese Herangehensweise.
Wir sahen in jüngster Vergangenheit etwa 2015/16 schon einen Abschwung, der allerdings in den letzten Monaten wieder aufgefangen wurde. Ein nachhaltiger Umschwung ins Negative wird nicht vor 2020 erwartet.
Pazifische dekadische Oszillation (PDO)
Die PDO seit 1900. Sie war bis etwa 1945 in ihrer positiven Phase,
danach bis etwa 1980 negativ mit schnellem Anstieg um 1985 und zeigt nach 2000 fallende Tendenz. Ab 2015 machte sie einen "Hüpfer" die Wechselwirkung mit dem Super-ElNino ließ wahrscheinlich grüßen. Sie fällt gegenwärtig wieder gen null.

Die PDO bezeichnet eher ein Muster der Temperaturverteilung des nördlichen Pazifik. Die PDO wechselwirkt mit der ENSO, der tropischen Variabilität des Pazifiks.
Beide "Oszillationen" die in dekadischen Zeiträumen ihr Vorzeichen wechseln, könnten also in naher Zukunft negativ werden.
Das hätte Auswirkungen auch auf die globalen Temperaturen und das verstärkte/unterdrückte Auftreten von ElNinos.
Der tropische Pazifik
El Niño-Southern Oscillation (ENSO)
Die Entwicklung des Index Nino3,4 seit 1980.
Er zeigt eine moderate LaNina an gegenwärtig.

Die ENSO ist seit September 2017 in einer moderat negativen Phase.
Eine LaNina ist (noch) nicht ausgerufen, dafür sind 5 zusammenhängende Monate mit ONI (OceanicNinoIndex) - Werten von unter -0,5 erforderlich.
Da bislang 4 Monate erreicht sind und auch der März noch nicht über -0,5 gestiegen ist, sollten wir also letztendlich eine LaNina 2017/18 bekommen, wenn auch keine sehr starke.
Wie lange dieser Zustand anhalten wird ist momentan schwer vorherzusagen.
Wir müssen uns bis zum Sommer gedulden um zu sehen, ob sich der tropische Pazifik hin zu neutralen Bedingungen entwickeln wird oder die Tendenz zur LaNina anhält.
Der Meeresspiegel
de Panik-Küche en Panic laboratory fr Marmite alarmiste
Mitte Februar ging eine erschreckende Mitteilung durch alle Medien, auch die Tagesschau mahnte:
Der Pegel steigt nicht linear sondern quadratisch und bis Ende des Jahrhunderts haben wir 65 cm zu erwarten!
Bei linearem Anstieg mit den heutigen Raten von ca. 3mm/a wären es nur beherrschbare 25 cm.
Was steckte dahinter?
Die Eilmeldungen gingen zurück auf diese Arbeit unter Führung von Robert S. Nerem von der Universität Boulder/Colorado.
Darin hatten die Autoren die Schwankungen des Meeresspiegels die ENSO erzeugt, aus den Beobachtungen heraus rechnen sollen.
Ein ElNino lässt es im Ostpazifik viel mehr regnen und das viele Wasser im Ozean führt zu einem temporären Anstieg des globalen Meeresspiegels.
Umgekehrt, bei einer LaNina, wird viel Regenwasser auf Land (besonders Australien) zwischengespeichert und dieser vorübergehende Mangel im Ozean ist auch global deutlich sichtbar.
Wie Sie in Abb. 6 (Die Entwicklung des Index Nino3,4) gut sehen können, hatten wir nahe dem Beginn der Satellitenaufzeichnungen 1998 einen Wasserüberschuss, nach 2010 einen Mangel und 2017 wieder zu viel.
Die beteiligten Autoren entfernten jedoch diese natürlichen Schwankungen nicht vollständig, wie sich bald herausstellte.
Dadurch ging der jüngste El Nino zumindest teilweise in die Rechnungen ein und beeinflusste den Trend, ebenso die LaNina 2011/12 und der ElNino 1997/98.
Diese zeitliche Verteilung muss einen wachsenden Trend produzieren.
Mit diesem Lapsus in den Daten legte man in Nerem et al (2018) einen quadratischen Fit und extrapolierte flugs bis 2100.
Ein solches Verfahren impliziert einen Anfängerfehler, den man "Overfitting" nennt.
Eine viel zu kleine Datenbasis von 1993 bis 2017, hier auch noch fehlerbehaftet, erzeugt einen viel zu sicher geglaubten Trend bis 2100.
Da der Arbeit keine Daten angefügt waren, musste man schon zwei, drei Stunden investieren um die Probleme freizulegen.
Vermutlich hatten sich die Reviewer dieser Mühe nicht unterziehen wollen und ließen diese wissenschaftlichen Fehlleistung in ein Journal passieren.
Von da aus trat die Headline Ihren Zug durch die Medien der Welt an.
Glatter Fehlalarm!
Es bleibt festzuhalten:
ein fehlerhaftes Papier, dass in die Richtung des Alarmismus weist, schafft es bis in die Tagesschau und die Frühnachrichten vieler Rundfunkanstalten.Erkenntnisse über natürliche, die Temperaturentwicklung dämpfende Einflüsse wie die AMO oder die PDO schaffen es nicht einmal immer bis in den Wissenschaftsteil unserer Medien.
So wird mit der Selektion von wissenschaftlichen Nachrichten Politik gemacht.
Wir werden sehen, was die Entwicklungen der nächsten Jahre bringt.
Beide bedeutenden Ozeanindexe negativ und eine unternormal starke Sonne, das wären schon Konterparts für weitere Erwärmungsszenarien.
Wenn es dann offenkundig und für jedermann erfahrbar wird, werden wir das auch in unseren Zeitungen lesen.
↑ Januar 2018
![]()
![]()

-
Die kalte Sonne (Fritz Vahrenholt & Sebastian Lüning)
Fritz Vahrenholt und Frank Bosse
2018-02-16 de Die Sonne im Januar 2018 und der GroKo-Vertrag klimatischUnsere Sonne
(Sie ahnen schon was kommt...) war auch im Januar 2018 unterdurchschnittlich aktiv.
Die festgestellte SSN (SunSpotNumber) betrug 6,7 und war damit den dritten Monat in Folge nur einstellig.
Für den aktuellen Zyklusmonat (Nr. 110 seit dem Beginn des 24. Zyklus im Dezember 2008) ergibt sich damit eine Aktivität, die nur 19% der zu diesem Monat üblichen (als Mittelwert des 110. Monats über alle bisher systematisch beobachteten Zyklen) Sonnenfleckenzahl ausmachte.
An 15 der 31 Tagen des Januars 2018 war die Sonne gänzlich fleckenlos.
Im letzten Monatsdrittel war fast an jedem Tage das Wort "spotless" zu lesen.
Der GroKo-Vertrag und Eulenspiegeleien
Die globalen Temperaturen fielen im Laufe des vergangenen Jahres wieder auf das Vor-El Nino Niveau von 2015 zurück, vgl. unsere Darstellung in der letzten Ausgabe.
Die monatlichen Temperaturanomalie zwischen Januar 2014 und Dezember
2017 ( gegenüber dem Mittelwert 1959-1980,
Daten)
in orange
und eine 13-monatige Glättung ( dunkelrot).

Sie sinken also und sogar die Ober-Alarmisten Gavin Schmidt und James Hansen vom NASA-GISS-Institut "befürchten" einen 10-jährigen Stopp der Erwärmung.
Der Koalitionsvertrag von CDU und SPD (Groko-Vertrag) propagiert derweil immer noch das "Grüne"-Mantra der notwendigen Vorreiterrolle Deutschlands zur Einhaltung der nationalen und internationalen Klimaziele für 2020, 2030 und 2050.
Das ist schon ganz schön mutig, dem Klima Ziele zu setzen.
Die große Koalition will die CO2-Emissionen um 60 % bis 2030 reduzieren (die Zahl steht klugerweise nicht im Koalitionsvertrag , sondern man muss sie sich im Internet aus dem Klimaschutzplan herauspicken) und dann wird das Klima schon sehen, wo es längs geht und sich an das Pariser Klimaabkommen halten und sich nicht mehr als 2 Grad, besser noch 1,5 Grad erwärmen.
Wie soll denn das neue System aussehen?
(S.73) Aus Erneuerbaren, Energieeffizienz, einem beschleunigtem Ausbau der Stromnetze und einer forcierten Nutzung der Digitalisierung.
Da weder Einsparungen, Netze noch Digitalisierung Strom erzeugen können, ruht die Erzeugung allein auf Erneuerbaren, und in der Tat ruht sie des Nachts, was die Photovoltaik betrifft und bei Windflaute - immerhin zwei Drittel des Jahres.
Aber die Lösung der Versorgung mit Flatterstrom ist in Sicht:
die Bundesregierung wird eine Batteriezellproduktion (S.14) unterstützen!
Da wird richtig Geld in die Hand zu nehmen sein, denn Batterieherstellung ist eine der stromintensivsten Produktionen und das kostet viel Steuergeld im Land mit den mittlerweile zweithöchsten Strompreisen (nach Dänemark) in Europa.
Anders ausgedrückt:
Wir haben uns aus dem Markt stromintensiver Produkte selbst herausgeschossen, und zwar auf Dauer.
Aber es gibt auch einen Hauch von Realismus.
Wurde noch in der letzten Koalitionsvereinbarung von 2013 die Energiewende gefeiert, Arbeitsplätze in Deutschland zu sichern, so weiß man mittlerweile, wo die Arbeitsplätze der Solarindustrie hin gewandert sind (zwischen 2010 und 2015 gingen über 70% der Arbeitsplätze verloren) und wohin die Arbeitsplätze der Windindustrie hinwandern werden.
Daher sind die Koalitionäre bescheiden geworden
und wollen nur noch zusätzliche Wachstumschancen. (S. 71)
Aber dafür gibt man aber auch gerne das Geld der Bürger aus,
die über die EEG-Umlage jede neue Photovoltaik- oder Windkraftanlage bezahlen, bislang fast 30 Milliarden € pro Jahr,
ein Kleinwagen pro Haushalt.
Grund für eine Verstärkung des Zubaus in 2019 und 2020 von jeweils 4000 MW Photovoltaik und Wind (S. 71) ist die Nichterreichung der CO2 Minderungsziele von 2020.
Dann macht man zum Ausgleich ein bisschen mehr Wind.
Dann folgt aber ein kluger Satz, der mit Sicherheit in keinem Jamaika-Papier gestanden hätte:
"Voraussetzung ist die Aufnahmefähigkeit der entsprechenden Netze".
Da muss ein Eulenspiegel am Verhandlungstisch dabei gewesen sein, der das hereingeschmuggelt hat.
Denn schon heute ist die Aufnahmefähigkeit des Netzes bei Starkwind nicht mehr gegeben.
Für Redispatch-Maßnahmen oder Abregelung von Windkraftanlagen wurden im letzten Jahr rund 1 Milliarde € bezahlt.
Der Netzbetreiber schaltet also Windkraftanlagen bei zu viel Wind ab, um den Zusammenbruch des Netzes zu vermeiden und der Windkraftbetreiber bekommt Geld, als ob das Windrad gedreht hätte.
Die 4000 MW zusätzlicher Windenergiekapazität führen also nur dazu, dass bei Starkwind bestehende Windkraftanlagen in dieser Größenordnung abgeschaltet werden.
Wie gesagt: Eulenspiegelei.
Eine Reform der Netzentgelte soll die Kosten "unter angemessener Berücksichtigung der Netzdienlichkeit verteilen". (S.72)
Wer weiß schon, worum es dabei geht?
Heute bezahlen diejenigen Bürger, in deren Gegend mehr Windkraftanlagen stehen, als die Netze und der regionale Bedarf verkraften können, die Kosten der Abschaltung sowie die Kosten der Eingriffe über die Netzkosten.
Das ist ein brisantes Thema in Ostdeutschland - viel Windkraft, wenig Verbrauch führt zu den höchsten Netzkosten.
Brandenburg hat daher mittlerweile die höchsten Stromkosten in Deutschland.
Und wenn der Ministerpräsident nicht aufpasst, entsteht dort eine explosive Stimmung durch die Zerstörung der Landschaft und der Natur, Entwertung der Grundstücke und die höchsten Stromrechnungen.
Vielleicht steht auch deswegen der Satz auf Seite 72:
"Wir werden beim weiteren Ausbau der Windenergie an Land einen besseren Interessenausgleich zwischen Erneuerbaren-Branche einerseits und Naturschutz- und Anwohneranliegen andererseits gewährleisten".
Wohlgemerkt nicht "Wir wollen" sondern "wir werden".
Wenn aber die bayerische Regelung - 10 mal Höhe des Windrads gleich Abstand zur nächsten Bebauung (also zwischen 1,5 und 2 Kilometer) - zum Ansatz käme und die Forderung der Staatlichen Vogelschutzwarten von 1 Kilometer Abstand zum nächsten Horst eines Rotmilans (oder 6 km beim Schreiadler) realisiert würde, gäbe es in ganz Ostdeutschland keinen einzigen neuen Standort mehr.
Vielleicht war da ja jemand am Tisch, der weiß, wie stark die Anti-Windkraftbewegung geworden ist.
1000 Bürgerinitiativen sind im ländlichen Raum mittlerweile eine stärkere "pressure group" als die Anti AKW Bewegung in ihren besten Tagen.
Wie groß die Not der politisch Handelnden ist, sieht man an folgendem Prüfauftrag:
"Wir werden prüfen, inwieweit zukünftig nicht mehr benötigte Kraftwerksstandorte für große thermische Speicher-Kraftwerke genutzt werden können." (S.73)
Da will man also überschüssigen Strom nehmen, zu Wärme degenerieren (indem man die Entropie erhöht!) und über Nah- oder Fernwärmenetze zur Beheizung einspeisen.
Vielen Energiefachleuten sträuben sich da die Nackenhaare.
Auf S. 73 ist dann auch das Kernstück der Klimapolitik, über das so viel berichtet wurde, nachzulesen:
"Wir werden eine Kommission "Wachstum, Strukturwandel und Beschäftigung" unter Einbeziehung der unterschiedlichen Akteure aus Politik, Wirtschaft, Umweltverbänden, Gewerkschaften sowie betroffenen Ländern und Regionen einsetzen, die auf Basis des Aktionsprogramms Klimaschutz 2020 und des Klimaschutzplans 2050 bis Ende 2018 ein Aktionsprogramm mit folgenden Elementen erarbeiten soll:
-
Maßnahmen, um die Lücke zur Erreichung des 40 Prozent-Reduktionsziels bis 2020 so weit wie möglich zu reduzieren,
-
Maßnahmen, die das 2030-Ziel für den Energiesektor zuverlässig erreichen, einschließlich einer umfassenden Folgenabschätzung,
-
einen Plan zur schrittweisen Reduzierung und Beendigung der Kohleverstromung, einschließlich eines Abschlussdatums und der notwendigen rechtlichen, wirtschaftlichen, sozialen und strukturpolitischen Begleitmaßnahmen und
-
die finanzielle Absicherung für den notwendigen Strukturwandel in den betroffenen Regionen und einen Fonds für Strukturwandel aus Mitteln des Bundes".
Das Ganze soll in ein Gesetz im Jahre 2019 münden.
Zu begrüßen ist das Eingeständnis, dass das 2020er Ziel um 25 % verfehlt wird.
Das war noch unter Jamaika für Frau Göring-Eckhardt ("Kampf gegen die Klimaerhitzung") und ihrem Hofreiter inakzeptabel und sollte zur sofortigen Stilllegung von 7000 MW (die Forderung der Grünen waren 12000 MW) führen.
Frau Merkel hätte das mitgemacht, Herr Lindner dankenswerterweise nicht.
Wir werden uns an ihn wohlwollend erinnern im Jahre 2022, wenn das letzte Kernkraftwerke vom Netz geht und die Versorgungssicherheit auch ohne grün-schwarzen spielerischen Umgang mit dieser so essentiellen Frage auf dem Prüfstand steht.
Der oben genannte Eulenspiegel hat dann auch noch folgenden Satz reingeschmuggelt.
"Die laufende Hochtemperatur-Plasmaforschung in Deutschland wollen wir angemessen finanziell absichern." (S.35)
Das wäre der erhitzten Karin Göring-Eckhardt und ihrem Hofreiter nicht durchgeflutscht.
Denn dahinter versteckt sich schamhaft, aber immerhin, die Fusionsforschung in Greifswald und Garching, die weltweit exzellenteste Wirkungsstätte hunderter Forscher, die sich um die Verwirklichung der Zukunftsenergie Fusion bemühen - und das erste Plasma erfolgreich zünden konnten.
Und dann gibt es noch den schönen Satz:
"Wir stehen weiterhin für eine wissenschaftlich fundierte, technologieoffene und effiziente Klimapolitik".
Das weiterhin sagt alles.
Wir werden jedenfalls weiterhin dafür sorgen, dass die im wissenschaftlichen Gewande propagierten Glaubenssätze einiger alarmistischer Klimaforscher mit den realen empirischen Messungen und Ergebnissen konfrontiert werden.
-

| de | en | fr |
|---|---|---|
|
Die Sonne Sonnenaktivität |
The Sun Solar Activity |
Le soleil Activité solaire |
⇧
9 Sonnenzyklen
en Solar cycles
fr Cyckes solaire
| de | en | fr |
|---|---|---|
|
Die Sonne Sonnenzyklen |
The Sun Sunspot cycles |
Le soleil Cycles solaires |
⇧
10 Ozeanische Oszillationen
en Ocean oscillations
fr Oscillations océaniques
| de | en | fr |
|---|---|---|
|
Klimawandel: Wissenschaft Ozeanzyklen & Ozeanische Oszillationen |
Climate change: Science Ocean Cycles & Ocean Oscillations |
Changement climatique: Science Cycles et oscillations océaniques |
| Ozeanzyklen steuern das Klima / El Niño (der Knabe/warm) & La Niña (das Mädchen/kalt) / ENSO: El Niño-Southern Oscillation / AMO: Atlantic Multidecadal Oscillation / NAO: North Atlantic Oscillation / AO: Arctic Oscillation / IOD: Indischer Ozean Dipol / PDO: Pacific decada oscillation | ||
⇧
11 Klima-Zyklen und ihre Extrapolation in die Zukunft
en Climate Sycles and their projection into the future
fr Cycles climatiques et leurs projéctions dans le futur
-
Die kalte Sonne (Fritz Vahrenholt & Sebastian Lüning)
Dr. Dietrich E.Koelle
2015-01-29 de Klima-Zyklen und ihre Extrapolation in die Zukunft
de Verzeichnis en Contents fr Sommaire
- E 0 Die 60 Jahre Ozean-Zyklus Sinus Kurve - Die Falle der Klimaalarmisten
Einleitung
Wie die Rekonstruktionen des Klimaverlaufs der Vergangenheit durch Proxy-Daten zeigt, gibt es eine Reihe von Temperatur-Zyklen, die offenbar weithin unbekannt sind, beziehungsweise von vielen Klimaforschern auch ignoriert werden.
Dazu zählen der große Klima-Zyklus von 150 bis 180 Millionen Jahren
E 1 Der komplette Abkühlungsprozess bis vor etwa 2.2 Milliarden Jahren
E 2 Der große Klima-Zyklus seit 900 Millionen Jahren
aber auch die kürzeren und für uns aktuell wahrnehmbaren Zyklen von
| E 3 |
1000 Jahren (900-1100) 230 Jahren (230-250) |
Suess-Zyklus deVries-Zyklus |
mit +/- 0,65 °C mit +/- 0,30 °C |
| E 4 |
230 Jahren (230-250) 65 Jahren (60-65) |
deVries-Zyklus Ozean-Zyklus |
mit +/- 0,30 °C mit +/- 0,25 °C |
| E 5 |
1000 Jahre Suess-Zyklus & 230Jahre deVries-Zyklus Extrapolation der 1000- und 230-Jahreszyklen über die nächsten 700 Jahre |
||
| E 6 | Schlussbemerkungen und Hinweis der Kalte-Sonne-Redaktion | ||
In dieser Analyse wird versucht, wie die Temperaturentwicklung der kommenden 700 Jahre aussehen könnte,
wenn man annimmt, dass die erwähnten Klimazyklen der Vergangenheit sich auch in der Zukunft fortsetzen.
Dies sollte nicht als eine Vorhersage der Klima-Entwicklung (miss)verstanden werden.
Bisher gibt es nur die IPCC-Vorhersage,
dass bis zum Jahr 2100 die Globaltemperatur um 2 bis 5 °C zunehmen soll, nur auf der Basis des erwarteten CO2-Anstieges.
Diese Theorie hat jedoch in den vergangenen 18 Jahren nicht funktioniert,
da die verschiedenen natürlichen Klima-Einflüsse und Zyklen nicht berücksichtigt wurden,
bzw. in Klimamodellen nicht berücksichtigt werden können.
Entscheidend für Temperatur-Entwicklung
Dies sind unter anderem
die Variation der mittleren globalen Wolkenbedeckung (und damit des Erd-Albedos)
und der daraus resultierenden effektiven solaren Insolation (Watt pro m2) am Erdboden, bzw. der Meeresoberfläche,
die entscheidend für die daraus resultierende Temperatur-Entwicklung ist.
de Text en Text fr Texte
↑ E 0
Die 60 Jahre Ozean-Zyklus Sinus Kurve - Die Falle der Klimaalarmisten
![]()
![]() Die Falle der Klimaalarmisten
Die Falle der Klimaalarmisten
de
Der 60 Jahre Ozean-Zyklus
(1885 - 2005 ... 2095)
en
The 60 Year Ocean Cycle
(Sine wave with a ;60-year frequency)
The models are out of phase with reality
The models align with a naturally occurring upswing in surface
temperatures
The modelers have failed to consider the future multidecadal
variations
in their projections caused by the natural enhancement and suppression
of global warming
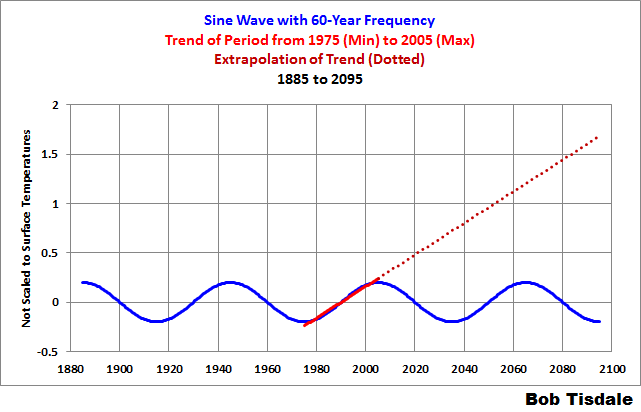
Diese Zyklen haben im Prinzip einen sinusförmigen Verlauf
Bob Tisdale hat hier auch gezeigt, wie der Temperatur-Anstieg des 65-Jahreszyklus in den Jahren 1975 bis 1998 zu der Annahme führte,
dass dies auf den parallelen Zuwachs an CO2-Emissionen zurückzuführen sei.
Das wurde dann naiv linear bis zum Jahr 2100 verlängert
und bildete die Basis der Klimamodelle
und der Erfindung der sogenannten "Klimakatastrophe".
↑ E 1
Der komplette Abkühlungsprozess bis vor etwa 2,2 Milliarden Jahre
![]()
![]() Der komplette Abkühlungsprozess der Erde dauerte ca.
3 Milliarden Jahre
Der komplette Abkühlungsprozess der Erde dauerte ca.
3 Milliarden Jahre

Der absolute Tiefpunkt der Abkühlung wurde vor etwa 2.200 Millionen Jahren erreicht.
Seither geht es durch die zunehmende Energieabstrahlung der Sonne langsam, aber stetig aufwärts, wie in Bild 1 dargestellt.
Dies bedeutet für die Zukunft weniger tiefe Temperaturen bei den großen Eiszeiten, andererseits aber auch höhere Temperaturen bei den Warmzeiten.
Es gibt also tatsächlich eine "globale Erwärmung", aber das im Milliarden-Jahre-Maßstab.
-
Die kalte Sonne (Fritz Vahrenholt & Sebastian Lüning)
Dr. Dietrich E.Koelle
2014-12-27 de Klimazyklen
↑ E 2
![]()
![]() Der große Klima-Zyklus mit einer Periode von 150 bis 180
Millionen Jahren
Der große Klima-Zyklus mit einer Periode von 150 bis 180
Millionen Jahren
Die Eiszeiten waren so charakteristisch, dass sie jeweils eigene Namen
erhielten.
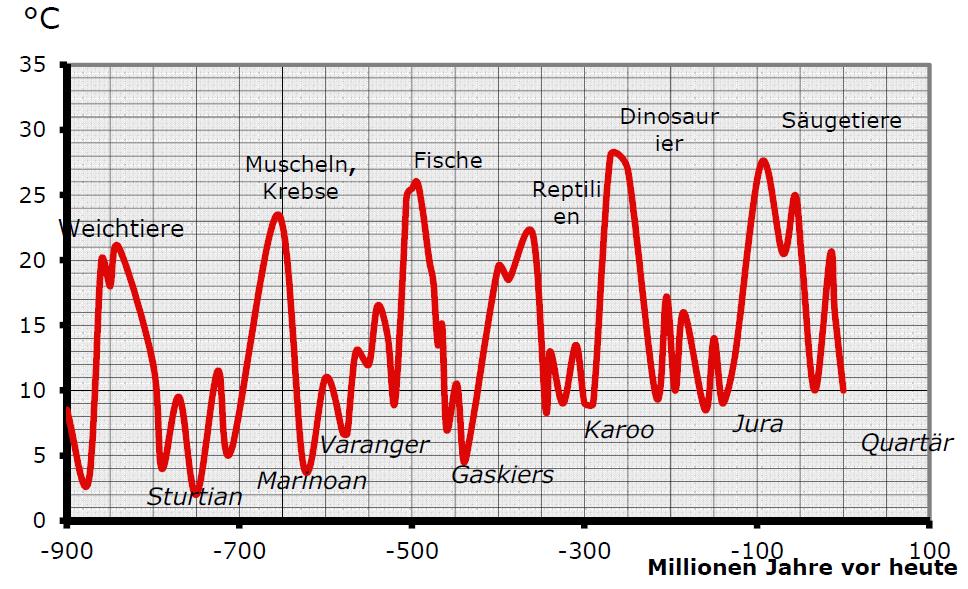
Alle etwa 200 Millionen Jahre
In der Vergangenheit dauerten etwa alle 200 Millionen Jahre
Warmzeiten
die Warmzeiten jeweils 30 bis 50 Millionen Jahre
Jede Warmperiode führte zu einer weiteren Entwicklungs-Stufe des Lebens auf der Erde.
Eiszeiten
Dazwischen lagen schwere und lange Eiszeiten von jeweils 50 bis 100 Millionen Jahren Dauer
mit Temperaturen unter 12°C.
-
Die kalte Sonne (Fritz Vahrenholt & Sebastian Lüning)
Dr. Dietrich E. Koelle
2015-01-01 de Der große Klima-Zyklus: Wir leben in einer tiefen Kaltzeitphase - und niemand merkt es
↑ E 3
Globaltemperatur der letzten 3200 Jahre
Mit folgendem Link wird von anderen Webseiten auf diese Seite verwiesen.
▶Globaltemperatur der letzten 3200 Jahre
|
|
1000-Jahre: Suess-Zyklus |
| 230-Jahre: deVries-Zyklus |

Zunächst sind in diesem Bild
der 1000-Jahreszyklus
und der 230-Jahreszyklus dargestellt,
wie er durch die historischen Proxy-Daten rekonstruiert werden konnte.
Es handelt sich um eine Kombination der Ergebnisse der verschiedenen Veröffentlichungen in den letzten Jahren auf dem Gebiet der Paläo-Klimatologie.
Das Diagramm der letzten 3200 Jahre zeigt deutlich
einen 1000-Jahreszyklus, der für die letzten 2000 Jahre auch durch historische Dokumente belegt ist.
Tatsächlich gibt es diesen Zyklus schon seit dem Ende der letzten Eiszeit, d.h. seit 9000 Jahren, auch wenn der Grund dafür immer noch unbekannt ist.
Die jetzige Warmzeit ist kein "anthropogenes Produkt" sondern eine natürliche Erscheinung im Rahmen der 1000-Jahreszyklen der Vergangenheit.
Dabei erreicht sie aber nicht die Temperaturen der vorangegangenen Warmzeiten, die um 1 bis 2°C höher lagen.
Ferner ist bemerkenswert, dass bei den beiden vorangegangenen Temperatur-Maxima vor 1000 und 2000 Jahren CO2-Werte von nur 280 ppm herrschten [gemäss IPCC], während sie heute bei 400 ppm liegen.
Das weist darauf hin, dass die wärmeren Perioden wahrscheinlich auf der natürlichen Schwankung der Sonnenaktivität beruhen, und nicht auf einem CO2-Anstieg, den es bei den früheren Warmphasen nicht gab.
Historisch bedeutsam
ist auch die durch die Menschheitsgeschichte belegte Tatsache, dass die Warmzeiten immer wirtschaftliche und kulturelle Blütezeiten waren.
Die dazwischen liegenden kühlen Perioden führten jedoch stets zu ernsten Problemen führten, die Hungersnöte und Völkerwanderungen in Europa auslösten.
Spätestens hier wird auch klar, dass die alarmistische Behauptungen von Politikern wie von Al Gore "die Erde hat Fieber", ausgesprochener Unsinn sind.
↑ E 4
Der 230-Jahreszyklus in den letzten 165 Jahren überlagert von einem 65-Jahreszyklus
Mit folgendem Link wird von anderen Webseiten auf diese Seite verwiesen.
▶230 Jahre deVries-Zyklus & 65 Jahre: Ozean Zyklus
|
|
230 Jahre: deVries-Zyklus |
| 65 Jahre: Ozean Zyklus | |
| Temperatur: °C |
Der 230-Jahreszyklus in den letzten 165 Jahren wird überlagert von einem 65-Jahreszyklus sowie weiteren Effekten wie der unregelmäßigen ENSO-Erscheinungen und größeren Vulkanausbrüchen
Der "ideale" 1000-Jahreszyklus wird variiert durch
den 230-Jahreszyklus, und dieser wiederum durch
den 65-Jahreszyklus der Ozeane, der im Maßstab von Bild 1 nicht dargestellt werden kann,
genauso wenig wie die verschiedenen nicht-zyklischen Erscheinungen wie der ENSO-Einfluss, Vulkanausbrüche, etc.
Bild 3 zeigt den Temperaturverlauf der letzten 165 Jahre mit dem 230-Jahreszyklus mit dem Einfluss des 65-Jahreszyklus.
Die aktuellen jährlichen Temperaturwerte schwanken um plus/minus 0,2°C durch die ENSO- Einfluss, die Sonnenflecken-Aktivität, Vulkanausbrüche, etc.
Der Temperaturanstieg im Zeitraum 1975-1998 um 0,6°C, der die aktuelle Klima-Hysterie auslöste, war genauso hoch wie der vorangegangene Anstieg im Zeitraum 1910 bis 1940 - und keineswegs durch einen CO₂-Effekt, da damals der Gehalt in der Atmosphäre nur um 10 ppm anstieg (von 297 auf 308 ppm).
Auch die Temperaturerhöhung von 1,5°C in den letzen 150 bis 250 Jahren ist keineswegs "außergewöhnlich" oder "gefährlich", wie uns oft in den Medien erzählt wurde, sondern die natürliche Erholung von der letzten Kaltzeit im Zeitraum von 1400 bis 1750, die nicht zur zu einer vereisten Themse und Ostsee geführt hatte, sondern auch zu Hungersnöten in Europa mit der Auswanderungswelle nach Amerika.
↑ E 5
1000 Jahre Suess-Zyklus & 230Jahre deVries-Zyklus
Mit folgendem Link wird von anderen Webseiten auf diese Seite verwiesen.
▶1000 Jahre Suess-Zyklus & 230Jahre deVries-Zyklus
Temperatur der letzten 1000 Jahre und die theoretische Fortsetzung in den nächsten 700 Jahren.
|
|
1000-Jahre: Suess-Zyklus |
| 230-Jahre: deVries-Zyklus | |
| Theoretische Fortsetzung |
Mittelfristig bis in 350 Jahren
Dies ist keine Vorhersage, sondern der mögliche Verlauf des wesentlichen Temperaturtrends,
der mittelfristig in den nächsten 100 Jahren zu einem Abfall um ca. 0,3°C
und in 350 Jahren zu einer ca. 2°C geringerer Globaltemperatur führen kann, genauso wie im LIA ("Little Ice Age") in den Jahren 1450 bis 1700.
In etwa 1000 Jahren
In etwa 1000 Jahren ist dann entsprechend dem 1000-Jahreszyklus wieder mit dem heutigen Temperaturniveau oder etwas weniger zu rechnen.
Folgerung für die nächsten 50 Jahre
In den nächsten 50 Jahren wäre demnach kein Temperatur-Anstieg, sondern eher ein geringer Temperaturabfall zu erwarten.
In den Dekaden vor und nach dem Jahr 2300 könnte eine stärkere Temperaturreduktion auftreten, da sich sowohl der 230-Jahreszyklus als auch der 1000-Jahreszyklus parallel im relativ steilen Abwärtstrend befinden.
↑ E 6 Schlussbemerkungen und Hinweis der Kalte-Sonne-Redaktion
Was die Diagramme zeigen
Die Diagramme zeigen auch, dass alle drei der hier dargestellten Klima-Zyklen fast gleichzeitig ihr Maximum kurz nach letzten Jahrtausendwende hatten;
insofern hätte man eigentlich höhere Temperaturen erwarten können als bei den früheren Warmzeiten.
Vielleicht spielt aber hier die Tatsache eine Rolle, dass die Global-Temperatur seit dem Holozän-Maximum einen negativen Trend hat, d.h. sie hat um in den letzten 8000 Jahren um fast 2°C abgenommen.
Fortsetzung in der Zukunft
Auf der Basis dieser historischen Klimafakten lässt sich auch die mögliche Fortsetzung in der Zukunft darstellen.
Bild 4 zeigt diese Extrapolation der 1000- und 230-Jahres-Zyklen mit den im Wesentlichen zu erwartenden Trends.
Hinzu kommen die Schwankungen des 60/65-Jahreszyklus,
sowie die Einflüsse von ENSO-Erscheinungen, Sonnenflecken-Zyklen und Vulkanausbrüchen,
die - wie auch in der Vergangenheit - zusätzliche Schwankungen um wenige Zehntel Grad nach oben oder unten bewirken können.
Hinweis der Kalte-Sonne-Redaktion
Der Schwerpunkt des Beitrags liegt auf der Analyse natürlicher Zyklen und ihrer Fortschreibung in die Zukunft.
Unberücksichtigt bleibt bei der Prognose in Abbildung 4 die Klimawirkung des CO2, über deren quantitative Rolle derzeit heftig in der Fachwelt diskutiert wird.
In unserem Buch "Die kalte Sonne" stellten wir zwei Szenarien mit CO2-Klimasensitivitäten von 1,0 und 1,5 Grad Celsius pro CO2-Verdopplung vor.
Aktuelle Studien haben den ursprünglichen IPCC-Wert von 3 Grad bereits stark nach unten korrigiert
siehe unseren Beitrag:
Studien aus 2014 geben Hoffnung:
Erwärmungswirkung des CO2 wohl doch
deutlich überschätzt. Offizielle Korrektur steht bevor
▶Die Klimasensitivität von CO₂
Man darf gespannt sein, wie sich die Forschung zur Klimasensitivität in den kommenden Jahren weiterentwickeln wird.
⇧
12 Kohlenstoffdioxid (CO2)
en Carbon dioxide (CO2)
fr Dioxyde de carbone (CO2)
- a Der Anteil von CO2 in der Luft
- b Recent monthly mean CO2 at Mauna Loa
- c Weltweite CO2-Emissionen
- d US Greenhouse gas emissions
↑ a Der Anteil von CO2 in der Luft
![]()
![]()
Sauerstoff (O2): 21 %
Stickstoff (N2): 78 %
Argon (Ar): 0,934 %
Kohlenstoffdioxid (CO2): 0,04 %

![]()
![]()

![]()
![]()

de
Der Anteil von CO2 in der Luft:
-
Die Luft besteht hauptsäschlich aus Sauerstoff (21%) und Stickstoff (78%).
-
Der Anteil von CO2 in der Luft beträgt 0,04 Volumen%.
oder 400 ppm, das heisst 400 parts per million
(400 Teile CO2 auf eine Million Teile Luft)Das sind:
-
0,0004 Teile CO2 auf 1 Teil Luft
-
4 Teile CO2 auf 10'000 Teile Luft
-
oder 1 Teil CO2 auf 2500 Teile Luft
-
auf 1 Kubikmeter Luft kommen damit 4 Deziliter CO2
-
Um das Gefühl für "Parts per Million" zu bekommen:
-
Die gegenwärtige CO2-Konzentration in der Atmosphäre beträgt ungefähr 400 ppm
-
Frage: Wenn Sie von Los Angeles nach New York fliegen, und den Anteil von 400 ppm zurückgelegt haben, wo wird sich das Flugzeug dann ungefähr befinden?
-
Antwort: Auf der Hälfte der Startbahn in Los Angeles.
Die Verteilung des CO2:
-
Das CO2 ist in der Atmosphäre fein verteilt.
-
Das CO2 bidet keine "Schicht" oder "Schirm" um die Erde.
-
Das CO2 kommt nur in der unmittelbaren Umgebung von aktiven Vulkanen in hohen Konzentrationen vor.
-
Das CO2 hat nichts mit dem "Ozonloch" zu tun.
Vom Menschen verursachtes CO2:
-
Von den 0,04 Prozent CO2 in der Luft produziert die Natur 96,5 Prozent, der Rest, also 3,5 Prozent, der Mensch.
Der Mensch verursacht daher etwa:
-
3,5 Prozent von 0,04 Prozent also 0,0014 Prozent
-
oder 0,000014 Teile CO2 auf 1 Teil Luft
-
1 Teil CO2 auf 71'000 Teile Luft
-
In einem Kubikmeter Luft hat der Mensch bisher 0,15 Deziliter CO2 verursacht
(also etwa 1 Suppenlöffel CO2 je Kubikmeter Luft)
-
Deutschland:
-
Der Anteil Deutschlands hieran ist 3,1 Prozent.
Effekt:
-
Damit beeinflusst Deutschland 0,00152% mal 3,1% = 0,00004712 Prozent des CO2 in der Luft;
-
oder 0,0000004712 Teile CO2 auf 1 Teil Luft;
-
oder 1 Teil CO2 auf etwa 2 Millionen Teile Luft;
-
-
Damit will Deutschland die Führungsrolle in der Welt übernehmen, was Deutschland jährlich an Steuern und Belastungen etwa 50 Milliarden Euro kostet.
CO2 beim verbrennen aller fossilen Brennstoffe
-
Die Konzentration würde sich etwa verdoppeln.
Effekt:
-
Nach dem verbrennen aller fossilen Brennstoffe würde sich der Anteil des CO2 von 0,038 Vol % auf etwa 0.08 Vol % (von 380 auf etwa 800 ppm) verdoppeln;
-
0,0008 Teile CO2 auf 1 Teil Luft;
-
8 Teile CO2 auf 10'000 Teile Luft;
-
oder 1 Teil CO2 auf 1300 Teile Luft.
-
Das entspricht in einem Kubikmeter Luft sind dann 0,3 Deziliter vom Menschen verursachtes CO2
(also etwa 2 Suppenlöffel CO2 je Kubikmeter Luft)
-
Zum "Treibhauseffekt" des CO2:
-
Kommentar von Elmar Oberdörffer, 19.01.2010
-
Der verschwindend geringe Anteil am Gesamt-CO2, der auf Deutschland entfällt, ist das eine.
-
Das andere ist die Tatsache, daß der Beitrag des in der Luft enthaltenen CO2 zur Strahlungsbilanz der Erde nahezu vollkommen gesättigt ist.
-
Das heißt, von der überhaupt durch CO2 absorbierbaren IR-Strahlung werden bereits mehr als 99,9 % absorbiert.
-
Eine weitere Steigerung des CO2-Gehalts, sei es durch menschliche Aktivitäten, sei es aus natürlichen Quellen, kann daher keinen meßbaren Einfluß auf das Klima haben.
-
Selbst wenn sich alle Staaten der Erde der deutschen "Klimaschutzpolitik" anschließen würden und den CO2 Ausstoß im Laufe der nächsten Jahre völlig einstellen würden, hätte das keinerlei Einfluß auf das Klima.
-
Es würde nur eine ungeheure Menge Geld vergeudet, die für nützlichere Zwecke, auch des wirklichen Umweltschutzes, dann fehlen würde.
Quelle:
-
EIKE Europäisches Institut für Klima und Energie
2010-01-20 de Nur 0,0004712 *) Prozent!! BUND Aktivist weiss nicht wieviel CO2 von Deutschland in die Luft abgegeben wird!
*) Es sind nicht nur drei Nullen hinter dem Komma, sondern sogar vier.
-
en
Getting a Feel For Parts per Million
-
Current CO2 concentration in the atmosphere is about 385 ppm
-
Riddle: When flying from Los Angeles to New York, if you have traveled the equivalent of 385 ppm of the entire trip, where would your airplane be?
-
Answer: Less than halfway down the runway at LAX.
-
Man is thought to have increased CO2 from about 270 to 385 ppm.
That is a 0.011% change in the mix of atmospheric gasses
↑ b Recent monthly mean CO2 at Mauna Loa
|
Trends in Atmospheric Carbon Dioxide |
|||||||||
|
|
|
||||||||

↑ c Weltweite CO2-Emissionen
↑ d US Greenhouse gas emissions
↑
Ein amerikanischer Triumph: Die Schiefer-Revolution bringt sauberere
Umwelt zusammen mit Arbeitsplätzen und Wohlstand
en An American Triumph: US Shale
Revolution Delivers Cleaner Environment, Along With Jobs And Prosperity
![]() de
de
![]() en
en
![]()

-
EIKE Europäisches Institut für Klima und Energie
2013-01-17 de Ein amerikanischer Triumph: Die Schiefer-Revolution bringt sauberere Umwelt zusammen mit Arbeitsplätzen und Wohlstand
-
The Global Warming Policy Foundation
2013-01-06 en An American Triumph: US Shale Revolution Delivers Cleaner Environment, Along With Jobs And Prosperity
⇧
13 Methan (CH4)
en Methane (CH4)
fr Méthane (CH4)
| de | en | fr |
|---|---|---|
|
Klimawandel: Wissenschaft Methan (CH4) |
Climate change: Science Methane (CH4) |
Changement climatique: Science Méthane (CH4) |
| Methan-Konzentrationen | Methane Concentrations | Concentrations du méthane |
| Methan hat keinen Einfluss auf die Globale Erwärmung | Methane has no impact on Global Warming | Méthane n'a pas d'impact sur le réchauffement climatique |
⇧
14 Die wichtigsten Auswirkungen des Klimawandels
en The most important impacts of climate change
fr Les impacts les plus importants du changement climatique
- a Arktis (Nordpol) / Arctic / Arctique
- b Grönland / Greenland / Grœnland
- c Antarktis (Südpol) / Antarctic / Antarctique
- d Gletscher / Glaciers / Glaciers
- e Meeresspiegel / Sea level/ Niveau des océans
- f Hurrikane / Hurricanes / Ouragans
- g Extremwetter / Extreme Weather Events / Intempéries extrèmes
- h Biosphäre / Bioshphere / Biosphère
| de | en | fr |
|---|---|---|
|
Klimawandel Auswirkungen des Klimas |
Impacts of Climate Change Impacts of Climate Change |
Changement climatique Impacts du changement climatique |
↑
a Arktis (Nordpol)
en Arctic (North Pole)
fr Arctique (pôle Nord)
|
|
Japan Aerospace Exploration Agency
NSIDC The National Snow and Ice Data Center |
||||
|
|
|||||
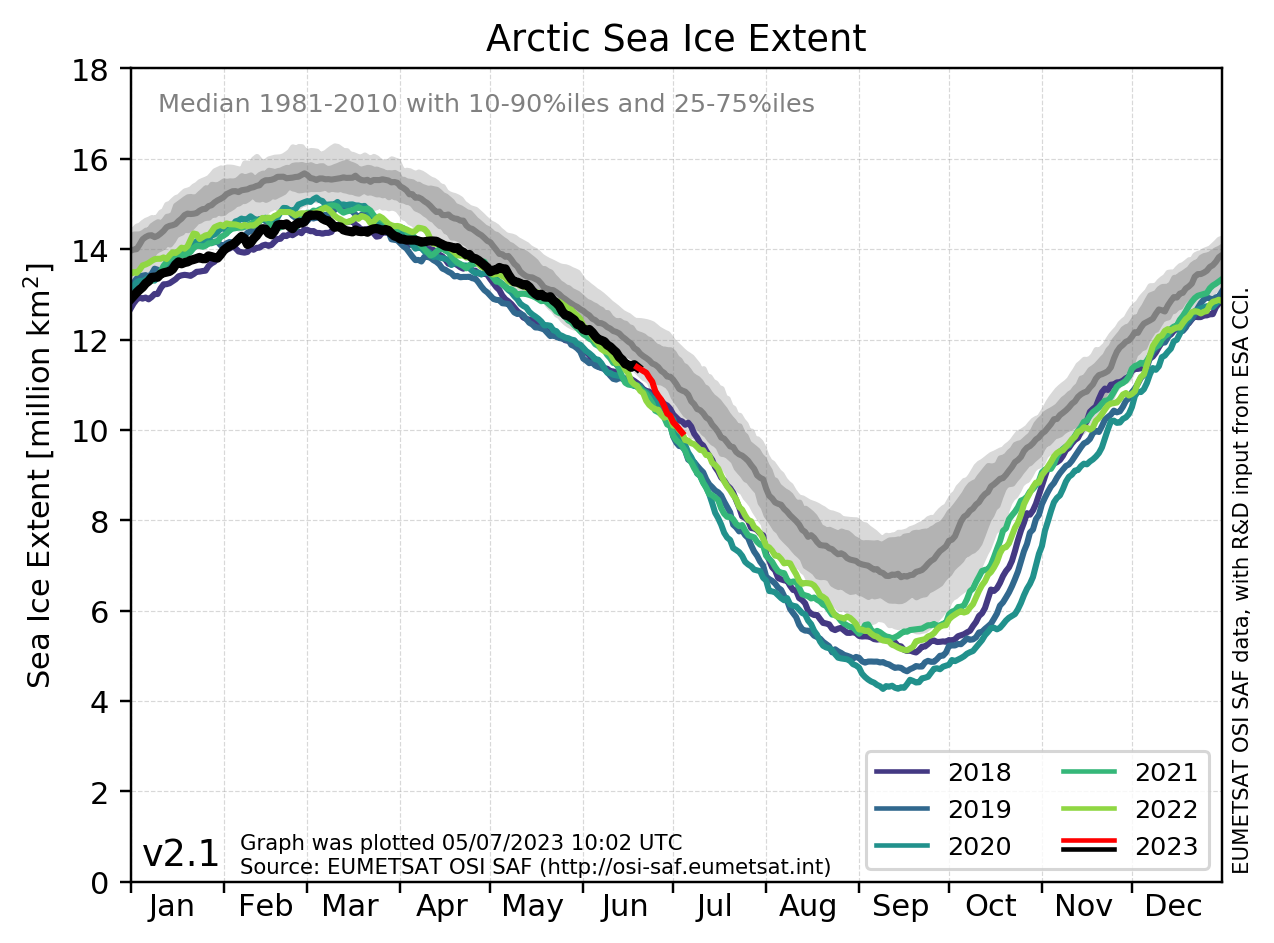
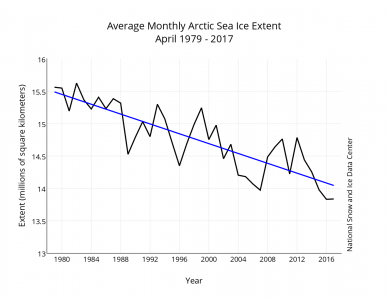
|
|
|
|
|
de
Schmelzendes Eis im Wasser ändert den Meeresspiegel nicht.
en
Melting Ice in the water doesn't change sea level.
Die arktische Eisfläche (Nordpol) besteht im Gegensatz zum Landeis von Grönland und der Antarktis aus auf dem arktischen Ozean schwimmenden Seeeis. |

-
de
Das Eis ist im Wasser, wenn es schmilzt, ändert sich der
Meeresspiegel nicht.
(im Gegensatz zu dem, was uns im Film von Al Gore gezeigt wird) - en "Of course, all this ice is in the water, so when it melts sea level doesn't change"
|
|
|
|
Arktis (Nordpol) |
de Nordpol: Keine Erwärmung seit fast 14 Jahren en Nord Pole: No warming for nearly 14 years |
|
|
Antarktis (Südpol) |
de Südpol: Keine Erwärmung seit 37 Jahren! en Südpol: Keine Erwärmung seit 37 Jahren! |
Entwicklung des arktischen und antarktischen Meereises
![]()
![]()
-
Die kalte Sonne
2016-05-08 de Arktisches Meereis wohl doch robuster als zuvor angenommen
Temperaturen
![]()
![]()
Temperatur-Entwicklung in der Arktis, 1860-2000
![]()
![]() Temperatur-Entwicklung in der Arktis, 1860-2000
Temperatur-Entwicklung in der Arktis, 1860-2000
-
Die kalte Sonne
2016-01-05 de Warum ist die arktische Eisbedeckung immer noch nicht verschwunden? trotz der zahlreichen Ankündigungen?
Temperaturentwicklung auf der Antarktischen Halbinsel
![]()
![]() Temperaturentwicklung auf der Antarktischen Halbinsel seit 1979
(schwarze Kurven).
Temperaturentwicklung auf der Antarktischen Halbinsel seit 1979
(schwarze Kurven).
Rote Linien stellen Trends dar.
Grauer Balken bei 1998 markiert Trendumkehr von Erwärmung auf Abkühlung.
Quellen / Sources:
-
Die kalte Sonne
2016-08-21 de British Antarctic Survey: Antarktische Halbinsel kühlt sich seit 1998 ab
-
Die kalte Sonne
2015-12-14 de 'Die Welt' erinnert an Lehre aus der Geschichte: Der Klimawandel hat Europa schon einmal zerstört - während der Kleinen Eiszeit!
-
EIKE Europäisches Institut für Klima und Energiee
2015-12-24 de Satelliten: Keine ,globale Erwärmung seit 18½ Jahren
Nordpol: Keine Erwärmung seit fast 14 Jahren
Südpol: Keine Erwärmung seit 37 Jahren!2016-02-16 de Globale Erwärmung? Die Antarktis kühlt dramatisch ab. Und die Arktis folgt.
-
Climate Depot
2015-12-17 en Satellites show no 'global warming' for 18 1/2 years
Nord Pole: No warming for nearly 14 years
Südpol: Keine Erwärmung seit 37 Jahren!
| de | en | fr |
|---|---|---|
|
Auswirkungen des Klimas Arktis (Nordpol) |
Effects of Climate Change Arctic (North Pole) |
Conséquences climatiques Arctique (Pôle Nord) |
| Temperaturen in der Arktis | Arctic Temperatures | Températures dans l'arctique |
| Meereis in der Arktis | Arctic Sea Ice | Banquise arctique |
↑
b Grönland
en Greenland
fr Grœnland
Temperaturen in Grönland
en Temperatures in Greenland
current change, not air temperature
fr Températures au Grœnland
- de
Grönlandtemperaturen
en Greenland Temperatures - de Wird es in Grönland wärmer ? Nein - kälter !
- de
Eine 4000-jährige Geschichte über Grönlands Oberflächentemperatur
en A 4000-Year History of Greenland Surface Temperature
↑
Grönlandtemperaturen
en Greenland Temperatures
![]()
![]() Temperature variations from the Greenland Glacier Ice Core
Temperature variations from the Greenland Glacier Ice Core
![]() Image from Internet Archive's Wayback Machine
Image from Internet Archive's Wayback Machine

-
Watts Up With That? (Antony Watts)
2009-03-01 en Limitations on Anthropogenic Global Warming
![]()
![]() Central Greenland surface temperature for the last millennium
Central Greenland surface temperature for the last millennium

-
CO2 Science
2010-09-01 en Greenland Temperatures of the Past Millennium Based on Nitrogen and Argon Isotopic Ratios
↑ Wird es in Grönland wärmer ? Nein - kälter !
|
|
|

-
Die Weltwoche / Hans Rentsch
2010-03-03 de Verzerrte BilderGrönland 0,4 Prozent Eisverlust - pro Jahrhundert
Aus «Climate of Extremes» stammen auch die folgenden Informationen.
In der Fernsehsendung «Larry King Live» mit Al Gore als Gast im Jahr 2007 wollte eine Frau wissen, wie sich der Klimawandel auf die Sicherheit der USA in den kommenden zehn Jahren auswirken würde.
Die Horrorgeschichte, die Gore der armen Frau auftischte, klang so:
«Wenn Grönland auseinanderbräche oder die Westantarktis oder die Hälfte von einem der beiden oder von beiden, hätten wir einen
Anstieg des Meeresspiegels von über sechs Metern,
und das würde zu mehr als 450 Millionen Klimaflüchtlingen führen.»
Was sagt die Klimaforschung zum «Auseinanderbrechen von Grönland»?
Der Vierte Sachstandsbericht des IPCC enthält eine Schätzung aus einem Computermodell, das eine im Vergleich zu heute fast dreimal höhere CO2-Pt-Konzentration annimmt.
Die Schätzung ergibt, dass es unter den genannten extremen Bedingungen für einen Eisverlust von fünfzig Prozent fast tausend Jahre brauchte.
Was sagen Satellitenbeobachtungen, die effektive Veränderungen messen?
Im Wissenschaftsjournal Science lieferten der Nasa-Forscher Scott Luthcke und seine Co-Autoren im Jahr 2006 Zahlen.
Satelliten massen für Grönland einen Eisverlust von 100 km3 pro Jahr.
Die gesamte Eismasse Grönlands beträgt 2,85 Millionen km3.
Das ergibt eine Verlustrate von 0,4 Prozent - nicht pro Jahr, sondern pro Jahrhundert.
Auch Grönland eignet sich nicht als Ikone des Klimawandels.
↑
Eine 4000-jährige Geschichte über Grönlands Oberflächentemperatur
en A 4000-Year History of Greenland Surface Temperature
![]()
![]()

-
Science Skeptical / Michael Krueger
2012-02-15 de Eine 4000-jährige Geschichte über Grönlands OberflächentemperaturVor kurzem ist in den Geophysical Research Letters, einem Fachjournal, welches von der American Geophysical Union (AGU) herausgegeben wird, ein Artikel über die Temperaturgeschichte Grönlands erschienen, welcher die aktuelle Klimaerwärmung, in Relation zu den vergangenen 4000 Jahren, in ein neues Licht setzt.
Eine Gruppe von acht Polar- und Klimaforschern aus Japan, den USA, Frankreich und Dänemark hat sich zusammengetan und anhand eines neuen Verfahrens die Temperaturgeschichte Zentral-Grönlands der letzten 4000 Jahre rekonstruiert. Argon- und Stickstoff-Isotopenverhältnisse von eingeschlossenen Luftblasen im Eisbohrkern GISP2 aus Zentral-Grönland wurden dabei untersucht, um die Schneeoberflächentemperatur der letzten 4000 Jahre zu rekonstruieren.
Die Rekonstruktion (untererer Teil der Abbildung) startet mit einer kälteren Periode in der Bronzezeit, gefolgt von einer wärmeren Periode, dem Klimaoptimum der Bronzezeit.
Eine 1000jährige Abkühlung folgt während der Eisenzeit.
Über die nächsten 1300 Jahre hinweg folgen weitere Warm- und Kaltzeiten, wie das Klimaoptimum der Eisen/Römerzeit, dass Klimapessimum der "dunklen" Völkerwanderungszeit und das Klimaoptimum des Mittelalters (im 11. bis 12.Jahrhundert).
Es schließt sich die kälteste Zeit der letzten 4000 Jahre an, die sogenannte "Kleine Eiszeit" (im 17. bis 18. Jahrhundert), welche dann in die aktuelle Klimaerwärmung übergeht.
Der mittlere und obere Teil der Abbildung zeigen, dass es während des Klimaoptimums des Mittelalters (1140er Jahre) und in der Zeit zwischen 1930-1950 genauso warm war, wie im letzten Jahrzehnt.
Weiter zurückliegend, in den ersten 3000 Jahren der Rekonstruktion, zeigen sich sogar deutlich wärmere Zeiten, als heute.
Dort sind 72 Jahrzehnte zu finden die wärmer waren (um 1-1,5°C), als das heutige.
In diesen Zusammenhang eingeordnet ist die heutige Warmzeit also nichts Außergewöhnliches.
-
CO2 Science
2012-02-15 de A 4000-Year History of Greenland Surface TemperatureBackground
The authors write that, supposedly, "Greenland recently incurred record high temperatures and ice loss by melting, adding to concerns that anthropogenic warming is impacting the Greenland ice sheet and in turn accelerating global sea-level rise."
However, they state that "it remains imprecisely known for Greenland how much warming is caused by increasing atmospheric greenhouse gases versus natural variability."
What was done
In rigorously exploring this question of recent warmth attribution, Kobashi et al. reconstructed "Greenland surface snow temperature variability over the past 4000 years at the GISP2 site (near the Summit of the Greenland ice sheet; hereafter referred to as Greenland temperature) with a new method that utilizes argon and nitrogen isotopic ratios from occluded air bubbles," as described in detail by Kobashi et al. (2008a,b).
What was learned
The eight researchers report that "the temperature record starts with a colder period in 'the Bronze Age Cold Epoch'," which they say was followed by "a warm period in 'the Bronze Age Optimum'," which was followed by a 1000-year cooling that began "during 'the Iron/Roman Age Optimum'," which was followed by "the Dark Ages," which was followed by "the Medieval Warm Period," which was followed by "the Little Ice Age" - which they describe as "the coldest period of the past 4000 years" - which was followed, last of all, by "the recent warming."
For comparative purposes, they also note that "the current decadal average surface temperature at the summit is as warm as in the 1930s-1940s, and there was another similarly warm period in the 1140s (Medieval Warm Period)," indicating that "the present decade is not outside the envelope of variability of the last 1000 years."
In fact, they say that "excluding the last millennium," there were fully "72 decades warmer than the present one, in which mean temperatures were 1.0 to 1.5°C warmer," and that during two centennial intervals, average temperatures "were nearly 1.0°C warmer than the present decade"
What it means
Since the Greenland summit's decadal warmth of the first ten years of the 21st century was exceeded fully six dozen times over the prior four millennia, it is clear that it was in no way unusual, unnatural or unprecedented; and, therefore, it is clear that none of Greenland's recent warming need have been caused by increasing greenhouse gases.
Indeed, it is far more likely that its recent warmth is nothing more than the next expected phase of the natural oscillation of climate that has produced several-hundred-year periods of alternating warmth and cold over the past four thousand years.
See Climate Oscillations (Millennia Variability) in our Subject Index for more on this important topic.
| de | en | fr |
|---|---|---|
|
Auswirkungen des Klimawandels Grönland |
Impacts of Climate Change Greenland |
Impacts du changement climatique Grœnland |
↑
c Antarktis (Südpol)
en Antarctic (South Pole)
fr Antarctique (pôle Sud)
|
|
Wikipedia Map of Antarctica |
|
|
|
|
|
|
|
|
|
|
|
|
Arktis (Nordpol) |
de Nordpol: Keine Erwärmung seit fast 14 Jahren en Nord Pole: No warming for nearly 14 years |
|
|
Antarktis (Südpol) |
de Südpol: Keine Erwärmung seit 37 Jahren! en Südpol: Keine Erwärmung seit 37 Jahren! |
Entwicklung des arktischen und antarktischen Meereises
![]()
![]()
-
Die kalte Sonne
2016-05-08 de Arktisches Meereis wohl doch robuster als zuvor angenommen
Temperaturen
![]()
![]()
Temperatur-Entwicklung in der Arktis, 1860-2000
![]()
![]() Temperatur-Entwicklung in der Arktis, 1860-2000
Temperatur-Entwicklung in der Arktis, 1860-2000
-
Die kalte Sonne
2016-01-05 de Warum ist die arktische Eisbedeckung immer noch nicht verschwunden? trotz der zahlreichen Ankündigungen?
Temperaturentwicklung auf der Antarktischen Halbinsel
![]()
![]() Temperaturentwicklung auf der Antarktischen Halbinsel seit 1979
(schwarze Kurven).
Temperaturentwicklung auf der Antarktischen Halbinsel seit 1979
(schwarze Kurven).
Rote Linien stellen Trends dar.
Grauer Balken bei 1998 markiert Trendumkehr von Erwärmung auf Abkühlung.
Quellen / Sources:
-
Die kalte Sonne
2016-08-21 de British Antarctic Survey: Antarktische Halbinsel kühlt sich seit 1998 ab
-
Die kalte Sonne
2015-12-14 de 'Die Welt' erinnert an Lehre aus der Geschichte: Der Klimawandel hat Europa schon einmal zerstört - während der Kleinen Eiszeit!
-
EIKE Europäisches Institut für Klima und Energiee
2015-12-24 de Satelliten: Keine ,globale Erwärmung seit 18½ Jahren
Nordpol: Keine Erwärmung seit fast 14 Jahren
Südpol: Keine Erwärmung seit 37 Jahren!2016-02-16 de Globale Erwärmung? Die Antarktis kühlt dramatisch ab. Und die Arktis folgt.
-
Climate Depot
2015-12-17 en Satellites show no 'global warming' for 18 1/2 years
Nord Pole: No warming for nearly 14 years
Südpol: Keine Erwärmung seit 37 Jahren!
| de | en | fr |
|---|---|---|
|
Auswirkungen des Klimas Antarktis (Südpol) |
Effects of Climate Change Antarctic (South Pole) |
Conséquences climatiques Antarctique (Pôle Sud) |
↑
d Gletscher
en Glaciers
fr Glaciers
Mit folgendem Link wird von anderen Webseiten auf diese Seite verwiesen.
▶Gletscher: Wann begannen die Gletscher zu schmelzen!
Wann begannen die Gletscher zu schmelzen?
en When did melting start?
fr Quand les glaciers ont-ils commencés à fondre?
|
|
de
Gletscherschwund vor Kohlenwasserstoff-Anstieg:
en
Glacier shortening before Hydrocarbon use increase:
fr
Font des glaciers avant l'augmentation des hydrocarbures: |

![]()
![]()
Aletsch-Gletscher im Verlaufe der letzten ca. 3'500 Jahre

Die Abbildung zeigt Vorstöße und Rückzüge des Aletsch-Gletscher im Verlaufe der letzten ca. 3.500 Jahre.
Seine maximale Größe hatte der Gletscher um 1860 erreicht.
|
|
de Veränderungen zwischen 2000-2010 von mehr als zweitausend per Satellit vermessenen Himalayagletschern.
Grün: stabil, Die Gletscher im Karakorum haben in den letzten drei Jahrzehnten an Masse zugelegt, nicht etwa verloren. en Number of glaciers showing retreat, advance or stability during 2000-01/02 to 2010-11. |

Fragen:
-
Seit wann schmelzen die Gletscher?
-
War am Anfang das CO2 schuld?
→ Warum sollte das CO2 heute schuld sein? -
Genügt Ihnen das nicht als Beweis der "Unschädlichkeit" des CO2?
→ Wenn nicht: Dann lesen Sie weiter in dieser Website!
| de | en | fr |
|---|---|---|
|
Auswirkungen des Klimas Gletscher |
Impacts of Climate Change Glaciers |
Impacts du changement climatique Glaciers |
↑
e Meeresspiegel
en Sea level
fr Niveau des océans
|
|
University of Colorado
Watts Up With That?
Permanent Service for Mean Sea Level (PSMSL)
SeaLevel.info |

|
|
de
Meeresspiegel-Anstieg vor Kohlenwasserstoff-Anstieg:
en
Sea level rise before Hydrocarbon use increase:
fr
Augmentation du niveau des océans avant l'augmentation des hydrocarbures: |

|
|
Meeresspiegel / Sea level / Niveau des océans |
| ▷Die Kalte Sonne Blog‑Themen Vahrenholt/Lüning ▶Die kalte Sonne |
de
▷Meeresspiegelanstieg
▷Artikel: Meeresspiegel |
| EIKE | de Meeresspiegel |
| Science Skeptical Blog | de Meeresspiegel |
| ►Der Wasserplanet (Ernst-Georg Beck) | de ▷Pole, Gletscher, Meeresspiegel (Wayback ohne Bilder) |
| WUWT | en Ocean Page en Sea Level |
| NoTricksZone | en Oceans |
| PSMSL | en Obtaining Tide Gauge Data |
| Wikipedia |
de
Meeresspiegel en Sea level fr Niveau de la mer |
| Vademecum |
▶Meeresspiegel
▶Welt-Info |
| Siehe auch |
▶Pole
▶Arktis ▶Antarktis ▶Grönland |
| de | en | fr |
|---|---|---|
|
Auswirkungen des Klimawandels Auswirkungen auf den Meeresspiegel |
Impacts of Climate Change Effects on Sea level |
Impacts du changement climatique Effets sur le niveau des océans |
↑
f Hurrikane
en Hurricanes
fr Ouragans

|
|
| de | en | fr |
|---|---|---|
|
Wetterphänomene Hurrikan |
Weather phenomena Hurricane |
Phénomènes météorologiques Ouragan |
↑
g Extremwetter
en Extreme Weather
fr Intempéries extrèmes
-
9. IKEK am 11.12.15 im Haus der Technik in Essen
Dipl.-Meteorologe Klaus-Eckart Puls
de
Extremwetter-Ereignisse : Was finden die Wetterdienste? Was schreibt der
Klimarat IPCC?
![]()
![]() Was finden die Wetterdienste?
Was schreibt der Klimarat IPCC?
Was finden die Wetterdienste?
Was schreibt der Klimarat IPCC?

IPCC AR 5/WG 1 Technical Summary: TS.6 Key Uncertainties (page 114)
Coordinating Lead Authors: Thomas F. Stocker (Switzerland),
Qin Dahe (China), Gian-Kasper Plattner (Switzerland)
Klaus-Eckart Puls, Dipl.-Meteorologe und ehemaliger Leiter der Wetterämter Essen und Leipzig stellt die Fakten zur Extremwetterentwicklung der letzten Jahrzehnte den Behauptungen in den Medien, dem IPCC in der "Summary for Policymakers", div. Klimafolgenforscher, wie dem PIK Direktor Hans-Joachim Schellnhuber und anderen, gegenüber.
Sein Ergebnis, die Daten zeigen in fast allen Kategorien fallende, statt - wie vielfach behauptet - steigende Trends.
Auch die Führung des Deutschen Wetterdienstes DWD verkündet, entgegen ihren eigenen Daten, dass die Extremwetter nach Zahl und Stärke zunehmen werden.
Es stimmt aber nur in einer Kategorie. Die Zahl der Sommertage hat in den letzten Jahren in Deutschland etwas zugenommen.
Ob der Trend anhält ist offen.
Das Fazit von K.-E. Puls
von einer Zunahme von Extremwettern kann weltweit keine Rede sein, die meisten Trends sind sogar negativ.
Und, Überraschung:
Diese Feststellungen finden sich wiederkehrend auch samt und sonders in den viele tausend Seiten der IPCC-Berichte.
Sie schaffen es nur nicht in die politisch redigierte Summary for Policy Makers.
Nur die aber werden von den Journalisten und Politikern gelesen.
Und darauf bauen die Alarmisten.
|
|
|

-
Blick
2014-10-16 de Zahl der Naturkatastrophen sinkt 2013 auf Zehn-Jahres-Tief
-
Watts Up With That? (Antony Watts)
2014-10-18 en World Disasters Report for 2013 - lowest number of catastrophies and deaths in 10 years
-
Quelle / Source:
International Federation of Red Cross and Red Crescent Societies (IFRC)
en World Disasters Report 2014
-
Die kalte Sonne (Fritz Vahrenholt & Sebastian Lüning)
2014-08-10 de Überraschung bei der Münchener Rückversicherung: Weniger Schäden durch Naturkatastrophen
-
Spielel Online
2012-10-18 de Profitable Katastrophen-Prognosen: Forscher rügen Klimawarnungen von VersicherungenKommentare:
Die kalte Sonne (Fritz Vahrenholt & Sebastian Lüning)
2012-11-11 de Spiegel Online zweifelt an Katastrophenszenarien der Münchener RückversicherungNoTricksZone (Pierre L. Gosselin)
2012-10-18 de Spiegel Slams Munich RE: Distortions Of Weather Extremes Are "Suspicious" And "Irresponsible Hype"
-
Die kalte Sonne (Fritz Vahrenholt & Sebastian Lüning)
2012-06-30 de Die Versicherungswirtschaft und die Klimakatastrophe: Eine unheimliche Liaison
|
|
Extremwetter / Extreme Weather / Intempéries extrèmes | ||
| ▷Die Kalte Sonne Blog‑Themen Vahrenholt/Lüning ▶Die kalte Sonne |
de
▷Extreme Wetterphänomene
▷Solare Millenniumszyklen ▷Hitzewellen ▷Kältewellen ▷Überschwemmungen (Flüsse) ▷Stürme ▷Artikel: Extremwetter |
||
| Science Skeptical Blog | en Schnee und Eis | ||
| ►Der Wasserplanet (Ernst-Georg Beck) |
de
▷Was ist Wärme?
(Wayback‑Archiv)
▷Atmosphäre und Wetterentstehung (Wayback ohne Bilder) ▷Wetterentstehung und Klima (Wayback ohne Bilder) |
||
| WUWT | en "Extreme Weather" Page | ||
| NoTricksZone | en Weather en Cooling | ||
| Wikipedia |
|
||
| Vademecum |
▶Extremwetter
▶Welt-Info |
||
| Siehe auch: | ▶Wetterphänomene |
| de | en | fr |
|---|---|---|
|
Wetterphänomene Extremwetter |
Weather phenomena Extreme Weather Events |
Phénomènes météorologiques Intempéries extrèmes |
↑
h Biosphäre
en Bioshphere
fr Biosphère
2010-04-09 en
![]() Seeing is Believing
Seeing is Believing
Isolated for 42 days in chambers of ambient and elevated CO2 concentrations, we periodically document the growth of cowpea plants (Vigna unguiculata) via time-lapse photography.
2013-03-13 en
![]() Matt Ridley on How Fossil Fuels are Greening the Planet
Matt Ridley on How Fossil Fuels are Greening the Planet
Over the past three decades, our planet has gotten greener!
Even stranger, the greening of the planet in recent decades appears to be happening because of, not despite, our reliance on fossil fuels.
While environmentalists often talk about how bad stuff like CO2 causes bad things to happen like global warming, it turns out that the plants aren't complaining.
-
Barrett Bellamy Climate
en The giver of lifeThis is a short description of the process of photosynthesis and how the carbon dioxide molecule gives us life as well as heat
The giver of life
This is a short description of the process of photosynthesis and how the carbon dioxide molecule gives us life as well as heat
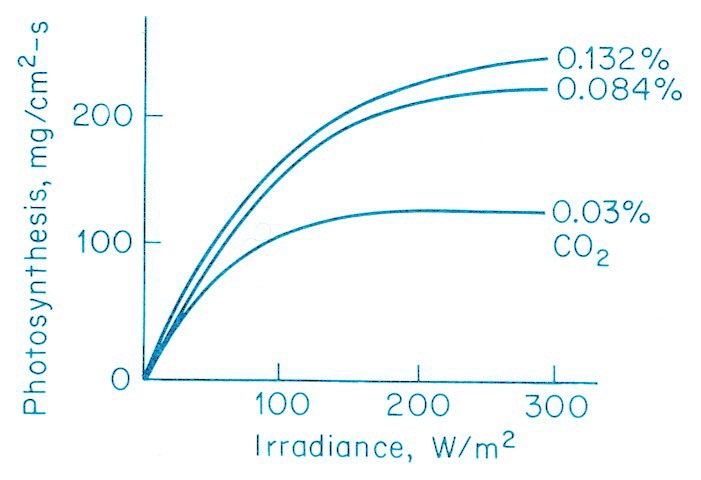
The graphs show how the rate of photosynthesis varies with irradiance, the three experiments differing only in the concentration of CO2.
The lowest graph is that for a CO2 concentration of 0.03%, much as it is at this time [actually ~385 ppmv or 0.0385%].
In the early part of the graph the rate of the reaction is related almost directly to the amount of irradiance, but the rate falls off at higher irradiances and eventually levels off.
This tells us that at higher irradiances it is the concentration of CO2 that limits the reaction rate, there is sufficient light falling on the leaves, but the requirement for more CO2 is the limiting factor.
We strongly object to CO2 being regarded as a pollutant; it is the giver of life and we all depend upon its chemical and radiative properties.
-
EIKE Europäisches Institut für Klima und Energie
H. Sterling Burnett 2015-09-22 de Interview: Kohlendioxid ernährt die WeltSherwood Idso, Ph.D.
Sherwood Idso, Ph.D., einer der weltführenden Kapazitäten auf dem Gebiet der Wirkung von Kohlendioxid auf Pflanzen, wurde im Jahre 2001 zum Präsidenten des 'Center for the Study of Carbon Dioxide and Global Change' berufen.
Idso wurde auch auf der 9. Internationalen Konferenz zum Klimawandel (ICCC-9) im Juli 2014 für sein Lebenswerk als Beitrag zur Wissenschaft ausgezeichnet.
Hier äußert er sich in einem Interview mit H. Sterling Burnett vom Heartland Institute.
Falls der Verbrauch fossiler Treibstoffe nicht närrischerweise limitiert wird im Zuge eines abwegigen Versuches, den Klimawandel zu verhindern - zuvor globale Erwärmung genannt - wird die erwartete Zunahme der CO2-Emissionen in der Atmosphäre die Ernteerträge sowie die Wasser-Effizienz aller in der Welt erzeugten Nahrungsmittel deutlich verbessern.
Dies erlaubt es uns die wachsende Weltbevölkerung weiter zu ernähren auch noch weit über das Jahr 2050 hinaus.
Dann werden Berechnungen zufolge etwa 9 Milliarden Menschen auf der Erde leben, verglichen mit den heutigen 7,2 Milliarden.
-
Heartland Institute / H. Sterling Burnett
2015-09-16 en Interview: CARBON DIOXIDE FEEDS THE WORLDSherwood Idso, Ph.D.
Sherwood Idso, Ph.D., one of the world's leading authorities on the effects of carbon dioxide on plants, became president of the Center for the Study of Carbon Dioxide and Global Change in 2001. Idso was honored at the Ninth International Conference on Climate Change (ICCC-9) in July 2014 for his lifetime contribution to science.
Idso wurde auch auf der 9. Internationalen Konferenz zum Klimawandel (ICCC-9) im Juli 2014 für sein Lebenswerk als Beitrag zur Wissenschaft ausgezeichnet.
Please tell our readers a little about your research background and how you ultimately came to study the carbon dioxide fertilization effect on plants.
I have found if fossil fuel usage is not foolishly restricted in a misguided attempt to prevent climate change - previously referred to as global warming - the expected increase in anthropogenic CO2 emissions will significantly enhance the yields and water-use efficiencies of essentially all of the world's food crops,
allowing us to continue to feed the world's growing population up to and far beyond the year 2050,
when it is expected to peak out at approximately nine billion people, compared to today's 7.2 billion.
-
NIPCC Nongovernmental International Panel on Climate Change
2014 en Climate Change Reconsidered II: Biological ImpactsSummary for Policymakers
The human impact on global climate is small, and any warming that may occur as a result of human carbon dioxide (CO2) and other greenhouse gas emissions is likely to have little effect on global temperatures, the cryosphere (ice-covered areas), hydrosphere (oceans, lakes, and rivers), or weather.
the subject of this Summary for Policymakers, examines the scientific research on the impacts of rising temperatures and atmospheric CO2 levels on the biological world (Idso et al., 2014).
It finds no net harm to the global environment or to human health and often finds the opposite: net benefits to plants, including important food crops, and to animals and human health
-
Le Monde
2016-04-28 fr La Terre verdit grâce aux émissions de CO2Le dioxyde de carbone rejeté par les activités humaines a accru la quantité de feuilles des arbres entre 1982 et 2009, selon un rapport couplant observations et modèles informatiques.
Une Terre plus verte, c'est-à-dire arborant une végétation plus dense.
C'est ce que démontre une étude publiée dans Nature Climate Change, lundi 25 avril, menée par une équipe de 32 scientifiques issus de 24 centres de recherche dans 8 pays du monde.
Pour parvenir à cette conclusion, les chercheurs ont étudié les données de trois satellites, qui ont mesuré la quantité de rayonnement solaire réfléchi par la végétation, jour après jour entre 1982 et 2009.
Ils en ont déduit un indice foliaire pour chaque parcelle de la planète, compris comme la quantité de feuilles par mètre carré de sol.
Evolution du couvert foliaire entre 1982 et 2009 (en %)

| de | en | fr |
|---|---|---|
|
Auswirkungen des Klimawandels Biosphäre der Erde Auswirkungen auf die Lebewelt |
Impacts of Climate Change Biosphere Impacts on the World of Life |
Conséquences du changement climatique Biosphère Impacts sur la vie terrestre |
⇧
15 Begriffe, Definitionen und Referenz-Seiten
en Terms, Definitions and Reference Pages
fr Termes, définitions et pages de références
fr Un épisode El Niño est caractérisé par des températures océaniques anormalement élevées dans le centre et l'est du Pacifique équatorial, tandis qu'un épisode La Niña représente la situation inverse, caractérisée par des températures océaniques anormalement basses dans l'est du Pacifique équatorial.
Ces deux manifestations du même phénomène perturbent la configuration habituelle des précipitations ainsi que la circulation atmosphérique aux latitudes tropicales et peuvent avoir des répercussions à grande échelle sur le climat dans de nombreuses régions du monde.
NOAA: El Niño and La Niña Pages
-
NOAA National Oceanic and Atmospheric Administration
en NOAA's El Niño Page
en NOAA La Niña Page
Watts: Reference Pages
-
Watts Up With That? (Antony Watts)
en Atmosphere Page: Temperature, Pressure etc.
en Atmospheric Oscillation Page
en ENSO Page
en Geomagnetism Page
en Global Temperature Page
en Ocean Page
en Oceanic Oscillation Page
en Polar Vortex Page
en Potential Climatic Variables Page
en Sea Ice Reference Page
en Solar Reference Page
en The Spencer-Braswell & Dessler papers
en Tropical Cyclone Page
en US Weather History Reference Page
Here you'll find a collection of the most commonly used graphs, images, and data sources.
| de | en | fr |
|---|---|---|
|
Klimawandel: Wissenschaft Ozeanzyklen & Ozeanische Oszillationen |
Climate change: Science Ocean Cycles & Ocean Oscillations |
Changement climatique: Science Cycles et oscillations océaniques |
| Ozeanzyklen steuern das Klima / El Niño (der Knabe/warm) & La Niña (das Mädchen/kalt) / ENSO: El Niño-Southern Oscillation / AMO: Atlantic Multidecadal Oscillation / NAO: North Atlantic Oscillation / AO: Arctic Oscillation / IOD: Indischer Ozean Dipol / PDO: Pacific decada oscillation | ||
⇧ 16 Globaler Erwärmungs-Stillstand seit 1998
| de | en | fr |
|---|---|---|
|
Klima Geschichte Klima heute |
Climate History The climate today |
Histoire du climat Le climat aujourd'hui |
↑
Über den globalen Erwärmungs-Stillstand seit 1998
en
Don't Expect Warming Until Mid Century!
CO2 Models "Have A Fundamental Problem"!
|
|
|


-
EIKE Europäisches Institut für Klima und Energie
Horst Malberg
2014-03-02 de Über den globalen Erwärmungs-Stillstand seit 1998
Quelle: Beiträge zur Berliner Wetterkarte
2014-01-28
Über den globalen Erwärmungs-Stillstand seit 1998
Wie in den letzten 15 Jahren evident geworden ist, haben die CO2-angetriebenen Klima-Modelle (und ihre Vertreter) ein fundamentales Problem:
Sie haben die aktuelle Klima-Entwicklung nicht bzw. falsch vorhergesagt.
Nach der CO2- Hypothese vom dominierenden anthropogenen Treibhaus-Einfluss auf das Klima müsste die globale Erwärmung in dem Maß fortschreiten, in dem der CO2-Gehalt der Luft zunimmt.
Im Vergleich zum CO2-Effekt wird in den Klima-Modellen den natürlichen Klima-Prozessen nur eine untergeordnete Rolle beim Klimawandel zuerkannt.
-
NoTricksZone (Pierre L. Gosselin)
2014-03-03 en German Meteorology Professor: Don't Expect Warming Until Mid Century! ... CO2 Models "Have A Fundamental Problem"!As is evident from the last 15 years, the CO2-driven climate models (and the people pushing them) have a fundamental problem: They did not, or falsely predicted, the current climate development.
The anthropogenic CO2 impact on climate is greatly over-estimated by the climate models and uncritical media, as the recent climate development clearly shows.
⇧
17 Prognosen für die Zukunft
en Prognostics for the Future
fr Pronostiques pour le future
| de | en | fr |
|---|---|---|
|
Klima Geschichte Klima in der Zukunft |
Climate History Climate in the future |
Histoire du climat Climat dans le futur |
| de | en | fr |
|---|---|---|
|
Neue Kälteperiode Kaltzeit |
New Cold Period Cold Period |
Nouvelle periode froide Periode froide |
| Voraussagen | Predictions | Prédictions |
| Kälte: Warnungen | Cooling: Warnings | Refroidissement: Avertissements |
| Erwärmung: Entwarnung | Warming: All-Clear | Réchauffement: Fin de l'alerte |
| Eiszeiten | Ice Ages | Glaciations |
↑
Es ist die Sonne, Dummkopf - die geringe Bedeutung des
CO2
en It's the Sun stupid - The minor significance of
CO2
-
EIKE Europäisches Institut für Klima und Energie
2013-02-24 de Es ist die Sonne, Dummkopf- die geringe Bedeutung des CO2Die Wassertemperaturen der NOAA zeigen, dass es trotz eines Anstiegs des CO2-Gehaltes um 8% seit 1997 keine Gesamterwärmung mehr gegeben hat, der Erwärmungstrend im Jahr 2003 seinen Höhepunkt erreicht und seitdem ein Abkühlungstrend eingesetzt hat.
Gegenwärtig legt die PDO nahe, dass wir in unmittelbarer Zukunft 20 bis 30 Jahre lang Abkühlung erwarten können.
-
Watts Up With That? (Antony Watts)
2013-02-20 en It's the Sun stupid - The minor significance of CO2The NOAA SSTs show that with CO2 up 8% there has been no net warming since 1997, that ,the warming trend peaked in 2003 and that there has been a cooling trend since that time.
Currently the PDO suggests we may expect 20 - 30 years of cooling in the immediate future.
⇧
18 Aus der Vergangenheit
en From the Climate History
fr De l'histoire du climat
- a
de
IPCC liess das Mittelalterliche Klimaoptimum und die Kleine Eiszeit
verschwinden
en IPCC changed viewpoint on the MWP in 2001
fr Le GIEC fait disparaître l'optimum climatique médiéval - b
de
Die Mittelalterliche Warmzeit -
Erwärmung oder Datenmanipulation?
en The Medieval Warm Period - warming or data manipulation? - c
de
Das römische Klimaoptimum in Nordamerika
en Roman Warm Period (North America) - d
de
Klimamodelle können nicht erklären, warum es vor 800 Jahren
wärmer war
en Climate models don't know why it was warmer 800 years ago - e
de
Eiszeiten in der Vergangenheit
en Ice ages in the past
fr Période glaciaires dans le passé
↑
a IPCC lässt das Mittelalterliche Klimaoptimum und die Kleine Eiszeit
verschwinden
en IPCC changed viewpoint on the MWP in 2001
fr Le GIEC fait disparaître l'optimum climatique médiéval
![]() de
de
![]() en
en
![]()
MWP = Medieval Warm Period (Mittelalterliche Warmzeit)
LIA = Little Ice Age (Kleine Eiszeit)
![]()
![]()
The "Hockey stick" curve
Ab 2001 verschwindet dieses geschichtlich belegte Phänomen.
-
Klimaskeptiker Info
2010-03-10 de Als das IPCC das Mittelalterliche Klimaoptimum verschwinden ließ...In älteren Veröffentlichungen des IPCC war das Mittelalterliche Klimaoptimum (Medieval Warm Period, MWP) enthalten.
Ab 2001 verschwindet dieses geschichtlich belegte Phänomen.
Es paßte nicht zu der Behauptung, die Erwärmung des 20. Jahrhunderts sei beispiellos gewesen.
Im Jahr 2001 reflektierte die Darstellung einer MWP die Mehrheitsmeinung innerhalb der Paläoklimatologie.
Das IPCC aber verbreitete ab 2001 einen neuen Standpunkt.
In der Folge erschienen mehrere Studien, die die Nichtexistenz des Mittelalterlichen Klimaoptimums bestätigte.Nach ClimateGate gibt es den Verdacht, daß bestimmte IPCC-verbundene Wissenschaftler wie Phil Jones das Erscheinen bzw. Nicht-Erscheinen von Studien manipuliert haben, um ihren Standpunkt der beispiellosen anthropogenen Erwärmung zu untermauern.
IPCC oder ihm nahestehende Personen haben also die wissenschaftliche Arbeit kontrolliert oder manipuliert.
Fazit: Die IPCC-Berichte haben mit seriöser Wissenschaft nichts zu tun.
Diese Veröffentlichungen sind nichts als bloße politische Propaganda.
-
Hide the decline
2010-03-08 en IPCC changed viewpoint on the MWP in 2001 - did this have effect on scientific results?
-
2006-12-06 en
"We have to get rid of the Medieval Warm Period!"
Video of Dr David Deming's statement to the U.S. Senate Committee on Environment & Public Works on December 6, 2006.
Dr Deming reveals that in 1995 a leading scientist emailed him saying "We have to get rid of the Medieval Warm Period".
A few years later, Michael Mann and the IPCC did just that by publishing the now throughly discredited hockey stick graph.
↑
b Die Mittelalterliche Warmzeit -
Erwärmung oder Datenmanipulation?
en The Medieval Warm Period -
warming, or data manipulation?
![]() Click for an interactive graphic that will expand each graph on mouseover
Click for an interactive graphic that will expand each graph on mouseover

-
Watts Up With That? (Antony Watts)
2009-11-29 en The Medieval Warm Period - a global phenomenon, unprecedented warming, or unprecedented data manipulation?
↑
c Das römische Klimaoptimum in Nordamerika
en
Roman Warm Period (North America)
-
Klimaskeptiker Info
2010-06-09 de Das römische Klimaoptimum in Nordamerika
-
CO2 Science
2010-06-09 de Roman Warm Period (North America) -- Summary
↑
d Klimamodelle können nicht erklären, warum es vor 800 Jahren
wärmer war
en
Climate models don't know why it was warmer 800 years ago
|
|
|


-
Klimaskeptiker Info
2009-12-04 de Jo Nova findet das mittelalterliche Klimaoptimum
Eine der Kernbehauptungen der Klima-Alarmisten ist es, daß es in den letzten paar tausend Jahren nicht so warm war wie gegenwärtig und daß dies ein Beleg für den menschlichen Einfluß auf die Temperatur sei.
Aber im Hochmittelalter war es deutlich wärmer als jetzt.
-
JoNova
en Fraudulent hockey sticks and hidden data
These maps and graphs make it clear just how brazen the fraud of the Hockey Stick is.
It's clear that the world was warmer during medieval times.
Marked on the map are study after study (all peer-reviewed) from all around the world with results of temperatures from the medieval time compared to today.
These use ice cores, stalagmites, sediments, and isotopes.
They agree with 6,144 boreholes around the world which found that temperatures were about 0.5°C warmer world wide.
de Aus der Panik-Küche en From the panic laboratory fr De la marmite des alarmistes
-
2009-11-25 en
Al Gore Lies about Melting Ice and Rising Sea Levels
↑
e Eiszeiten in der Vergangenheit
en Ice ages in the past
fr Période glaciaires dans le passé
-
Watts Up With That? (Antony Watts)
2009-05-13 en '90% of the last million years, the normal state of the Earth's climate has been an ice age'
-
NZZ
2004-01-24 de Die Kleine Eiszeit, eine frühneuzeitliche KlimakatastropheBemerkung:
Lesen Sie den Artikel bis zum Schluss, in dem die Frage gestellt wird, ob heute die Politiker, Umweltschützer, Geschäftsleute, Profiteure und Mitläufer mit der "Klimakatastrophe" die gleiche Hexenjagd auf CO2-Verursacher durchführen, wie dies im späten Mittelalter mit den "Schuldigen an der Eiszeit" geschehen ist.
-
Burghard Schmanck de Realsatire?
(Es soll auch an diejenigen gedacht werden, die selbst nachdenken und ihren Arbeitsplatz verlieren, wenn sie nicht die offizielle Auffassung vertreten)
| de | en | fr |
|---|---|---|
|
Klima-Diskurse: Diskussionen Ausschluss und Maulkorb für Kritiker |
Climate Discurses: Discussions Exclusion of critics |
Clima discurs: Discussions Exclusion des critiques |
⇧
19 Panikmeldungen und Antwort in dieser Website
en Panic messages and response in this website
fr Informations de panique et réponses dans ce site

↑
a Panikseiten und Realität
en Panic sites and reality
fr Sites paniquants et la réalité
↑ Beispiele / Examples
de Panik
Beispiel:
-
EIKE Europäisches Institut für Klima und Energie
2009-06-20 de Bild schürt Klimapanik: 50 °C in Konstanz möglich!
Antwort:
| de | en | fr |
|---|---|---|
|
Neue Kälteperiode Kaltzeit |
New Cold Period Cold Period |
Nouvelle periode froide Periode froide |
| Voraussagen | Predictions | Prédictions |
| Kälte: Warnungen | Cooling: Warnings | Refroidissement: Avertissements |
| Erwärmung: Entwarnung | Warming: All-Clear | Réchauffement: Fin de l'alerte |
| Eiszeiten | Ice Ages | Glaciations |
en Panic
Example:
-
350 Org en
Mission
"Our focus is on the number 350 - as in parts per million, the level scientists have identified as the safe upper limit for CO2 in our atmosphere."
Reply:
These people ignore that there is already a
saturation of CO2 response.
As Carbon Dioxide increases it has less Warming Effect.
| de | en | fr |
|---|---|---|
| Kohlenstoffdioxid (CO2) | Carbon dioxide (CO2)" | Dioxyde de carbone (CO2)" |
|
Der CO2-Sättigungseffekt Wenn die CO2-Konzentration zunimmt, hat es einen kleineren Erwärmungseffekt |
Der CO2-Sättigungseffekt As Carbon Dioxide increases it has less Warming Effect |
Der CO2-Sättigungseffekt Lorsque la concentration du CO2 augmente, son effet de réchauffement diminue |
fr Panique
Exemple:
- TACA
Réponse:
Les activistes de la "Taxe carbone" utilisent la fausse courbe
"bâton de hockey"
pour ne pas montrer que la température était
bien plus élevée pendant plusieurs périodes dans le passé.
(et pour faire croire, que les températures actuelles montent à cause du
CO2 au lieu de constater qu'elles
baissent maintenant malgré que le CO2 continu
à monter)
↑ Realität / Reality / Réalité
|
|
de Der IPCC-Bericht von 2001 unterschlägt die früheren Perioden, die wärmer waren als heute: "aktuelle Belege sprechen nicht für globale synchrone Perioden von anomaler Kälte oder Wärme während dieses Zeitrahmens, und die geläufigen Begriffe 'Kleine Eiszeit' und 'Mittelalterliches Klimaoptimum' scheinen nur geringen Wert zur Beschreibung hemisphärischer oder globaler Trends oder Veränderungen der Durchschnittstemperaturen in vergangenen Jahrhunderten zu haben.". en The 2001 IPCC report suppresses evidence of earlier periods warmer than today: "current evidence does not support globally synchronous periods of anomalous cold or warmth over this time frame, and the conventional terms of 'Little Ice Age' and 'Medieval Warm Period' appear to have limited utility in describing trends in hemispheric or global mean temperature changes in past centuries". fr Le rapport 2001 du GIEC escamote les périodes du passé plus chaudes qu'aujourd'hui |

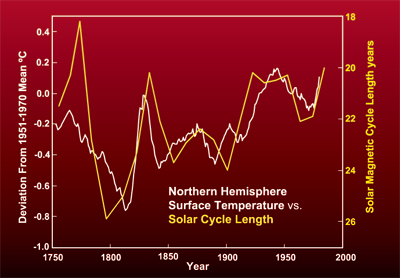
|
Ursachen des Klimawandels Pensée unique (Jean Martin) |
|
|
de
Gletscherschwund vor Kohlenwasserstoff-Anstieg:
en
Glacier shortening before Hydrocarbon use increase:
fr
Font des glaciers avant l'augmentation des hydrocarbures: |
|
|
Sea levels measured by satellites are falling since the end of 2006 |

|
en Despite popular opinion and calls to action, the Maldives are not being overrun by sea level rise
en
|
|
|
|
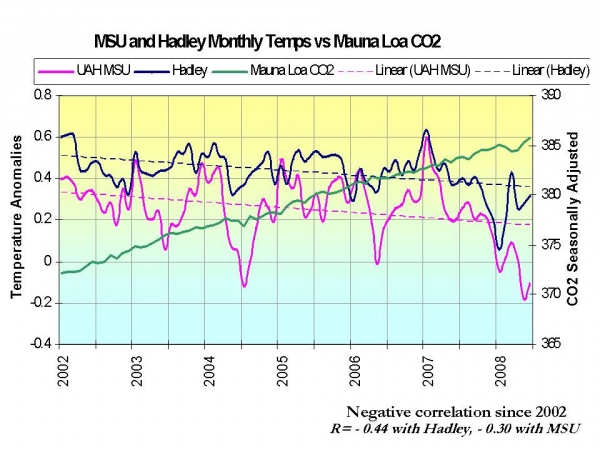
|
de Das CO₂ steigt und die Temperaturen fallen.
Wenn das CO₂ die Erwärmung erklärt,
muss es auch die Abkühlung erklären ...
oder es muss eine andere Erklärung
gefunden werden, en CO₂ is rising and the temperatures are falling.
If the CO₂ explains the warming,
it must also explain the cooling ...
or another explanation must be found fr Le CO₂ monte et les températures baissent.
Si le CO₂ explique le réchauffement,
il doit aussi expliquer le refroidissement ...
ou bien une autre explication doit être trouvée, |
![]()
![]() Climate Models vs Reality
Climate Models vs Reality
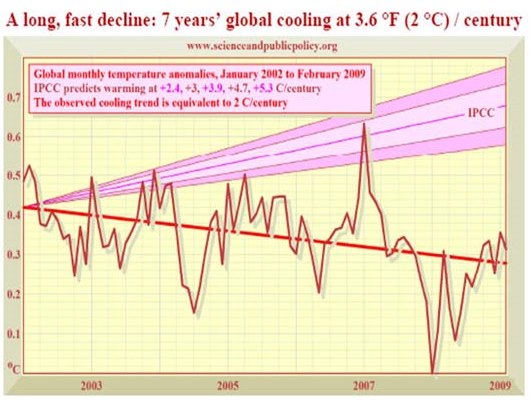
en
![]() Evidence CO2 does not cause dangerous Global warming
Evidence CO2 does not cause dangerous Global warming
en
![]() Al Gore Debates Global Warming
Al Gore Debates Global Warming
en
![]() Elevated CO2 : How Sweet it is ...
for Sugarcane!
Elevated CO2 : How Sweet it is ...
for Sugarcane!
en
![]() Some interesting observations concerning CO2 in the atmosphere
Some interesting observations concerning CO2 in the atmosphere
en
![]() Environmental Effects of Increased Atmospheric Carbon Dioxide
... more
Environmental Effects of Increased Atmospheric Carbon Dioxide
... more
| de | en | fr |
|---|---|---|
| Klimawandel: Probleme | Climate change: Problems | Changement climatique: Problèmes |
| Falsche CO2-Konzentrationen von IPCC und Kyoto | Wrong CO2-Concentrations of IPCC and Kyoto | Fausses concentrations du CO2 du GIEC et de Kyoto |
| de | en | fr |
|---|---|---|
|
Klimawandel: Wissenschaft Steigende Temperatur bewirkt CO2-Anstieg (nicht umgekehrt! - zuerst kommt die Temperatur!) |
Climate Change: Science Temperature responsible for CO2 rise (not the other way round!) |
Changement climatique: Science La température fait monter le CO2 (pas le contraire!) |
| de | en | fr |
|---|---|---|
|
Physikalische Aspekte Der Atmosphäreneffekt Forschungen |
Physical aspects The atmosphere effect Forschungen |
Aspects physiques L'effet de l'atmosphère Recherches scientifiques |
↑
b Klimawissenschaftler betreiben Irreführung der Öffentlichkeit
en Scientists must rein in misleading climate change claims
fr Tromperies
Panik-Beispiele / Examples of panic information / Exemples d'informations de panique
-
de James Hansen, Direktor des the Nasa Goddard Institute for Space Studies in New York, lehnt sich übrigens besonders gerne besonders weit aus dem Fenster, wie kürzlich, als er die Kohle-Züge zur Versorgung von Kraftwerken als Todeszüge und Kohlekraftwerke als Todes-Fabriken bezeichnete.
de Als jüngstes Beispiel wird von Dr. Pope der Grönland-Eisschild angeführt: Einerseits reiten Alarmisten die These, dass das Eis massiv abschmilzt, anderseits wurde kürzlich in der Zeitschrift Science veröffentlicht, dass sich die "galoppierenden Grönland Gletscher" selbst gezügelt haben. Wie so oft wurde die natürliche Variabilität ignoriert, und selektive Indizien wurden als "Beweis" für den dramatischen Klimawandel instrumentalisiert.
-
Guardian CO UK / James Hansen
James Hansen, director of the Nasa Goddard Institute for Space Studies in New York, marks the 20th anniversary of his groundbreaking statement to Congress by sayingthere's no time left to delay in defusing the global warming time bomb
2008-06-23 en Twenty years later: tipping points near on global warming
-
en James Hansen: "The trains carrying coal to power plants are death trains."
"Coal-fired power plants are factories of death."
Watts up with that? (Antony Watts)
2009-02-15 en Hansen on "death trains" and coal and CO2
-
Watts Up With That? (Antony Watts)
2009-05-05 en Unprecedented Incoherence In The Ice Message
Realität / Reality / Réalité
-
Watts Up With That? (Antony Watts)
2009-04-17 en New Milepost for Arctic Sea Ice Extent
-
Watts up with that? (Antony Watts)
2009-03-02 en Poll and Polar Ice Trends
-
Guardian CO UK / Vicky Pope
Overplaying natural variations in the weather diverts attention from the real issues
2009-02-11 en Scientists must rein in misleading climate change claims
-
Guardian CO UK / David Adam
Met Office scientists fear distorted climate change claims could undermine efforts to tackle carbon emissions
2009-02-11 en 'Apocalyptic climate predictions' mislead the public, say experts
-
Science / Richard A. Kerr
Ice loss in Greenland has had some climatologists speculating that global warming might have brought on a scary new regime of wildly heightened ice loss and an ever-faster rise in sea level. But glaciologists reported at the American Geophysical Union meeting that Greenland ice's Armageddon has come to an end.
2009-01-23 en FALL MEETING OF THE AMERICAN GEOPHYSICAL UNION: Galloping Glaciers of Greenland Have Reined Themselves In
-
Skyfall / Changement Climatique
2009-04-22 fr Météo des banquises
⇧
20 Publikationen
en Publications
fr Publications
- a de
Mythos Treibhauseffekt: Der Klima-Schwindel
Rettung vor den Klimarettern - Gibt es die "Gefahr für das Weltklima"? - b en The Climate Skeptics Party launch 4 television ads in Australia
- c en Current Global Temperatures Impossible According to IPCC 'Science'
- d de Das wissenschaftliche Ende der Klimakatastrophe?
- e de Klimawandel durch Kohlendioxid? Wissenschaftsskandal oder Abzockerei?
- f de Horst Malberg: Langfristiger Klimawandel auf der globalen, lokalen und regionalen Klimaskala und seine primäre Ursache
- g en Not Evil Just Wrong
- h de Augenmaß beim Klimaschutz
- i de IPCC-Experte Richard Courtney lehnt "Klimaschutz" ab
- j de Zur künstlich herbeigeführte Klimapsychose: Cui Bono?
- k de CO2 - und Klimahysterie
- l de Wird jemand die globale Abkühlung bemerken?
- m de Wird alles immer schlimmer? - Kommt die Klimakatastrophe?
- n de "Klimaschutz" ist schädlich
- o en Name just three clear signs the planet is warming
- p de Was bedeutet der globale CO2-Anstieg für das Klima? - Nichts!
- q de
Freispruch für CO2
en Disproving The Anthropogenic Global Warming (AGW) Problem
↑
a Mythos Treibhauseffekt: Der Klima-Schwindel
Rettung vor den Klimarettern - Gibt es die "Gefahr für das Weltklima"?
-
Standpunkte / Thomas Eppinger
2009-12-09 de Mythos Treibhauseffekt: Der Klima-Schwindel
Die gesamte Menge des anthropogenen, also vom Menschen verursachten, CO2 macht ungefähr 1-3% des gesamten freigesetzten CO2 auf dem Planeten aus, der Rest kommt aus der Natur.
Dieses Volumen hat an der reinen Atmosphäre einen Anteil von 0,001 bis 0,002 Prozent.
-
Klaus Ermecke (KE-Research)
2009-12 de
Rettung vor den Klimarettern - Gibt es die "Gefahr für das Weltklima"?
↑ en b The Climate Skeptics Party launch 4 television ads in Australia
-
Watts up with that? (Antony Watts)
2009-11-19 en
The Climate Skeptics Party launch 4 television ads in Australia
↑ en c Current Global Temperatures Impossible According to IPCC 'Science'
|
|
|
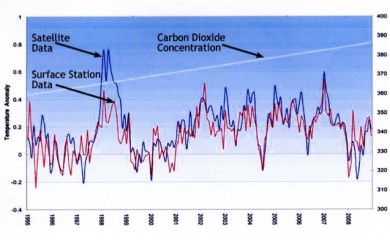
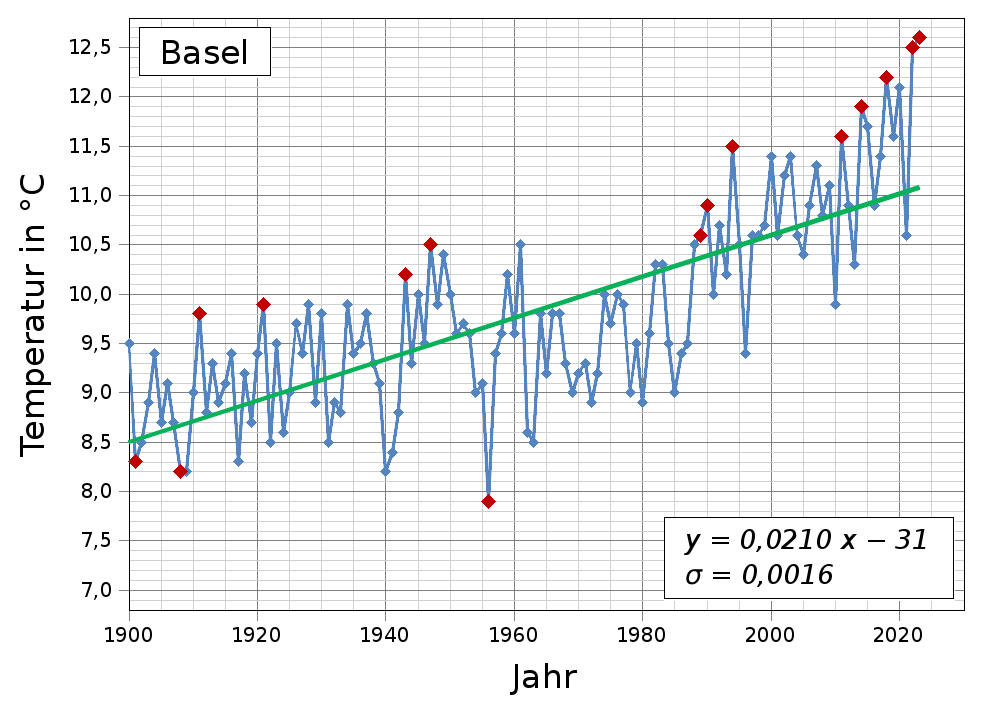
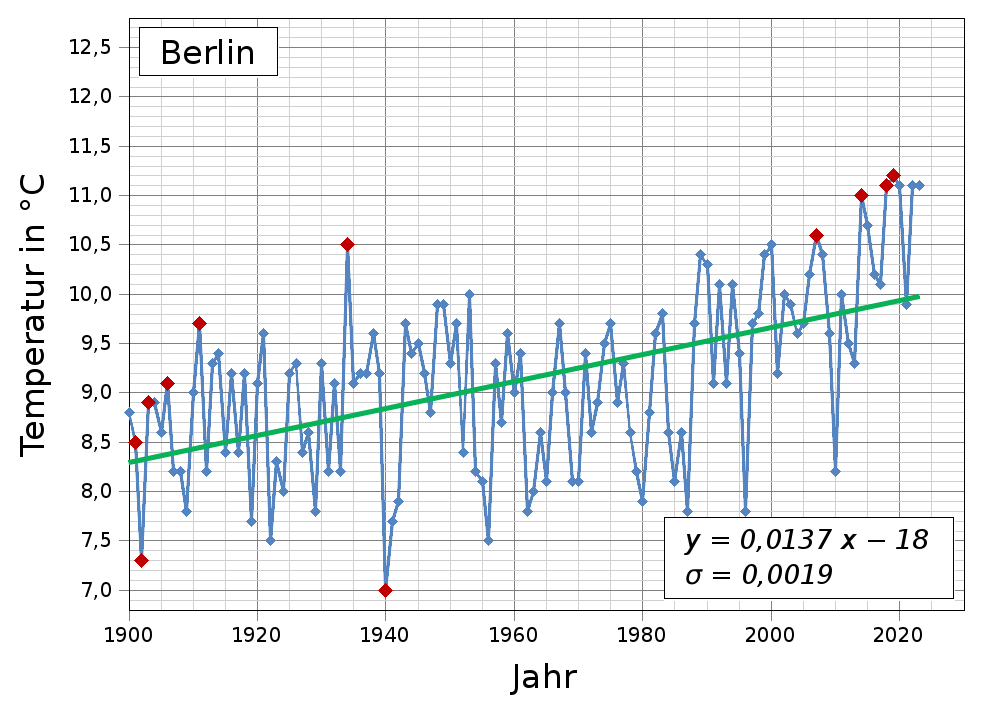
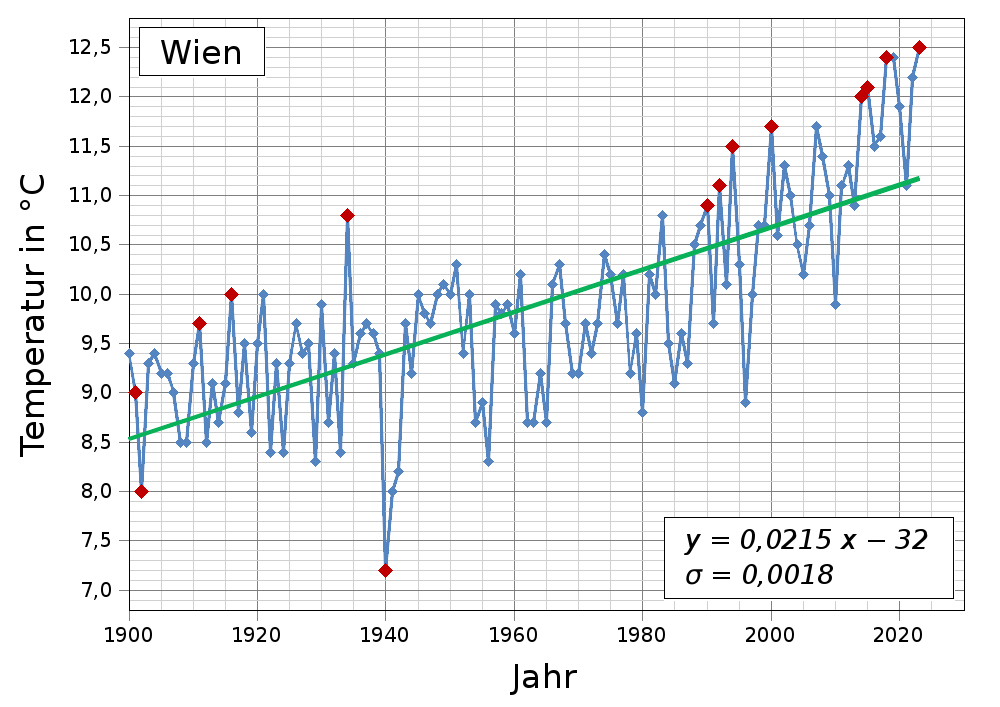
-
CFP Canada Free Press / Dr. Tim Ball
2009-11-02 de Current Global Temperatures Impossible According to IPCC 'Science' -
UN Secretary General Ban Ki-Moon says, "Unless we fight climate change, unless we stop this trend, we'll have devastating consequences for humanity".
Obama claims the "threat from climate change is serious, it is urgent, and it is growing".
Facts Contradict Hypothesis
- The Holocene Optimum from 3000 to 8000 years ago was warmer than today.
- The last three Interglacial periods were warmer than the current one.
-
The claim of 0.6 degrees C rise during industrial times was
unverifiable because the scientist refused to disclose the evidence
and then the government 'lost' the data
( UK Met Office (HadCRUT - Hadley Centre) and The Dog Ate Global Warming). - Four of the warmest years on record in the US were in the 1930s not the 1990s as claimed.
- 1934 was the warmest in the US not 1998 as claimed.
- The Goddard Institute of Space Studies (GISS) adjusted historic data down to make the modern record relatively warmer.
- Temperature increases before CO2 in all records.
- CO2 levels currently at 388 ppm are the lowest in 300 million years.
- There's a limit of at most 1.4 degrees C to the amount of temperature can increase even if CO2 doubles or triples.
- In the 20th century human production of CO2 didn't fit the temperature record.
- From 1900 to 1940 human CO2 production levels were low but temperatures increased the most.
- From 1940 to 1980 human production levels increased the most but temperature declined.
- The models predicted the atmosphere would warm faster than the surface but the opposite is happening.
↑ d Das wissenschaftliche Ende der Klimakatastrophe?
-
EIKE Europäisches Institut für Klima und Energie
2009-11-12 de Das wissenschaftliche Ende der Klimakatastrophe? -
CO2 allein kann aus allgemein anerkannten physikalischen Gründen nicht zu dieser großen Temperaturerhöhung führen.
Eine Verdopplung des CO2 Anteils in der Atmosphäre vom vorindustriellen Wert 280 ppmV auf 560 ppmV, was der Verbrennung sämtlicher fossiler Energiereserven der Erde entspräche, führt gemäß IPCC-Bericht vom Jahre 2001 nur zu einer Temperaturerhöhung von 0,8 °C.
Dies liegt innerhalb der natürlich bedingten Klimaschwankungen des letzten Jahrtausends und bietet keinerlei Anlass zu katastrophalen Zukunftsszenarien.
-
Das IPCC und seine Klimamodelle sagen allerdings aus, dass durch eine positive Rückkopplung vermittels erhöhter Wasserdampfkonzentration in der Atmosphäre durchaus alarmierende Temperaturen erzeugt werden könnten.
Hierbei soll die zunächst relativ geringfügige, allein durch den Beitrag des CO2 bewirkte Erwärmung vermehrt Wasserdampf ausgasen lassen, dessen wesentlich stärkerer Treibhauseffekt dann für weit höhere Temperatursteigerungen sorgt.
Es gibt allerdings auch negative Rückkoppelungen (Gegenkoppelungen).
Ein Beispiel: Zunehmender Wasserdampf führt zu stärkerer Wolkenbildung, die Wolken schirmen die Sonneneinstrahlung ab und wirken abkühlend. Gegenkoppelungen wurden allerdings bisher auf Grund fehlender Messdaten in den Klimamodellen nicht berücksichtigt.
-
Ein negativer Rückkopplungseffekt, gleichbedeutend mit Abschwächung bzw. einem Rückkoppelungsfaktor kleiner als Null, würde zu einer geringeren Anhebung der globalen Temperatur als die oben genannten 0,8 °C bei Verdopplung der CO2 Konzentration in der Atmosphäre führen.
-
Mit dem nunmehr durch Messungen belegten, korrekten Rückkopplungsfaktor aus dem ERBE-Projekt von f = -1 ergibt sich dagegen nur die Temperaturerhöhung DT = 0,5 °C für eine Verdopplung der CO2 Konzentration in der Atmosphäre.
Die Messungen zeigen daher klar und eindeutig, dass eine Erhöhung der CO2-Konzentration auf das Doppelte (Verbrauch aller fossilen Brennstoffreserven) bis zum Ende dieses Jahrhunderts keinerlei Gefahr für das Erdklima bedeuten kann.
Selbst eine noch unrealistischere Verdopplung, also Vervierfachung der CO2 Emission (Verbrennung der doppelten Menge der Reserven) würde wegen der logarithmischen Abhängigkeit der Globaltemperatur von der CO2-Konzentration und der nunmehr nachgewiesenen negativen Rückkoppelung nur zu einer globalen Temperaturerhöhung von 1 °C führen.
-
Klimaskeptiker Info
2009-07-23 de Beobachtungsdaten sprechen für geringe Klimasensitivität
Die AGW-Anhänger sprechen einer Verdopplung des atmosphärischen CO2 gegenüber dem sogenannten "vorindustriellen Niveau" von ca. 280 ppmV einen globalen Temperatureffekt von +2°C bis +6°C zu - die sogenannte Klimasensitivität.
Ein Großteil dieser Klimasensitivität soll sich nach den AGW-Hypothesen aus positiven Rückkopplungen ergeben (die Auswirkungen von Wärme erzeugen mehr Wärme).
Bei der Untersuchung von Beobachtungsdaten (im Gegensatz zur Standard-Methode der AGW-Anhänger, das Klima anhand von Modellen zu untersuchen) kamen jetzt Richard S. Lindzen und Yong-Sang Choi zu anderen Ergebnissen.
Sie haben bei der Analyse von Daten aus dem Earth Radiation Budget Experiment (ERBE) Hinweise auf schwächere oder sogar negative Rückkopplungen gefunden, als sie in den IPCC-Klimamodellen angenommen werden.
"Das beobachtete Verhalten der Strahlungsflüsse impliziert negative Rückkopplungen, verbunden mit relativ geringer Klimasensitivität.
Dies steht im Gegensatz zu dem Verhalten von 11 Atmosphäremodellen.
Daher zeigen die Modelle eine weit größere Klimasensitivität als es von ERBE nahegelegt wird."
Andere Ergebnisse aus den letzten Monaten deuten in dieselbe Richtung:
Die AGW-Anhänger haben die Klimasensitivität von CO2 überschätzt oder übertrieben
-
Whatts Up With That? (Antony Watts)
2009-07-23 en New paper from Lindzen demonstrates low climate sensitivity with observational data
The observed behavior of radiation fluxes implies negative feedback processes associated with relatively low climate sensitivity.
This is the opposite of the behavior of 11 atmospheric models forced by the same SSTs.
Therefore, the models display much higher climate sensitivity than is inferred from ERBE, though it is difficult to pin down such high sensitivities with any precision.
Results also show, the feedback in ERBE is mostly from shortwave radiation while the feedback in the models is mostly from longwave radiation.
Although such a test does not distinguish the mechanisms, this is important since the inconsistency of climate feedbacks constitutes a very fundamental problem in climate prediction.
-
Richard S. Lindzen and Yong-Sang Choi
2009-07-14 en
On the determination of climate feedbacks from ERBE data
-
NASA
2005-05-10 de The Earth Radiation Budget Experiment (ERBE)The radiation budget represents the balance between incoming energy from the Sun and outgoing thermal (longwave) and reflected (shortwave) energy from the Earth.
↑ e Klimawandel durch Kohlendioxid? Wissenschaftsskandal oder Abzockerei?
-
EIKE Europäisches Institut für Klima und Energie
2009-10-08 de Dr. sc. agr. Albrecht Nitsch: Klimawandel durch Kohlendioxid? Wissenschaftsskandal oder Abzockerei? -
Vorab dieser Hinweis:
Strikt getrennt werden müssen diese genannten Betrachtungen zum CO2 von dem Gebot zum sparsamen Umgang mit fossilen Energiequellen.
Das sollte nicht verwechselt werden.
Ein sparsamer Umgang ist nur zu unterstützen.
Jedoch sind die Forderungen des Weltklimarates intensiv zu hinterfragen!Doch zuvor wenige Erklärungen zum Klimawandel und dem CO2.
-
Klima - das geordnete Chaos
Das Klima umfasst das langjährige, mindestens das dreißigjährige Wettergeschehen an einem Ort mit vielen Kenngrößen wie Temperatur, Niederschlag, Windgeschwindigkeit, Luftdruck, Luftfeuchtigkeit, Sonnenscheindauer usw..
Es sicherlich nicht falsch, beim Klima von einem "Zustand des geordneten Chaos" zu sprechen, da die einzelnen Klimakomponenten derzeit rechnerisch nicht bewertet werden können, auch nicht mit den besten Computern.
Klimavorhersagen sind somit nicht möglich!
Auch gab es noch nie einen Klimastillstand.
Daher ist der Gebrauch des Begriffs Klimawandel oder Klimaänderung in diesem Zusammenhang fachlich nicht korrekt, denn er suggeriert, dass es bisher einen Klimastillstand gegeben habe.
Vielfältige Beweise dafür liefern z. B. Polenanalysen, Jahresringe der Bäume, Bodenprofile, ehemalige Siedlungsstätten im Küstenbereich, die stetigen Anstiege der Meerespiegel in den letzten Jahrtausenden usw.).
-
Kohlenstoffdioxid - das CO2
Der Weltklimarats beschreibt das CO2 nur (!) als Treibhausgas mit der negativen Eigenschaft eines "globalen Erwärmungspotentials".
Jedoch ist das CO2 neben 16 anderen Nährelementen mengenmäßig das wichtigste Nährelement in unserer Nahrungskette! Das sollte jeder wissen!
Es wird aus der Luft über die Spaltöffnungen der Blätter (Stomata) aufgenommen und mit der Photosynthese der Pflanzen zu Zucker, Eiweiß und Fett "verarbeitet".
Die aufgenommenen Nahrungsmittel werden von Mensch und Tier verdaut.
Dabei wird Energie (Körperwärme, Bewegung usw.) gewonnen und CO2 als "Abfallprodukt" über den Atem, der 4000 ppm - parts per million CO2-Anteil enthält, wieder an die Umgebungsluft abgegeben.
Der Kreislauf ist geschlossen, und das CO2 steht den Pflanzen für ein erneutes Wachstum zur Verfügung.
Gäbe es kein CO2, gäbe es kein Leben!
Dass das CO2 ein Luftverschmutzer oder gar ein Gift sei, ist hiermit klar widerlegt. Die Forderung zur "Dekarbonisierung", also die Entfernung des Kohlenstoffs aus der Welt, bewertet sich damit von selbst zu einer absurden, ja volksverdummenden Forderung.
Etwa 380 ppm CO2 sind zur Zeit in der uns umgebenden Luft vorhanden, das entspricht 0,038 Volumen-%.
Für die Pflanzen ist diese Konzentration viel zu niedrig, um optimal wachsen zu können.
Schon lange laufen weltweit Versuche, die Umgebungsluft der Pflanzen auf mindestens 1000 ppm CO2 anzureichern, denn dann haben sie etwa 20 % höhere Erträge.
-
Zweifel am Weltklimarat - keine Denkverbote
Weltweit ist inzwischen eine wissenschaftliche Gegenbewegung zum IPCC entstanden, der NIPCC und andere Organisationen.
Sie wehren sich gegen unwissenschaftliche Argumente, wirtschaftliche Auflagen und staatliche Kontrollen über Lebensstil, Einkommen und alltägliche Entscheidungen, weil dafür das CO2 eben keine Begründungen hergibt.
Die Wissenschaftler erheben massive Kritik gegen die UN wie:
"CO2: Der größte wissenschaftliche Skandal in unserer Zeit", "unwissenschaftlich und fehlerhaft" oder: "Politik gut - Treibhausphysik missverstanden".Nachstehend drei Gründe, warum das CO2 keinen Einfluss auf die globale Erderwärmung haben kann:
-
Zusätzliches anthropogenes CO2 wirkt kaum erwärmend.
Vom IPCC wurde in seinem Bericht von 2001 die Klimasensitivität des CO2, also die globale Temperaturerhöhung bei fiktiver Verdoppelung seiner Konzentration, mit 0,8 Grad Celsius angegeben.
Die ebenfalls vom IPCC angegebene logarithmische Formel sagt aus, dass dieser Wert bei jeder weiteren Verdoppelung gleich bleibt, d.h. bei Vervierfachung der CO2-Konzentration sind es wieder nur 0,8 Grad usw.
Anschaulich ausgedrückt, wirkt die Infrarot-Absorption des CO2 wie ein scharzes Tuch. Hängt man ein weiteres schwarzes Tuch davor, kann die Absorption nur noch extrem geringfügig gesteigert werden - durch Effekte an den Tuchrändern.
Angesichts dieser, vom IPCC selber bestätigten Zusammenhänge, geht von anthropogenen CO2-Emissionen keine Gefahr aus.
Daher mussten neue Mechanismen (er)gefunden werden - die Wasserdampfrückkoppelung, für deren maßgebenden Einfluss es aber infolge der ebenfalls vorhandenen Gegenkoppelungen keine Nachweise durch Messungen gibt.
Schlussendlich noch ein Blick auf die Größenordnungen: Die CO2-Konzentration in der Luft ist in den letzten 100 Jahren von ca. 0,030%v auf 0,038%v angestiegen, d.s. 8 Moleküle mehr in 100000 Luftmolekülen.
Diese 8 Moleküle mehr sind angeblich für die heute verkündete Klimakatastrophe verantwortlich!
-
Temperaturerhöhung sorgt für CO2-Erhöhung, nicht umgekehrt.
Löst man den offensichtlichen Gleichlauf von Temperatur und CO2-Konzentration in der klimahistorischen Vergangenheit feiner auf, findet man, dass die CO2-Konzentration der Temperatur um grob 1000 Jahre hinterherläuft.
Die Behauptung, auch in der Klimavergangenheit sei CO2 der Auslöser von Temperatursteigerungen gewesen, entspricht einem "Schwanz, der mit dem Hund wedelt".
Inzwischen ist diese Auffassung wissenschaftlich nicht mehr haltbar.
Aber auch die IPCC-Angaben zur Konzentration des CO2 in historischen Zeiten - gewonnen aus Eisbohrkernen - sind fragwürdig.
Der Biologe Beck, überprüfte die Daten des Weltlkimarates und entdeckte erhebliche Ungereimtheiten: Beck fand heraus: Auch im 19ten und 20ten Jahrhundert waren die CO2-Werte zeitweise bereits über den heutigen Werten, ja sogar über 430 ppm.
Die IPCC-Autoren haben hohe CO2-Werte bei ihren Darstellungen einfach weggelassen!
Die Autoren, so Beck, "... haben schlampige und selektive Forschung betrieben, um ihre Theorie vom menschen-gemachten Klima zu begründen".
Ein schwerer Vorwurf, gegen diese Klimaforscher, der nicht nur von Beck erhoben wird.
-
Die Energie der Sonnenaktivitäten
Der Physiker Borchert:
Die bodennahe Temperaturerhöhung seit 1989 - also der sogenannte Klimawandel der Neuzeit- ist ein "natürlicher klimatischer Effekt", der durch "eine besondere Sonnenaktivität und nicht durch den Menschen verursacht wurde".Auch für die Sonnenflecken gilt:
Sie beeinflussen maßgeblich die Erdtemperatur, aber sie sind wiederum nicht allein verantwortlich, sondern sind eingebettet in einem umfangreichen Netz klimabildender Faktoren wie z. B. die globalen Meeresströmungen und Wolkenbildungen.
-
-
CO2-Besteuerung: Politischer Zweck - Macht-Missbrauch
Fasst man die Erkenntnisse zusammen, dann kann festgehalten werden,
dass das zusätzliches anthropogenes CO2 praktisch keinen Einfluss auf die Erdtemperatur hat.Dennoch steht es merkwürdigerweise aus dem Blickwinkel der vermeintlichen "Klimaschützer" im Mittelpunkt der Diskussionen.
Warum werden die skizierten Katastrophen in Medien so dramatisch angepriesen und kaum hinterfragt?
Es geht um Einfluss, Macht und um Geld, viel Geld, auch um hohe staatliche Subventionen.
Welchen Wert hat denn schon eine Nachricht, die keine Dramatik vermittelt? Sie wird nicht gelesen! Und welchen Wert hat eine derartige Nachricht für die Politiker?
Sie brauchen nichts zu unternehmen, denn es besteht keine Gefahr. Für die vermeintlichen Wissenschaftler und neuerdings auch für einige Wirtschaftsbereiche heißt das allerdings: Keine Gefahr, kein Handlungsbedarf für Politiker, also kein Geld für die Institute und Wirtschaftszweige.
Und das darf nicht sein.
Deshalb sprechen diese Kreise das Wohl der Allgemeinheit an und bedienen sich selber.
-
Die Klimawarner haben die Richtigkeit ihrer Modellrechnungen bisher nicht bewiesen.
Das hätten sie für eine glaubhafte Beweisführung mit dem vorhandenen Datenmaterial für die Vergangenheit schon längst tun können.
Diesen Beweis scheuen sie allerdings.
Wenn sie das Klima schon heute angeblich für das Jahr 2100 mit einem 6 °C höheren Wert vorhersagen können, dann müsste es für sie doch ein leichtes Spiel sein, z. B. komplett den Temperaturverlauf für das Jahr 2010 vorher zu sagen.
Dann wäre ihre Glaubwürdigkeit bestens untermauert.
Warum liefern diese Experten nicht diesen Beweis?
Allerdings wissen gerade Bauern von aktuellen Wetterberichten, das zu häufig die 1-Tag-Vorhersage schon nicht stimmt, geschweige eine mehrtägige.
Richtiger Verlass ist auf sie nicht.
-
Der Physiker Borchert fasst zusammen:
"Die Besteuerung von CO2 aus Gründen des sogenannten Klimaschutzes hat keine wissenschaftliche Grundlage".Altbundeskanzler Schmidt komentierte den G8-Klimabeschluss von Heiligendamm als "...
reine Hysterie und dummes Zeug".Auch der ehemalige EU-Ratspräsident Klaus kritisiert:
"Dieser Erderwärmungs-Alarmismus schreit geradezu nach einer nie gesehenen Expansion von Regierungseingriffen, von Intervention und Kontrolle unseres Lebens".Der nordirische Umweltminister Wilson hat die Diskussionen zum Klimawandel als
"Propaganda" zurückgewiesen.Andere Autoren vergleichen diese derzeit geplanten Auflagen der UN aber auch der deutschen Regierung mit dem
mittelalterlichen Ablasshandel der Kirche.Heute bezeichnen wir derartige Vorgänge als Abzockerei und die darf es nicht mehr geben. Das ist Machtmissbrauch.
-
Schließlich:
Wenn der Klima-Chefberater der Bundeskanzlerin die "Dekarbonisierung der Welt" dringend fordert, dann wäre es doch angebracht, den Erfolg einer derartigen Maßnahme vorher den Bundesbürgern zu beweisen.Wie wäre es, wenn sich dieser Klimawarner in ein von außen abschottetes Klimahaus einschließt und genau das tut, was er uns empfiehlt, nämlich das CO2 aus der Luft dieses Klimahauses abpumpt.
Technisch ist das möglich. Die Folgen sind in diesem Experiment allerdings genau vorhersagbar: Kein CO2 in der Luft, folglich kein Wachstum der Pflanzen, daraus folgend kein Sauerstoff mehr in der Luft.
Das Ende des Lebens der Pflanzen und des Klimawarners im Klimahaus wäre kurzfristig besiegelt.
↑ f Horst Malberg: Langfristiger Klimawandel auf der globalen, lokalen und regionalen Klimaskala und seine primäre Ursache
-
EIKE Europäisches Institut für Klima und Energie
2009-10-02 de Zukunft braucht Herkunft: Langfristiger Klimawandel auf der globalen, lokalen und regionalen Klimaskala und seine primäre Ursache!Einen viel beachteten Vortrag hielt kürzlich in Bad Bederkesader bekannte Klimatologe und Meteorologe sowie langjähriger Direktor des Meteorologischen Instiuts der Freien Universität Berlin, Prof. Horst Malberg.
Seine Quintessenz:
Die Sonne macht unser Klima, und ..."Es ist ein Rätsel, wie die Politik auf der Grundlage einer der Klimavergangenheit widersprechenden und wissenschaftlich nicht konsensfähigen Arbeitshypothese über den anthropogenen CO2-Einfluss "Klimabeschlüsse" mit weitreichenden Konsequenzen begründen kann.Alle Szenarienrechnungen, ob bei Banken, in der Wirtschaft oder in der Klimaforschung, sind im Konjunktiv und daher unter Vorbehalt zu verstehen. Sie basieren auf vielfältigen Annahmen und führen in eine Vertrauenskrise, wenn sie als fundierte Prognosen missinterpretiert werden.
Wenn die klimatische Zukunft der klimatischen Herkunft so offensichtlich widerspricht, ist über kurz oder lang mit einem Platzen der anthropogenen 'Klimablase' und mit mehr realistischen Klimamodellen zu rechnen."
-
Horst Malberg, Univ.-Prof. (a.D.) für Meteorologie und Klimatologie
2009-09-15 de
Langfristiger Klimawandel auf der globalen, lokalen und regionalen
Klimaskala und seine primäre Ursache: Zukunft braucht Herkunft
↑ g en Not Evil Just Wrong
-
Greener Horizon Films ltd en
Not Evil Just Wrong
-
Not Evil Just Wrong is the film Al Gore and Hollywood don't want you to see.
It reveals the true human cost of Global Warming hysteria.
-
Not Evil Just Wrong shows how Global Warming alarmism and the tax increases that go along with it are going to increase costs for working families during one of the worst recessions in living memory.
-
Al Gore and his allies want to ban fossil fuels in the developed world.
This would devastate the American economy and drive jobs to India and China.
-
Be part of the resistance.
With your help we can bypass the barriers to distribution that Hollywood and the mainstream media put up to stop you from hearing the truth. -
Be part of the premiere night by hosting a screening in your home, community center or church.
Be part of the cinematic tea party movement and tell Al Gore and the elites that you are fed up with taxes and restrictions that threaten jobs across the country.
-
The Frontier Centre for Public Policy
en
National Post: Not Evil Just Wrong, "presents a devastating account of
the shaky foundations and hefty price of Mr. Gore's brand of
self-interested and hypocritical alarmism"
-
Global warming alarmists want Americans to believe that humans are killing the planet. But Not Evil Just Wrong, a new documentary by Phelim McAleer and Ann McElhinney, proves that the only threats to America (and the rest of the world) are the flawed science and sky-is-falling rhetoric of Al Gore and his allies in environmental extremism.
-
The film warns Americans that their jobs, middle-class lifestyles and dreams for their children will be destroyed if the government rushes to judgment and imposes job killing regulations on an economy already mired in recession.
-
Not Evil Just Wrong exposes the deceptions about global warming that scientists, politicians, educators and the media have been force-feeding the public for years, including fear-mongering about floods and dying polar bears.
-
The documentary shows how environmentalists are pushing the same kind of anti-human propaganda that triggered a ban DDT and condemned millions of children to death by malaria, a story recounted in the documentary. Not Evil Just Wrong asks:
-
Is carbon dioxide the new DDT and are we taking the same risks with our future?
↑ h Augenmaß beim Klimaschutz
![]()
![]()
![]()
Wussten Sie, ...
dass sich der Eisbärenbestand seit 1970 - während es
wärmer geworden ist - verdoppelt hat?

-
EIKE Europäisches Institut für Klima und Energie
2009-08-20 de Augenmaß beim KlimaschutzZusätzlich zu den Ausgaben der herrschenden Finanzkrise und Rezession soll Deutschland hunderte von Milliarden € für klimaorientierte Maßnahmen ausgeben. Die Folgen der Finanzkrise und Rezession sind in einigen Jahren überwunden, aber die Kosten des Klimapaketes werden unsere Wirtschaft, Verbraucher und Wähler über Jahrzehnte belasten.
-
EIKE Europäisches Institut für Klima und Energie
2009-08-20 de
Augenmaß beim Klimaschutz - Denkanstöße zum Brüsseler Klimapaket
Unser Klima:
Das Erdklima schuf Eiszeiten und Warmzeiten.
Es war Steuermann der Weltgeschichte im Altertum und bestimmt auch heute das Weltgeschehen.
Seit jeher schwankt es um ein paar Grad herauf und wieder hinunter. Heute hat es uns auf etwa 15 ° Celsius aus der kleinen Eiszeit des späten Mittelalters, herausgeführt, wo es nur 13 bis 14 Grad warm war. Viel mehr wussten wir lange Zeit nicht.
↑ i IPCC-Experte Richard Courtney lehnt "Klimaschutz" ab
-
Klimaskeptiker Info
2009-08-17 de IPCC-Experte Richard Courtney lehnt "Klimaschutz" ab
Der britische Klimaexperte und IPCC-Mitarbeiter Richard S. Courtney lehnt die momentane "Klimaschutz"-Politik ab, die sich auf die Begrenzung und Reduktion von "Treibhausgas"-Emissionen (vordringlich CO2) konzentriert.
Das Kyoto-Protokoll sei gescheitert, und auch jedwedes in Kopenhagen verabschiedetes Protokoll zur Emissionsbegrenzung werde scheitern, weil besonders die Schwellenländer wie Indien oder China keine wirksamen Schritte zur Emissionsvermeidung machten und auch die Ziele der Industrienationen mit den ungeeigneten Mitteln des Emissionshandels nicht zu erreichen sind.
Hier werde viel Geld für sinnlose Maßnahmen verschwendet.
"Es gibt keinen klaren Beweis dafür, daß es einen zusätzlichen (vom Menschen verursachten) Klimawandel gibt.
Aber Umweltgruppen drängen die Politiker dazu, etwas zu tun, 'bevor es zu spät ist'.
Es gibt keinen Bedarf für einen erzwungenen, unangemessenen und voreiligen Beschluß der Konferenz in Kopenhagen über Emissionen."
Statt sich auf die Emssionen zu konzentrieren, schlägt Courtney andere Maßnahmen zur Beeinflussung der Strahlungsbilanz der Erde vor.
So könne schon eine Steigerung der Wolkenbedeckung um 1 Prozent mehr als die einer CO2-Verdopplung zugeschriebene Erwärmung ausgleichen, und es gebe viele Wege, auf die Wolkenbildung Einfluß zu nehmen.
Jede Option sei billiger als eine Emissionsreduktion um 20 % für ein einziges Jahr. Jede Verzögerung von Emssionsbeschränkungen durch irgendeine andere Maßnahme könne also sehr viel Geld einsparen.
Ein IPCC-Experte wendet sich gegen die Konzentration der Klimaschützer auf die Emssionsreduktion und empfiehlt andere Ansätze.
Dies ist an sich schon bemerkenswert - auch auf dem Gebiet des Klimaschutzes gibt es also keinen "Konsens".
Wer also an die Temperaturwirksamkeit der Treibhausgase glaubt, sollte trotzdem über vernünftige Wege der Anspassung nachdenken, die keine Billionen kosten und Millionen Menschen in Armut und Hunger treiben wie der gegenwärtige "Klimaschutz".
Wenn man nicht an die Temperaturwirksamkeit von CO2 etc. glaubt, erledigt sich das Gezerre um Emssionen ohnehin.
Und dafür gibt es die bekannten guten Gründe: Trotz weiter steigenden CO2 ist es seit 1998 zu keiner Erwärmung, seit 2003 sogar zu einer Abkülung gekommen.
Der von den Klimamodellen vorhergesagte "Hot Spot" in der Troposphäre über den tropischen Breiten existiert nicht.
Und die Temperaturreihen von GISS und Hadley/CRU, die eine anhaltende Erwärmung behaupten, sind manipuliert oder beruhen auf obskuren Daten und Methoden.
Fazit: Die Welt braucht keinen "Klimaschutz" - und keine Klimakonferenz in Kopenhagen!
-
Watts Up With That? (Antony Watts)
2009-08-17 en Stopping Climate Change
↑ j Zur künstlich herbeigeführte Klimapsychose: Cui Bono?
-
EIKE Europäisches Institut für Klima und Energie
2009-07-31 de Zur künstlich herbeigeführte Klimapsychose: Cui Bono?In einem Interview mit der Weltwoche äußert sich der Autor des Buches "Die Lüge der Klimakatastrophe - Der Auftrag des Weltklimarates", Hartmut Bachmann zu den Drahtziehern der neuen Klimaideologie.
Der 1924 geborene Deutsche war Mitte der 80er-Jahre als CEO einer US-Firma tätig, die sich exklusiv mit Klimafragen beschäftigte.
Er war als Kommissar des US Energy Saving Programms präsent bei zahlreichen Meetings und Verhandlungen in den USA, die die Geburt des IPCC, des späteren Weltklimarates, zur Folge hatten.
Bachmann war bei Diskussion und Entwicklung der Idee um die Nutzung des Wortes «Klimakatastrophe» von Anfang an dabei.
↑ k CO2 - und Klimahysterie
-
Nachdem ich nun seit Jahren die Diskussion um das CO2 und dessen "ungeheure" Wirkung auf die Entwicklung des Klimas verfolge, wobei besonders der antrophogene Anteil durch die Verbrennungsprozesse fossiler Energien wohl bald den Weltuntergang, ja die Ausrottung des Lebens auf dieser Erde bewirken soll, habe ich einige, man möge mir verzeihen, einfache Fragen.
Wenn laut Bundesumweltamt (BUA) der Anteil der tech. CO2-Emissionen nicht einmal zwei Prozent der gesamten CO2-Emissionen ausmachen sollen, so wäre dies ein Anteil an dem Anteil in der Atmosphäre von 0,038 bzw. von 0,00076 Prozent.
Wie soll der Mensch denn hier einen Einfluss ausüben können?
Wo, respektive in welcher oder welchen Höhen über der Erdoberfläche wird denn diese Konzentration eigentlich gemessen? 100, 1000 oder gar 10000 Meter über der Erdoberfläche?
Im Chemieunterricht in der Schule habe ich gelernt, dass CO2 von den Gasen in der Atmosphäre das höchste Molekulargewicht hat und somit schwerer ist als die anderen Gase.
Dieses CO2 kann sich doch nur bodennah ablagern und durch die Verwirbelungen der bewegten Luft einen bodennahen Effekt ausüben und zwar den, dass die umliegende und herumwachsende Vegetation sich glücklicherweise mit diesem CO2 versorgen kann, die Assimilation funktioniert und Gott sei's gelobt, Mensch und Tier können mit Nahrung versorgt werden.
Wie kann man eigentlich auf die Idee kommen, den Menschen so viel Unsinn einreden zu wollen.
Das Allerschlimmste ist eigentlich, dass die Menschen ein derartiger Verlust an eigenem Denken und Hinterfragen befallen hat, dass man ihnen das einreden kann.
Kommt da nicht der Verdacht auf, dass solche Gesetze und Verordnungen, die sich mit CO2-Zertifikaten, CO2-Steuer und ähnlichem beschäftigen, den Menschen zur Melkkuh degradieren, der Klimahysterie Vorschub leisten, nichts bewirken und zur Zerstörung unserer zivilen Strukturen, ja unserer Zivilisation beitragen?
Nun frage ich mich natürlich, wer sind eigentlich diejenigen, die solche Gesetze machen?
Hat bei diesen Leuten PISA schon vor 40 Jahren zugeschlagen?
Naturwissenschaften abgewählt und nun sitzen selbige in den Parlamenten und "verdummen" das Volk und merken es nicht mal; weil das Volk es auch nicht merkt? Oder gibt es etwa andere Gründe?
Alles, was mit der CO2-Hysterie als Begründung an Maßnahmen beschlossen wurde oder noch geplant ist, ist umgehend einzustellen und abzuschaffen.
CO2 ist kein Gift; es ist lebensnotwendig.
Dies bedeutet nicht, dass wir nicht sorgfältig mit den zur Verfügung stehenden Ressourcen umgehen müssen. Bei allen Energiegewinnungssystemen und Energiesparsystemen ist jedoch zu prüfen, im Rahmen einer energetischen Bilanzierung, ob der Energieertrag höher ist als der Energieaufwand für den Lebenszyklus solcher Systeme.
Lassen wir diesen Unsinn, den man mit uns macht, nicht mehr zu.
Helfen wir denen, die augenscheinlich der Hilfe eines Nachhilfeunterrichtes bedürfen, damit Wohlstand gemehrt wird und nicht der Schaden.
Geben wir der Vernunft endlich eine Chance.
-
Readers Edition / Dieter Ber
2009-06-02 de CO2 - und Klimahysterie
↑ l Wird jemand die globale Abkühlung bemerken?
-
EIKE Europäisches Institut für Klima und Energie
2009-05-26 de Wird jemand die globale Abkühlung bemerken?
↑ m Wird alles immer schlimmer? - Kommt die Klimakatastrophe?
-
Klimaskeptiker Info
de Wird alles immer schlimmer? - Kommt die Klimakatastrophe?
de Bedeutet Erwärmung eine Katastrophe?
de Breiten sich die Wüsten aus?
de Dipl.-Biol. Ernst-Georg Beck: Globale Abkühlung
↑ n "Klimaschutz" ist schädlich
-
Klimaskeptiker Info
de "Klimaschutz" ist schädlich
de Energie und Energiepolitik
↑ o en Name just three clear signs the planet is warming
-
Watts Up With That? (Antony Watts)
2009-05-01 en Name 3 clear signs of the coming Thermageddon
-
Herald Sun (Australia)
2009-04-29 en Global warming alarmists out in cold
↑ p Was bedeutet der globale CO2-Anstieg für das Klima? - Nichts!
-
EIKE Europäisches Institut für Klima und Energie
2009-05-01 de Was bedeutet der globale CO2-Anstieg für das Klima? - Nichts! Auch nicht für Deutschland!
↑
q Freispruch für CO2?
en Disproving The Anthropogenic Global Warming (AGW) Problem
-
EIKE Europäisches Institut für Klima und Energie
2009-05-23 de Freispruch für CO2?
| Klaus-Eckart Puls |
Dipl.-Meteorologe, FU Berlin
▶Klaus-Eckart Puls: Who is who (Skeptiker) ▶Klaus-Eckart Puls: Video (Präsentationen) |
-
Whatts Up With That? (Anthony Watts)
2009-05-24 en Disproving The Anthropogenic Global Warming (AGW) Problem
April 2009 in Deutschland
-
EIKE Europäisches Institut für Klima und Energie
2009-04-29 de Klimawandel trifft nur Deutschland! DWD meldet: Beschleunigter Klimawandel am warmen April ablesbar. Australien meldet: Kältester April seit langem.
April 2009 in Australia ("unseasonably cold weather")
-
Australian Government
2009-04-30 en A cold end to April in Tasmania
Tasmania, and much of southeastern Australia, has had several days of unseasonably cold weather, with cold days and very cold mornings since Sunday. Conditions like this are rare in April, being more a feature of winter.
-
weatherzone.com.au
2009-04-24 en Cold nights for Western Australia
Most places in WA's Goldfields saw their coldest night of the year with minimums falling to eight degrees below average. Both Laverton and Leinster dropped to 7 degrees, their coldest April night in three years.
⇧
21 Hoffnung auf Vernunft
en Hope to allow reason to prevail
fr L'espoir de recouvrer la raison
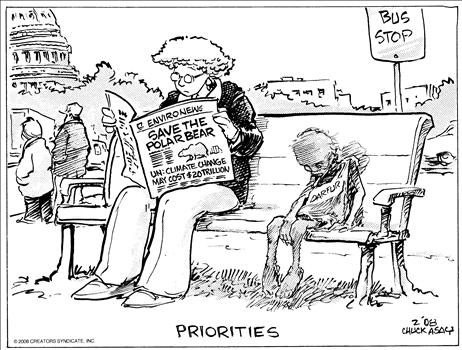
↑
a Das Problem
en The problem
fr Le problème
Arthur Herman | Australischer Historiker und Schriftsteller |
|---|
Mit folgendem Link wird von anderen Webseiten auf diese Seite verwiesen.
| Arthur Herman |
Australischer Historiker und Schriftsteller
▶Arthur Herman: Who is who (Skeptiker) |
de Klima-Hysteriker gegen Klima-Realisten
-
Es war ein hartes Jahr für die Priester der globalen Erwärmung in den USA.
Zunächst musste die NASA ihre Behauptung revidieren, dass 1998 das bisher wärmste Jahr in den USA gewesen sei - als Beweis für die globale Erwärmung.
Tatsächlich war es das Jahr 1934.
-
Dann stellte sich heraus, dass die Ozeane sich seit 2003 abkühlten, nicht etwa erwärmten.
Inzwischen erwies sich auch der Winter 2007/08 als der Kälteste seit Jahrzehnten, nachdem Al Gore gewarnt hatte, dass wir den Winter, so wie wir ihn kennen, vergessen können.
-
In der Mai-Ausgabe der Zeitschrift NATURE veranlassten die Anzeichen fallender Globaltemperaturen deutsche Klimatologen (vom Kieler Leibniz-Institut und dem Hamburger Max-Planck-Institut) zu folgern, dass die Wandlung unseres Planeten in eine permanente Sauna zumindest für das nächste Jahrzehnt ausgesetzt sei.
Trotzdem verlangen diejenigen, die an eine "menschengemachte Erwärmung" glauben, mehr und mehr Geld, um den Klimawandel zu bekämpfen und drastische Einschränkungen bei unserer Wirtschaft und Lebensweise einzuführen. Der Grund dafür ist, dass sie Gläubige sind, keine Wissenschaftler.
Keine Ergebnisse und Fakten können ändern, was inzwischen religiöse Formen angenommen hat.
-
... Die Autorität der Priesterschaft ist umso größer, je stärker die Mischung aus Aberglauben, Ignoranz und Furcht ist.
Wie bei der Kirche im Mittelalter oder der Inquisition während der Reformation werden alle Zweifler so wie David Evans (australischer Klimaforscher) oder Christopher Monckton aus England als "gefährliche Ungläubige" gebrandmarkt, oder als "Aussenstehende", oder in Al Gores Terminologie als willige Werkzeuge des größten Feindes der Erde, den Ölfirmen.
-
Arthur Herman
EIKE Europäisches Institut für Klima und Energie, Jena
2008-08-06 de Klima-Hysteriker gegen Klima-Realisten in einer Zeit der Unvernunft
en Climate hysterics v heretics in an age of unreason
-
IT has been a tough year for the high priests of global warming in the US.
First, NASA had to correct its earlier claim that the hottest year on record in the contiguous US had been 1998, which seemed to prove that global warming was on the march.
It was actually 1934.
-
Then it turned out the world's oceans have been growing steadily cooler, not hotter, since 2003.
Meanwhile, the winter of 2007 was the coldest in the US in decades, after Al Gore warned us that we were about to see the end of winter as we know it.
-
In a May issue of Nature, evidence about falling global temperatures forced German climatologists to conclude that the transformation of our planet into a permanent sauna is taking a decade-long hiatus, at least.
Then this month came former greenhouse gas alarmist David Evans's article in The Australian, stating that since 1999 evidence has been accumulating that man-made carbon emissions can't be the cause of global warming.
By now that evidence, Evans said, has become pretty conclusive.
-
Yet believers in man-made global warming demand more and more money to combat climate change and still more drastic changes in our economic output and lifestyle.
The reason is that precisely that they are believers, not scientists.
No amount of empirical evidence will overturn what has become not a scientific theory but a form of religion.
-
The Australian
2008-08-04 en Climate hysterics v heretics in an age of unreason
| David Evans |
Dr., Klimawissenschaftler, war von 1999 bis 2005 verantwortlich
für die Erfassung der Australischen CO₂-Emissionen.
▶David Evans: Who is who (Skeptiker) ▶David Evans: Video (Präsentationen) |
-
CFP Canada Free Press / Tom Harris
2009-01-22 en Are climate change investors living in a fool's paradise?
↑ b Paradigmawechsel
-
EIKE Europäisches Institut für Klima und Energie
2014-04-18 de Die kommende Verschiebung des Klima-Paradigmas
↑
c Meldungen aus verschiedenen Ländern
en Country Information
fr Nouvelles informations de différents pays
-
de
Mail Online: Gemessene Temperaturen sprechen gegen
"globale Erwärmung": Alarmisten fürchten Niedergang des Alarmismus
en Mail Online: Whatever happened to global warming? How freezing temperatures are starting to shatter climate change theory
↑ fr Le Monde: Et si le réchauffement faisait une pause?
-
Le Monde
2008-10-20 fr Et si le réchauffement faisait une pause?C'est une information surprenante, qui circule intensément sur Internet depuis plusieurs mois.
Et qui, à l'approche du sommet de Copenhague (Danemark), est de plus en plus fréquemment reprise dans les médias, colportée par certains scientifiques, responsables politiques ou commentateurs.
De quoi s'agit-il ?
De la fin du réchauffement.
Celui-ci se serait... arrêté en 1998 !
... il est vrai que la tendance moyenne a été
d'une croissance de 0,02 ºC par décennie.
Quasiment nulle.
Pour autant, certains climatologues, y compris des membres du GIEC, n'excluent pas que les températures moyennes globales de la prochaine décennie soient légèrement inférieures à celles de la décennie écoulée.
Un intense débat est en cours.
↑ BBC: Was ist mit der globalen Erwärmung passiert?
-
klimaskeptiker.info
2008-10-09 de BBC: Was ist mit der globalen Erwärmung passiert? -
Paul Hudson, Klimakorrespondent der BBC, fragt sich in seinem Artikel (siehe Quelle), was mit der vermeintlichen globalen Erwärmung passiert sei.
-
Das global wärmste Jahr in den Aufzeichnungen war nicht etwa 2008 oder 2007, sondern 1998. Seit 10 Jahren also ist keine weitere Erwärmung zu verzeichnen.
Gleichzeitig ist der CO2-Anteil in der Atmosphäre weiter gestiegen.
Die Computermodelle der Klimaforscher haben die nicht weiter steigenden Temperaturen nicht vorhergesagt.
Vor diesem Hintergrund erhalten die Klimawandel-Skeptiker (eigentlich besser: Klimarealisten) Oberwasser, die seit langem betonen, daß der menschliche Beitrag zur Entwicklung des globalen Klimas von den Alarmisten weit übertrieben wird.
Mojib Latif hat letzten Monat noch vertreten, daß es sehr wohl zu einer Abkühlungsphase von 10 bis 20 Jahren kommen könne.
-
Wie die Alarmisten einerseits angesichts der fehlenden Erwärmung immer noch von einer solchen ausgehen können und andererseits selbst nach einer Abkühlung noch fest eine irgendwann wiederkehrende anthropogene Erwärmung glauben, bleibt ihr Geheimnis.
Wenn die angebliche anthropogene Erwärmung jetzt - wie die gemessenen Temperaturen belegen und auch Mojib Latif einräumt - von natürlichen Schwankungsprozessen (Sonne, Ozeanströmungen) ausgelöscht werden kann, wieso sollte dann diese anthropogene Erwärmung irgendwann einmal zum dominierenden Klimafaktor werden?
↑ en BBC: What happened to global warming?
-
BBC News / Paul Hudson
2009-10-09 en BBC: What happened to global warming? -
This headline may come as a bit of a surprise,
so too might that fact that the warmest year recorded globally was not in 2008 or 2007, but in 1998.
But it is true. For the last 11 years we have not observed any increase in global temperatures.
And our climate models did not forecast it, even though man-made carbon dioxide, the gas thought to be responsible for warming our planet, has continued to rise.
-
So what on Earth is going on?
Climate change sceptics, who passionately and consistently argue that man's influence on our climate is overstated, say they saw it coming.
They argue that there are natural cycles, over which we have no control, that dictate how warm the planet is.
-
But what is the evidence for this?
During the last few decades of the 20th Century, our planet did warm quickly.
Recent research has ruled out solar influences on temperature increases
Sceptics argue that the warming we observed was down to the energy from the Sun increasing.
After all 98% of the Earth's warmth comes from the Sun.
But research conducted two years ago, and published by the Royal Society, seemed to rule out solar influences.
The scientists' main approach was simple: to look at solar output and cosmic ray intensity over the last 30-40 years, and compare those trends with the graph for global average surface temperature.
And the results were clear. "Warming in the last 20 to 40 years can't have been caused by solar activity," said Dr Piers Forster from Leeds University, a leading contributor to this year's Intergovernmental Panel on Climate Change (IPCC).
But one solar scientist Piers Corbyn from Weatheraction, a company specialising in long range weather forecasting, disagrees.
-
He claims that solar charged particles impact us far more than is currently accepted, so much so he says that they are almost entirely responsible for what happens to global temperatures.
He is so excited by what he has discovered that he plans to tell the international scientific community at a conference in London at the end of the month.
If proved correct, this could revolutionise the whole subject.
-
Ocean cycles
What is really interesting at the moment is what is happening to our oceans.
They are the Earth's great heat stores.
In the last few years [the Pacific Ocean] has been losing its warmth and has recently started to cool down
According to research conducted by Professor Don Easterbrook from Western Washington University last November, the oceans and global temperatures are correlated.
The oceans, he says, have a cycle in which they warm and cool cyclically.
The most important one is the Pacific decadal oscillation (PDO).
For much of the 1980s and 1990s, it was in a positive cycle, that means warmer than average.
And observations have revealed that global temperatures were warm too.
But in the last few years it has been losing its warmth and has recently started to cool down.
These cycles in the past have lasted for nearly 30 years.
So could global temperatures follow? The global cooling from 1945 to 1977 coincided with one of these cold Pacific cycles.
Professor Easterbrook says: "The PDO cool mode has replaced the warm mode in the Pacific Ocean, virtually assuring us of about 30 years of global cooling."
So what does it all mean?
Climate change sceptics argue that this is evidence that they have been right all along.
They say there are so many other natural causes for warming and cooling, that even if man is warming the planet, it is a small part compared with nature.
But those scientists who are equally passionate about man's influence on global warming argue that their science is solid.
The UK Met Office's Hadley Centre, responsible for future climate predictions, says it incorporates solar variation and ocean cycles into its climate models, and that they are nothing new.
In fact, the centre says they are just two of the whole host of known factors that influence global temperatures - all of which are accounted for by its models.
In addition, say Met Office scientists, temperatures have never increased in a straight line, and there will always be periods of slower warming, or even temporary cooling.
What is crucial, they say, is the long-term trend in global temperatures. And that, according to the Met office data, is clearly up.
To confuse the issue even further,
last month Mojib Latif, a member of the IPCC (Intergovernmental Panel on Climate Change) says that we may indeed be in a period of cooling worldwide temperatures that could last another 10-20 years.
The UK Met Office says that warming is set to resume
Professor Latif is based at the Leibniz Institute of Marine Sciences at Kiel University in Germany and is one of the world's top climate modellers.
But he makes it clear that he has not become a sceptic; he believes that this cooling will be temporary, before the overwhelming force of man-made global warming reasserts itself.
So what can we expect in the next few years?
Both sides have very different forecasts.
The Met Office says that warming is set to resume quickly and strongly.
It predicts that from 2010 to 2015 at least half the years will be hotter than the current hottest year on record (1998).
Sceptics disagree. They insist it is unlikely that temperatures will reach the dizzy heights of 1998 until 2030 at the earliest.
It is possible, they say, that because of ocean and solar cycles a period of global cooling is more likely.
One thing is for sure.
It seems the debate about what is causing global warming is far from over.
Indeed some would say it is hotting up.
-
Canada Free Press
2009-10-12 en Sceptics welcome BBC report on 'global cooling'Under the headline 'Whatever happened to Global Warming?', the BBC has reported that the warmest year recorded globally was 1998, and for the last 11 years no increase in global temperatures has been observed.
The report by the BBC climate correspondent, Paul Hudson, which provoked a strong debate on the Corporation's website, quotes a climatologist as saying there could be 30 years of cooling due to the falling temperatures of the oceans.
Last night, one solar scientist, Piers Corbyn from Weatheraction, a company specialising in long range weather forecasting, said: "It is interesting the BBC is prepared to tolerate him (Hudson) writing these things."
-
The Telegraph UK
2009-10-09 en Sceptics welcome BBC report on 'global cooling'Climate change sceptics have welcomed a "surprise" BBC decision to give prominence to evidence from leading scientists that there could be 30 years of "global cooling".
↑ de Mail Online: Gemessene Temperaturen sprechen gegen "globale Erwärmung": Alarmisten fürchten Niedergang des Alarmismus
-
Klimaskeptiker.info
2008-10-13 de Mail Online: Gemessene Temperaturen sprechen gegen "globale Erwärmung": Alarmisten fürchten Niedergang des Alarmismus
↑ en Mail Online: Whatever happened to global warming? How freezing temperatures are starting to shatter climate change theory
-
Daily Mail (Online)
2009-10-13 en Mail Online: Whatever happened to global warming? How freezing temperatures are starting to shatter climate change theory
-
Watts up with that? (Antony Watts)
2009-02-13 en Daily Mail joins BBC in writng about climate skepticism
↑ en UK: Met Office und The Guardian
Nobody has been pushing the global warming story harder than the Met Office and The Guardian ... and now ...:
-
Watts up with that? (Antony Watts)
2009-02-12 en Tipping point reached: UK Met Office makes blistering attack on those who make 'Apocalyptic climate predictions
-
Guardian CO UK
2009-02-11 en Scientists must rein in misleading climate change claims
2009-02-11 en 'Apocalyptic climate predictions' mislead the public, say experts
↑ en USA Voters
-
Watts Up With That? (Antony Watts)
2009-04-18 en Only 34% of USA Voters Now Blame Humans for Global Warming
↑ Umfrage in Australien
-
EIKE Europäisches Institut für Klima und Energie
2009-02-14 de Australien: "Globale Erwärmung ist ein Mythos"