3.4.5 Ozeanzyklen & Ozeanische Oszillationen
en Ocean Cycles & Ocean oscillations
fr Cycles et oscillations océaniques
Mit folgenden Links wird von anderen Webseiten auf diese Seite verwiesen:
▶Ozeanzyklen/Ozeanische Oszillationen| de | en | fr |
|---|---|---|
|
Klimawandel: Wissenschaft Ozeanzyklen & Ozeanische Oszillationen |
Climate change: Science Ocean Cycles & Ocean Oscillations |
Changement climatique: Science Cycles et oscillations océaniques |
| Ozeanzyklen steuern das Klima / El Niño (der Knabe/warm) & La Niña (das Mädchen/kalt) / ENSO: El Niño-Southern Oscillation / AMO: Atlantic Multidecadal Oscillation / NAO: North Atlantic Oscillation / AO: Arctic Oscillation / IOD: Indischer Ozean Dipol / PDO: Pacific decada oscillation | ||
⇧ de Verzeichnis en Contents fr Sommaire
- 1
de
Ozeanzyklen steuern das Klima
en Ocean oscillation and Climate
fr Oscillations océaniques et climat
- a de
Die Pazifisch Dekadische Oszillation (PDO)
en The Pacific Decadal Oscillation (PDO)
fr L'oscillation décennale du pacific (ODP) - b de
Sechzig-Jahres-Ozeanzyklus in der Meeresspiegelentwicklung
en 60-Year Oscillation in Global Mean Sea Level
fr Le niveau des océans selon l'oscillation ODP de 60 ans - c de
Südpazifische Oszillation und Kosmische Strahlung
en South Pacific Oscillation and Cosmic Rays
fr Oscillation du Pacific Sud et rayonnement cosmique - d Forschungen / Research / Recherche
- e Rekonstruktion von Ozeanzyklen in der Vergangenheit
- f Im Takt der Sonne / Correlations with Solar Cycles / Correlationns avec cycles solaires
- g Anerkennung des Einflusses der Ozeanzyklen von Aktivisten der globalen Erwärmung
- a Das ENSO-Phänomen
- b Oceanic Niño Index (ONI)
- c El Niño Stärken
- d Korrelationen mit El Niño & La Niña
- 2018
- de Klimaschützer können auf steigende Temperatur hoffen!
- 2017
- de El Ninos während der Kleinen Eiszeit intensiver und häufiger als in Warmperioden
- de University of Washington: Modelle können Einfluss des Klimawandels auf El Ninos nicht zuverlässig vorhersagen
- de Zwei Super-Christuskinder: El Nino 2015/16 erreichte ähnliche Stärke wie 1997/98
- 2016
- fr El Niño L'enfant terrible du climat
- 2015
- de Fachwelt ist sich einig: El Nino-Prognose bleibt schwierig. Das PIK hingegen spricht von einem "Durchbruch" der Vorhersagekunst
- de Neue Studie aus Peru: El Nino lässt Kinder schrumpfen
- 2014
- de Kein Trend in der El Nino-Entwicklung der letzten 150 Jahre: Klimamodelle mit zukünftigem Dauer-El Nino können die Vergangenheit nicht reproduzieren
- 2011
- de Raimund Leistenschneider: La Niña und El Niño, was sich dahinter verbirgt und was sie, wann auslöst - Die Sonne ist an allem schuld
- 1998
- en Dr. Theodor Landscheidt: Solar Activity Controls El Niño and La Niña
- a Wissenschaftlich begutachtete Studie erschüttert erneut offizielle Klimadoktrin!
- b Dr. Horst Borchert: Südpazifische Oszillation (SO) und Kosmische Strahlung
- c The Trade Winds (Passatwinde/Alizé) Drive The ENSO
- d Welche Rolle spielen Treibhausgase ?
- 5
de
AMO: Atlantische Multidekaden-Oszillation
en Atlantic Multidecadal Oscillation
fr Oscillation atlantique multidécennale
- 2019
- de
AMO-Zyklus auf dem absteigenden Ast:
Rotes Meer wird sich in den kommenden Jahrzehnten wohl abkühlen
en Natural Climate Oscillations may Counteract Red Sea Warming Over the Coming Decades - 2018
- de US-Atmosphärenforscher warnt davor, die kalifornischen Waldbrände reflexhaft dem Klimawandel anzulasten
- 2017
- en
Correlation of Accumulated Cyclone Energy and Atlantic Multidecadal
Oscillations
Mittelfristig lässt sich die Hurrikanaktivität ganz gut vorhersagen, denn sie ist eng an den AMO-Ozeanzyklus gekoppelt, die Atlantische Multidekadenoszillation, die eine Periodizität von 60 Jahren besitzt. - de Trends der ozeanischen Zyklen und langfristige Veränderungen der Lufttemperaturen in Europa
- 2016
- de Die Sonne im Juli 2016 und die Sache mit der AMO
- 2015
- de Atlantikwellen
- 2012
- de
Munich Re rührt wieder kräftig die Werbetrommel für Sturm- und
Dürreversicherungen
Die atlantische Hurrikan-Aktivität (ACE) der vergangenen 60 Jahre verlief parallel zur Entwicklung der Atlantisch Multidekaden Oszillation (AMO).
- a
de
Neue Finnische Studie belegt Kopplung zwischen Sonne und NAO sowie
NAO und Temperatur
en New Finnish Study Confirms Coupling Between Sun and NAO, NAO and Temperature - b
de
Sonne übt starken Einfluss auf die Nordatlantische Oszillation (NAO) aus
en Trends in sunspots and North Atlantic sea level pressure - c
de
Die Nordatlantische Oszillation beeinflusste die Arktis und Nordeuropa
während der letzten 5000 Jahre in systematischer Weise
en New paper shows how natural variability controls North Atlantic climate
- a
de
Ist Abnahme des arktischen Meereises von der
Arktischen Oszillation verursacht?
en Could Arctic Sea Ice Decline be Caused by the Arctic Oscillation?
- 8
de
IOD: Indischer Ozean Dipol
en IOD
fr IOD
- 9
de
PDO: Pazifische Dekaden-Oszillation
en Pacific Decadal Oscillation
fr Oscillation décennale du Pacifique
- a de La Ola im Ozean: Die klimazyklische Stadionwelle
- b en We Can't Think of Anything Else It Could Be
- c de
Sechzig-Jahres-Ozeanzyklus jetzt auch in der Meeresspiegelentwicklung
gefunden
en Is There a 60-Year Oscillation in Global Mean Sea Level? - d
de
Neues Paper halbiert die anthropogene Erwärmungsrate der letzten 50 Jahre
en New paper cuts recent anthropogenic warming trend in half - e de Ähnlichkeit der Temperaturentwicklung in den USA während der Sommermonate mit dem Verlauf des PDO-Ozeanzyklus
- f de US-Atmosphärenforscher warnt davor, die kalifornischen Waldbrände reflexhaft dem Klimawandel anzulasten
⇧ Welt-Info
⇧ de Allgemein, Begriffe en General, Terms fr Générales, termes
| PDO | = |
de
Pazifische Dekaden-Oszillation en Pacific decadal oscillation fr Oscillation décennale du Pacifique |
| NAO | = |
de
Nordatlantische Oszillation en North Atlantic oscillation fr Oscillation nord-atlantique |
| AMO | = |
de
Atlantische Multidekaden-Oszillation en Atlantic multidecadal oscillation fr Oscillation atlantique multidécennale |
| AO | = |
de
Arktische Oszillation oder auch Northern Hemispheric Annular Mode (NAM) en Arctic oscillation fr Oscillation arctique |
| ENSO | = |
de
El Niño-Southern Oscillation en El Niño-Southern Oscillation fr El Niño (ENSO El Niño-Southern Oscillation) |
| El Niño | = |
El Niños cause global warming (span. für 'der Junge, das Kind', hier konkret: 'das Christuskind') de El Niño en El Niño-Southern Oscillation fr El Niño |
| La Niña | = |
La Niñas cause global cooling (span. 'das Mädchen') de La Niña en La Niña fr La Niña (météorologie) |
| SO | = | Südpazifische Oszillation de Southern Oscillation en Southern Oscillation fr Oscillation australe |
| SO | = | Südpazifische Oszillation |
| SOI | = | de Southern Oscillation Index |
| SST | = |
de
Oberflächentemperatur/Meeresoberfläche en Sea surface temperature fr Température de surface de la mer |
| - | = |
de
Passat (Windsystem) en Trade wind fr Alizé |
| GTTA | = | Global Tropospheric Temperature Anomalies |
| MGT | = | Mean Global Temperature |
| GHGs | = | Greenhouse Gases |
| MSU | = | microwave sensing units |
| RATPAC | = | radiosondes |
| AMSR-E | = |
Advamced Microwave Scanning Radiometer for EOS instrument on NASA's Aqua satellite (Aqua was launched in 2002) |
| RSS | = | Remote Sensing Systems |
| THG GHG GES |
= |
de
Treibhausgas en Greenhouse gas fr Gaz à effet de serre |
fr Un épisode El Niño est caractérisé par des températures océaniques anormalement élevées dans le centre et l'est du Pacifique équatorial, tandis qu'un épisode La Niña représente la situation inverse, caractérisée par des températures océaniques anormalement basses dans l'est du Pacifique équatorial.
Ces deux manifestations du même phénomène perturbent la configuration habituelle des précipitations ainsi que la circulation atmosphérique aux latitudes tropicales et peuvent avoir des répercussions à grande échelle sur le climat dans de nombreuses régions du monde.
NOAA: El Niño and La Niña Pages
-
NOAA National Oceanic and Atmospheric Administration
en NOAA's El Niño Page
en NOAA La Niña Page
Watts: Reference Pages
-
Watts Up With That? (Antony Watts)
en Atmosphere Page: Temperature, Pressure etc.
en Atmospheric Oscillation Page
en ENSO Page
en Geomagnetism Page
en Global Temperature Page
en Ocean Page
en Oceanic Oscillation Page
en Polar Vortex Page
en Potential Climatic Variables Page
en Sea Ice Reference Page
en Solar Reference Page
en The Spencer-Braswell & Dessler papers
en Tropical Cyclone Page
en US Weather History Reference Page
Here you'll find a collection of the most commonly used graphs, images, and data sources.
| de | en | fr |
|---|---|---|
|
Die Sonne Sonnenzyklen |
The Sun Sunspot cycles |
Le soleil Cycles solaires |
⇧ de Text en Text fr Texte
⇧
1 Ozeanzyklen steuern das Klima
en Ocean oscillation and Climate
fr Oscillations océaniques et climat
Mit folgenden Links wird von anderen Webseiten auf diese Seite verwiesen:
▶Ozeanzyklen steuern das KlimaLinks zur Klimaschau
|
|
▶Die Erwärmungspause ▶Klima-Auswirkungen / Wetterphänomene: Temperaturen ▶Ozeanzyklen steuern das Klima ▶Pole ▶Arktis ▶Antarktis |
de Verzeichnis en Contents fr Sommaire
- 2019
- de
AMO-Zyklus auf dem absteigenden Ast:
Rotes Meer wird sich in den kommenden Jahrzehnten wohl abkühlen
en Natural Climate Oscillations may Counteract Red Sea Warming Over the Coming Decades - 2017
- de So beeinflussen die pazifischen Ozeanzyklen das globale und nordamerikanische Klima
- de So beeinflussen die atlantischen Ozeanzyklen das europäische Klima
- de Sahelregen durch Ozeanzyklen gesteuert
- 2014
- de El Niño, die Wärme aus dem Meer
- en El Niño and La Niña Basics: Introduction to the Pacific Trade Winds
- 2009
- en Connecting ENSO, PDV, and the North and South Pacific
- 2005
- de Ozeanische Oszillation und Agrarrohstoffe!
Text
↑ 2019
↑
AMO-Zyklus auf dem absteigenden Ast:
Rotes Meer wird sich in den kommenden Jahrzehnten wohl abkühlen
en
Natural Climate Oscillations may Counteract Red Sea Warming Over the
Coming Decades
![]()
![]() Temperaturentwicklung des Roten Meeres
Temperaturentwicklung des Roten Meeres
-
Die kalte Sonne (Fritz Vahrenholt & Sebastian Lüning)
2019-07-07 de AMO-Zyklus auf dem absteigenden Ast: Rotes Meer wird sich in den kommenden Jahrzehnten wohl abkühlenVor sieben Jahren schlugen wir in unserem Buch "Die kalte Sonne" vor, Ozeanzyklen für Mittelfristprognosen einzusetzen.
Das Klimaestablishment war damals strikt dagegen.
Heute haben sich die Zeiten zum Glück geändert.
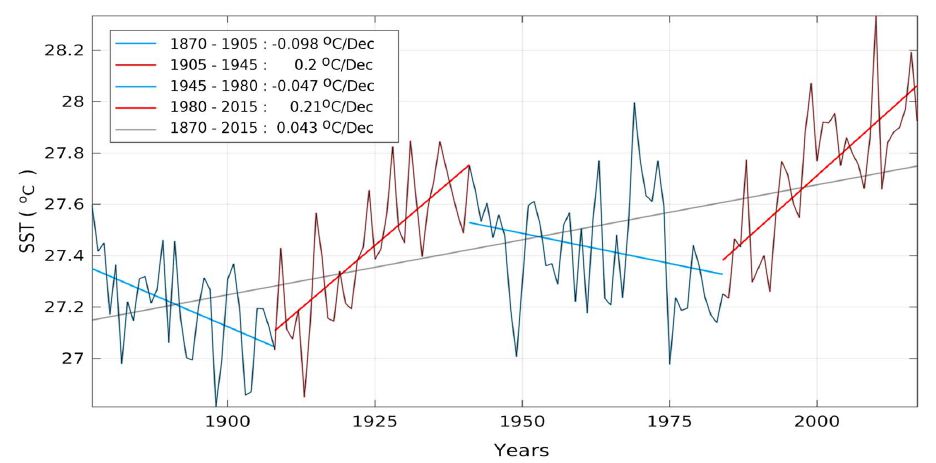
Ein Team um George Krokos analysierte am 15. März 2019 in den Geophysical Research Letters die Temperaturentwicklung des Roten Meeres, welches sich in den letzten Jahrzehnten spürbar erwärmt hat.
Die Forscher setzten dies in den Langfrist-Kontext und erkannten eine starke Korrelation mit dem 70-jährigen Ozeanzyklus der AMO (Atlantischen Multidekadenoszillation).
Da die AMO nun ihren Scheitelpunkt erreicht hat, erwarten Krokos und Kollegen nun eine Abkühlung des Roten Meeres in den kommenden drei Jahrzehnten.
Hier der Abstract des Papers:
-
Geophysical Research Letters
2019-03-15 en Natural Climate Oscillations may Counteract Red Sea Warming Over the Coming DecadesAbstract
Recent reports of warming trends in the Red Sea raise concerns about the response of the basin's fragile ecosystem under an increasingly warming climate.
Using a variety of available Sea Surface Temperature (SST) data sets, we investigate the evolution of Red Sea SST in relation to natural climate variability.
Analysis of long-term SST data sets reveals a sequence of alternating positive and negative trends, with similar amplitudes and a periodicity of nearly 70 years associated with the Atlantic Multidecadal Oscillation.
High warming rates reported recently appear to be a combined effect of global warming and a positive phase of natural SST oscillations.
Over the next decades, the SST trend in the Red Sea purely related to global warming is expected to be counteracted by the cooling Atlantic Multidecadal Oscillation phase.
Regardless of the current positive trends, projections incorporating long-term natural oscillations suggest a possible decreasing effect on SST in the near future.
|
|
AMO-Zyklus auf dem absteigenden Ast: Rotes Meer wird sich in den kommenden Jahrzehnten wohl abkühlen Ozeanzyklen: AMO-Atlantische Multidekaden-Oszillation, Ozeanzyklen steuern das Klima |
↑ 2017
↑ So beeinflussen die pazifischen Ozeanzyklen das globale und nordamerikanische Klima
-
Die kalte Sonne (Fritz Vahrenholt & Sebastian Lüning)
2017-10-18 de So beeinflussen die pazifischen Ozeanzyklen das globale und nordamerikanische KlimaDie Ozeanzyklen sind ein wichtiger Klimatreiber, der von der Wissenschaft viel zu lange übersehen wurde.
In unserem Buch "Die kalte Sonne" haben wir darauf hingewiesen, ernteten dafür aber zunächst nur Proteste.
Nun sind die Kritiker verstummt und machen sich endlich ernsthafte Gedanken.
Es gilt zu hoffen, dass bald auch die Modellierer die Ozeanzyklen vollständig und korrekt in ihre Simulationen aufnehmen.
Denn nur dann sind die Simulationen auch realistisch.
Der ein oder andere Leser mag bereits stöhnen:
Oh, schon wieder diese Ozeanzyklen.
Das haben wir doch mittlerweile verstanden, dass die wichtig sind.
Richtig.
Umso wichtiger ist es, die Entwicklung in der aktuellen Literatur zu dokumentieren und diskutieren.
Nachdem wir gestern den Atlantik beleuchtet haben, geht es heute in den Pazifik und zu den pazifischen Ozeanzyklen.
Der Pazifisch Dekadischen Oszillation (PDO) kommt hier eine besonders herausstechende Bedeutung zu.
↑ So beeinflussen die atlantischen Ozeanzyklen das europäische Klima
-
Die kalte Sonne (Fritz Vahrenholt & Sebastian Lüning)
2017-10-17 de So beeinflussen die atlantischen Ozeanzyklen das europäische KlimaDas Klima wandelt sich ständig.
Ein wichtiger Treiber sind die Ozeanzyklen, die lang Jahre von der Wissenschaft und dem IPCC ignoriert wurden.
Mittlerweile haben die Forscher jedoch gut aufgeholt und publizieren fleissig zum Klimafaktor Ozeanzyklen.
Nun wird es höchste Zeit, dass die Modellierer Nachtscichten einlegen und die Zusammenhänge in ihren Simulationen robust nachvollziehen.
Im Folgenden wollen wir eine kleinen Streifzug durch die neuere Literatur der atlantischen Ozeanzyklen unternehmen.
↑ Sahelregen durch Ozeanzyklen gesteuert
-
Die kalte Sonne (Fritz Vahrenholt & Sebastian Lüning)
2017-02-11 de Sahelregen durch Ozeanzyklen gesteuert
↑ 2014
↑ El Niño, die Wärme aus dem Meer
de El Niño, die Wärme aus dem Meer
-
Die kalte Sonne (Fritz Vahrenholt & Sebastian Lüning)
Frank Bosse & Fritz Vahrenholt
2014-06-09 de Die Sonne im Mai 2014 und die Wärme aus dem MeerEl Niños cause global warming
El Niño: span. für 'der Junge, das Kind', hier konkret: 'das Christuskind'.Ein Merkmal ist, dass sich ein El Niño immer am Ende eines Jahres in voller Pracht präsentiert, daher auch der Name: Christkind- Junge.
↑ en El Niño and La Niña Basics: Introduction to the Pacific Trade Winds
-
Watts Up With That? (Anthony Watts)
2014-02-23 en El Niño and La Niña Basics: Introduction to the Pacific Trade Winds
↑ 2009
↑ en Connecting ENSO, PDV, and the North and South Pacific
-
Watts Up With That? (Anthony Watts)
2009-10-16 en Connecting ENSO, PDV, and the North and South Pacific
↑ 2005
↑ Ozeanische Oszillation und Agrarrohstoffe!
-
GoldSeiten.de
2005-07-05 de Ozeanische Oszillation und Agrarrohstoffe!
⇧ 2 Ozeanzyklen / Ocean Cycles / Cycles océaniques
- a de
Die Pazifisch Dekadische Oszillation (PDO)
en The Pacific Decadal Oscillation (PDO)
fr L'oscillation décennale du pacific (ODP) - b de
Sechzig-Jahres-Ozeanzyklus in der Meeresspiegelentwicklung
en 60-Year Oscillation in Global Mean Sea Level
fr Le niveau des océans selon l'oscillation ODP de 60 ans - c de
Südpazifische Oszillation und Kosmische Strahlung
en South Pacific Oscillation and Cosmic Rays
fr Oscillation du Pacific Sud et rayonnement cosmique - d Forschungen / Research / Recherche
- e Rekonstruktion von Ozeanzyklen in der Vergangenheit
- f Im Takt der Sonne / Correlations with Solar Cycles / Correlationns avec cycles solaires
- g Anerkennung des Einflusses der Ozeanzyklen von Aktivisten der globalen Erwärmung
![]() Argo Floats : How do we measure the ocean?
Argo Floats : How do we measure the ocean?
-
Michael Coffman
2009-11-11 en Major Effect of Oceans On Climate
Changes in ocean currents explain almost all climate change in the past, while carbon dioxide has a very poor correlation.
Scientists explain the relationship of the Pacific Decadal Oscillation (PDO) and the Atlantic Multidecadal Oscillation(AMO), how it may be linked to solar cycles and why it explains climate change much better than greenhouse gases.
| de | en | fr |
|---|---|---|
| Temperatur | Temperature | Température |
| Temperatur und Wärmeinhalt der Ozeane | Temperatures and Heat content of the oceans | Températures et contenu thermique des océans |
![]() Argo Floats : How do we measure the ocean?
Argo Floats : How do we measure the ocean?
-
Michael Coffman
2009-11-11 en Major Effect of Oceans On Climate
Changes in ocean currents explain almost all climate change in the past, while carbon dioxide has a very poor correlation.
Scientists explain the relationship of the Pacific Decadal Oscillation (PDO) and the Atlantic Multidecadal Oscillation(AMO), how it may be linked to solar cycles and why it explains climate change much better than greenhouse gases.
-
Die kalte Sonne (Fritz Vahrenholt & Sebastian Lüning)
2014-09-05 de Vormals ungeliebte Ozeanzyklen schaffen in der Fachliteratur den Durchbruch: Temperaturentwicklung der letzten 100 Jahre wurde maßgeblich durch Ozeanzyklen geprägt
↑
a Die Pazifisch Dekadische Oszillation (PDO)
en The Pacific Decadal Oscillation (PDO)
fr L'oscillation décennale du pacific (ODP)
![]()
![]() Die Pazifisch Dekadische Oszillation (PDO) besitzt eine
Zyklendauer von ca. 60 Jahren.
Die Pazifisch Dekadische Oszillation (PDO) besitzt eine
Zyklendauer von ca. 60 Jahren.

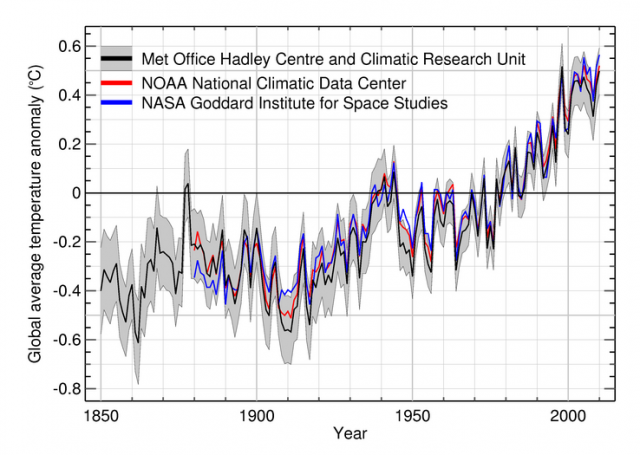
Die Pazifisch Dekadische Oszillation erhöht bzw. erniedrigt die Temperatur um jeweils etwa 0,2°C je nach PDO-Phase.
Der Erwärmungsstop im Jahr 2000 fällt mit dem Abstieg der PDO zusammen und stellt eine Wiederholung der Situation aus den 1940er Jahren dar
Aber es gibt ja nicht nur die PDO, sondern eine ganze Flöte von weiteren klimasysteminternen Zyklen.
Nehmen wir zum Beispiel die AMO. Auch sie besitzt einen etwa 60-jährigen Zyklus, der jedoch um 10-20 Jahre zeitverzögert zur PDO abläuft.
Und auch die Nordatlantische Oszillation (NAO) schwingt in diesem Größenmaßstab.
Ist es nicht verwunderlich, dass all diese Zyklen in ähnlichen Zeitmaßstäben schwingen, wenn auch nicht synchron?
-
Die kalte Sonne (Fritz Vahrenholt & Sebastian Lüning)
2012-07-28 de La Ola im Ozean: Die klimazyklische Stadionwelle
![]()
![]() Temperaturzyklen sind dem Langzeittrend überlagert.
Temperaturzyklen sind dem Langzeittrend überlagert.

Die Temperaturprognose aus dem 2007er IPCC-Bericht folgt offensichtlich der durch die Ozeanzyklen übersteilten Flanke, wäre jedoch besser dem Langzeittrend gefolgt.
Der Langzeittrend wird zudem vermutlich in Kürze für eine Weile abknicken, da die Sonnenaktivität als wichtige Einflussgröße in den kommenden Jahrzehnten abnehmen wird.
-
Die kalte Sonne (Fritz Vahrenholt & Sebastian Lüning)
2012-06-19 de Wu et al. 2011: Erwärmung im späten 20. Jahrhundert durch Ozeanzyklen verstärkt
|
|
↑
b Sechzig-Jahres-Ozeanzyklus in der Meeresspiegelentwicklung
en 60-Year Oscillation in Global Mean Sea Level?
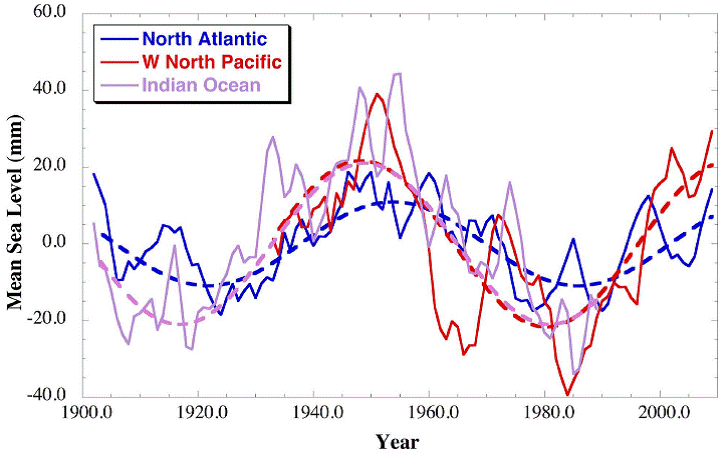
de Die Meeresspiegelentwicklung des letzten Jahrhunderts ist durch einen ausgeprägten 60-Jahres-Zyklus geprägt.
Auch das Ende der Erwärmung 1940 und 2000 lag wiederum 60 Jahre auseinander.
en We find that there is a significant oscillation with a period around 60-years in the majority of the tide gauges examined during the 20th Century, and that it appears in every ocean basin.
|
|
Sechzig-Jahres-Ozeanzyklus auch in der Meeresspiegelentwicklung |
↑
c Südpazifische Oszillation und Kosmische Strahlung
en South Pacific Oscillation and Cosmic Rays
fr Oscillation du Pacific Sud et rayonnement cosmique
|
Südpazifischen Oszillation und kosmischen Strahlung
Eine Gegenüberstellung der um 30 Monate zeitverzögerten gleitenden 3 Jahresmittel der Südpazifischen Oszillation und der durch die Sonnenaktivität modulierten kosmischen Strahlung zeigt in Abb. 4d eine gute Übereinstimmung im periodischen Verlauf von 1980 bis 2008 und weist auf die extraterrestrische Beeinflussung der La Nina - El Nino Perioden hin.
|
de Kurzfassung
Vergleichbar mit den Untersuchungsergebnissen der Nordatlantischen Oszillation (NAO) wird auch die Südpazifische Oszillation (SO) durch Sonnenaktivität beeinflusst:
Während der Wärmeperiode ab 1980 wird eine Resonanz zwischen den Periodizitäten der Sonnenfleckenhäufigkeit in der 22. und 23. Sonnenfleckenperiode und des Sonnenwindindex "aa" mit der zeitverzögerten Südpazifischen Oszillation beobachtet.
Auch die durch die Magnetfelder der Sonnenwinde ausgelösten Periodizitäten der Kosmischen Strahlung sind in diesem Zeitraum mit der zeitverzögerten Südpazifische Oszillation (SO) in Resonanz (K=0,8).
Das führt zu solar gesteuerter Bewölkungsreduktion durch den Svensmark-Effekt und dadurch zu verstärkter Sonneneinstrahlung.
Es erfolgt so ein zusätzlicher Temperaturanstieg und eine zusätzliche Erwärmung des Ozeans in der südlichen Hemisphäre.
Diese solar bewirkte Meereserwärmung führt zur Emission von gelöstem CO2, was als Zusatzdüngung der Weltflora dient.
Eine Temperaturerhöhung durch CO2 lässt sich aus den Messwerten nicht ableiten.
Mit Beendigung der Sonnenaktivität im Dezember 2006 hat auch in der südlichen Hemisphäre eine kalte Wetterperiode begonnen.
en Abstract
It was found that the South Pacific Oscillation (SO) is influenced by Sun activity similar to the North Atlantic Oscillation (NAO).
Especially during the warming period from 1980 to 2009 the oscillation of Sunwind - Index "aa" was in good resonance with the delayed South Pacific Oscillation.
The same observation was found between the Oscillation of Cosmic Radiation, which is controlled by the Forbush - Reduction by the magnetic fields of the sun protons of the Sunwind and the delayed SO (K=0,8).
The consequence of this observations is the postulation, that the increase of global temperature in the Southern Hemisphere was caused by sun activity with strong emissions of Proton-rays in Earth's direction during the 22. and 23. Sunspot-Periods reducing Cosmic Rays with the consequence of reduction of cloudiness, increasing global rays and warming up the lower atmosphere (Svensmark - Effect).
As a consequence resolved CO2 was continuously emitted from the slowly warming up Ocean giving a good fertilizer of the flora of the world.
A relevance of CO2 concerning Climate Change could not be found.
With the end of Sun activity in 2006 a cold weather period has started in the Southern Hemisphere too.
|
Horst Borchert †2015-11-11 |
Dr. Dipl. Physiker,
Physikdirektor a. D. Lehrbeauftragter am Geographischen Institut der
Johannes Gutenberg-Universität Mainz, i.R.;
Beiratsmitglied von EIKE
▶Horst Borchert: Who is who (Skeptiker) ▶Horst Borchert: Präsentationen (Artikel & Vorträge) ▶Horst Borchert: Video (Präsentationen) |
|
|
↑
d Forschungen
en Research
fr Recherche
-
Die kalte Sonne (Fritz Vahrenholt & Sebastian Lüning)
Frank Bosse und Fritz Vahrenholt
2014-01-08 de Neues vom Nordatlantik: Das natürliche "Day after Tomorrow"- Szenario?Im Artikel wird festgestellt, dass die AMOC (Atlantic Meridional Overturning Circulation, der polwärts gerichtete Wärmestrom des nördlichen Atlantiks) im sehr raschen Sinken ist, seit 2004, dem Beginn der kontinuierlichen Messungen.
Der Transport von wärmeren Wässern bis hinauf zu 70 Grad Nord passiert ausschließlich zwischen Europa und Kanada, die in den Tropen erwärmten Wassermassen strömen polwärts ( meridional) und beeinflussen so die Temperaturen von großen Teilen Eurasiens und auch der Ostküste Amerikas.
Mit verantwortlich dafür ist die AMOC, die sehr große Wärmemengen bewegt.
Ein Bestandteil des atlantischen Wärmetransports ist der Golfstrom, sein Anteil hat sich nur wenig geändert, da er vom Passatwind bestimmt wird.
Hier geht es um die Thermohaline Zirkulation (durch Temperatur- und Dichteunterschiede angetrieben), bei der also eine recht schnelle Schwächung beobachtet wird.
-
Die kalte Sonne (Fritz Vahrenholt & Sebastian Lüning)
2013-12-18 de Forscherteam der University of Colorado Boulder: Ozeanzyklen haben Meeresspiegelanstieg in den letzten 20 Jahren verstärkt
-
Die kalte Sonne (Fritz Vahrenholt & Sebastian Lüning)
2013-12-17 de Neue Arbeit in den Geophysical Research Letters: Ozeanzyklen führen in den kommenden 15 Jahren auf der Nordhalbkugel zu leichter Abkühlung
-
Die kalte Sonne (Fritz Vahrenholt & Sebastian Lüning)
2013-11-16 de Nicola Scafetta in Earth Science Reviews: Die Hälfte der Erwärmung der letzten Jahrzehnte wurde durch einen natürlichen Zyklus hervorgerufen
-
Die kalte Sonne (Fritz Vahrenholt & Sebastian Lüning)
2013-11-14 de Erwärmungsstudie des Alfred-Wegener-Instituts versäumt es, einen wichtigen natürlichen Atlantikzyklus zu erwähnen
-
Die kalte Sonne (Fritz Vahrenholt & Sebastian Lüning)
2013-09-10 de Chinesische Studie: Etwa die Hälfte der Erwärmung der letzten 30 Jahre geht auf das Konto von natürlichen Ozeanzyklen
-
Die kalte Sonne (Fritz Vahrenholt & Sebastian Lüning)
2013-09-09 de Faz-Artikel "Warum macht der Klimawandel Pause?": Plötzlich waren die Ozeanzyklen salonfähig
-
Die kalte Sonne (Fritz Vahrenholt & Sebastian Lüning)
2013-05-11 de Neue Arbeit in PNAS: 40% der Erwärmung der letzten 50 Jahre ist durch Ozeanzyklen bedingt
-
Die kalte Sonne (Fritz Vahrenholt & Sebastian Lüning)
2013-03-10 de Natürlicher 1500-Jahreszyklus in der Klimaentwicklung Alaskas entdeckt
-
Die kalte Sonne (Fritz Vahrenholt & Sebastian Lüning)
2012-11-24 de Klimamodelle mit Ozeanzyklen sind einfach präziser
-
Die kalte Sonne (Fritz Vahrenholt & Sebastian Lüning)
2012-11-14 de Klimamodelle kriegen die Ozeanzyklen nicht in den Griff
-
Die kalte Sonne (Fritz Vahrenholt & Sebastian Lüning)
2012-10-31 de Neues Paper halbiert die anthropogene Erwärmungsrate der letzten 50 Jahre
-
Die kalte Sonne (Fritz Vahrenholt & Sebastian Lüning)
2012-10-06 de Golfstrom bleibt laut neuen Messdaten stabil: Stefan Rahmstorfs Modell beginnt zu wackeln
-
Die kalte Sonne (Fritz Vahrenholt & Sebastian Lüning)
2012-09-20 de Sechzig-Jahres-Ozeanzyklus jetzt auch in der Meeresspiegelentwicklung gefunden
-
Die kalte Sonne (Fritz Vahrenholt & Sebastian Lüning)
2012-09-12 de Wer zieht denn da? Der mögliche Einfluss von planetarischen Gezeiteneffekten auf die Sonne und das Erdklima
-
Die kalte Sonne (Fritz Vahrenholt & Sebastian Lüning)
2012-07-28 de La Ola im Ozean: Die klimazyklische Stadionwelle
-
Die kalte Sonne (Fritz Vahrenholt & Sebastian Lüning)
2012-06-19 de Wu et al. 2011: Erwärmung im späten 20. Jahrhundert durch Ozeanzyklen verstärkt
Hans von Storch | Professor am Institut für Meteorologie der Universität Hamburg und Leiter des "Instituts für Küstenforschung" am Helmholtz-Zentrum Geesthacht - Zentrum für Material- und Küstenforschung in Geesthacht. |
|---|
Mit folgendem Link wird von anderen Webseiten auf diese Seite verwiesen.
| Hans von Storch |
Professor am Institut für Meteorologie der Universität Hamburg und
Leiter des "Instituts für Küstenforschung" am Helmholtz-Zentrum Geesthacht
- Zentrum für Material- und Küstenforschung in Geesthacht.
▶Hans von Storch: Who is who (Aktivisten der anthropogenen Globalen Erwärmung) |
de Allgemein en General fr Générale
-
Wikipedia
de
Hans von Storch
en Hans von Storch
| de | en | fr |
|---|---|---|
|
Klima: Diskussion Aussagen Klima Skandal: Evaluation Aussagen |
Climate change: Discussion Declarations Climate Scandal: Evaluation Declarations |
Climat: Discussion Déclarations Scandale: Évaluations Déclarations |
de Verzeichnis en Contents fr Sommaire
- 2016
- de Hans von Storch unterliegt historischem Irrtum: The science is settleds
- de Interview mit sachlichem Unsinn ohne Grenzen
- 2015
- de "Die Medien neigen immer zum Übertreiben, nicht nur beim Klimathema"
- 2013
- de Wir stehen vor einem Rätsel
- de Klimaforscher Hans von Storch: Klimamodelle berücksichtigen möglicherweise Änderungen der Sonnenaktivität zu wenig
- de Hans von Storch stärkt Klimaskepsis
- 2009
- de
 Das Klima-Kartell? Von Storch,
Latif und Rahmstorf äußern sich zu Climategate
- 2004
- de
Die Hockeyschläger-Kurve: "Die Kurve ist Quatsch"
en The Hockeystick Curve: The graph is non-sense
de Text en Text fr Texte
⇧ 2016
↑ Hans von Storch: The Science is settled - ein historischer Irrtum
-
Die kalte Sonne (Fritz Vahrenholt & Sebastian Lüning)
2016-08-05 de Hans von Storch unterliegt historischem Irrtum: The science is settledHans von Storch trat am 4. Juli 2016 auf Phoenix anlässlich des Petersbergers Klimadialogs in einem 5-minütigen Interview zum Klimawandel auf.
The Science is settled - ein historischer Irrtum
Darin gibt er vor, dass die Klimawissenschaftler die wesentlichen Punkte angeblich bereits geklärt hätten.
The Science is settled.
Ein historischer Irrtum, dem von Storch hier aufsitzt.
Eigentlich müsste er es besser wissen.
Von Storch ist der Mann der zwei Gesichter.
Hier im Phoenix-Interview gibt er vor, alles wäre wissenschaftlich voll unter Kontrolle.
An anderer Stelle hat er klar eingeräumt, dass es noch immer grundlegende Verständnislücken gibt, die es dringend zu klären gilt:
↑ Hans von Storch - Interview mit sachlichem Unsinn ohne Grenzen
-
EIKE Europäisches Institut für Klima und Energie
2016-04-20 de Wie der von SPIEGEL-Online im Interview mit Hans v. Storch veröffentlichte sachliche Unsinn keine Grenzen mehr kennt.Programmentwurfspunkt Klimawandel der AfD
Prof. Hans v. Storch äußert sich im SPIEGEL-Online zum Programmentwurfspunkt Klimawandel der AfD.
Das Ergebnis dieses Interviews ist ein Gemenge von fachlicher Inkompetenz des Herrn v.Storch oder seiner bewussten Verfälschung der Fakten.
In jedem Fall ist es eine Demonstration von Diskussionsverweigerung.
Selbstentlarvung des SPIEGEL
Und schlussendlich ist es die Selbstentlarvung des SPIEGEL als eines ideologischen Blatts, das sich der journalistischen Pflicht von Recherche und Neutralität entledigt hat.
Wer für den abstrusen Interview-Salat hauptverantwortlich war, ist ohne Insiderwissen nicht zu entscheiden.
Nehmen wir daher in Ermangelung besseren Wissens die SPON-Aussagen, so wie sie veröffentlicht sind und machen den Faktencheck.
⇧ 2015
↑ Hans von Storch: "Die Medien neigen immer zum Übertreiben, nicht nur beim Klimathema"
-
Die kalte Sonne (Fritz Vahrenholt & Sebastian Lüning)
2015-11-11 de Hans von Storch: "Die Medien neigen immer zum Übertreiben, nicht nur beim Klimathema"Medienberichterstattung: "Alles ist nicht Klimawandel"
Der Wirbelsturm Katrina hatte nichts mit dem Klimawandel, sondern mit miserablem Küstenschutz in New Orleans zu tun, betonte der Klimaforscher Hans von Storch im DLF.
Die Medienberichterstattung über den Klimawandel hält er für zuspitzend und übertrieben.
Es sei dann an ihm und seinen Kollegen, das immer mal wieder richtigzustellen.
Aussagen
Ich glaube, die Medien neigen immer zum Übertreiben, nicht nur beim Klimathema, sondern bei allen Themen, weil es ja darum geht, eine Geschichte zu erzählen an Kunden, und eine etwas zugespitzte Geschichte ist immer ein bisschen besser als eine langweilige Geschichte.
Insofern ist es normal, dass die Medien übertreiben, in beide Richtungen.
Das wundert natürlich keinen.
... und da kommt es für uns als Klimaprofis auch ein bisschen darauf an, ab und zu mal zu sagen, nun geht ihr mal ein bisschen zu weit, hört mal jetzt auf damit, bleibt mal ein bisschen an dem, was wir tatsächlich wissen.
⇧ 2013
↑ Hans von Storch: Wir stehen vor einem Rätsel
Mit folgendem Link wird von anderen Webseiten auf diese Seite verwiesen.
▶Hans von Storch fordert in einem solchen Fall Misstrauensvotum gegen CO2
![]()
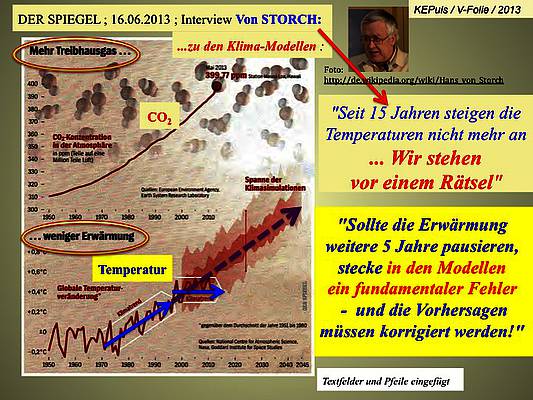
![]() 2013: SPIEGEL-GESPRÄCH "Wir stehen vor einem Rätsel"
2013: SPIEGEL-GESPRÄCH "Wir stehen vor einem Rätsel"
|
-
Wirtschaft Woche
2013-04-15 de Hans von Storch: "Zu viele setzen nur auf steile Thesen"Wie lange müsste der Stopp der Erderwärmung anhalten, damit Sie ins Grübeln kommen?
Wenn die Phase weitere zehn Jahre andauern würde, würde ich die These hinterfragen, dass die Treibhausgase wesentliche Ursache für die Erderwärmung sind.
-
Die kalte Sonne (Fritz Vahrenholt & Sebastian Lüning)
2013-10-21 de Judith Curry prognostiziert Erwärmungspause bis in die 2030er Jahre: Hans von Storch fordert in einem solchen Fall Misstrauensvotum gegen CO2
-
Die kalte Sonne (Fritz Vahrenholt & Sebastian Lüning)
2013-07-28 de Klimaforscher Hans von Storch im Spiegel-Interview: Wir stehen vor einem RätselAussagen
Ich glaube aber persönlich nicht, dass Frau Merkel sich wirklich mit dem Thema auseinandergesetzt hat - sonst wüsste sie, dass es jenseits ihrer Umweltverwaltung noch andere Einschätzungen gibt.
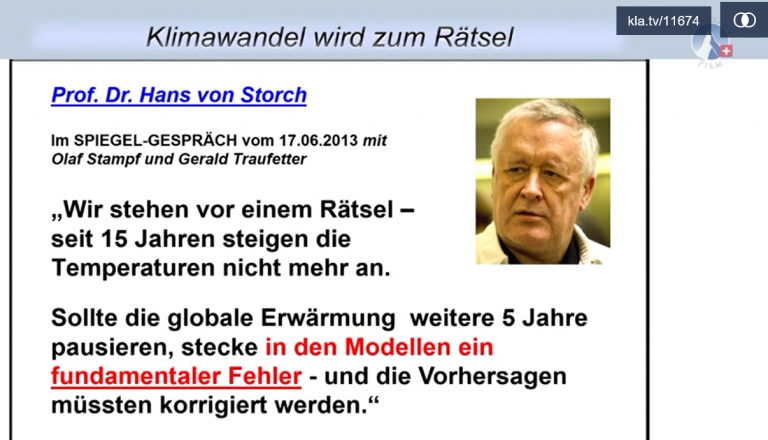
Bislang kann niemand eine überzeugende Antwort liefern, warum der Klimawandel eine Pause eingelegt hat.
Wir stehen vor einem Rätsel.
Die CO2-Emissionen sind jüngst sogar noch stärker angestiegen als befürchtet.
Als Folge davon hätte es nach den meisten Klimamodellen in den letzten zehn Jahren rund 0,25 Grad wärmer werden müssen. Doch das ist nicht geschehen.
Tatsächlich waren es in den letzten 15 Jahren gerade mal 0,06 Grad - also ein Wert nahe null.
Diesem ernsten wissenschaftlichen Problem wird sich auch der Weltklimarat IPCC stellen müssen, wenn er Ende des Jahres seinen nächsten Sachstandsbericht präsentiert.
Quelle / Source:
-
Spiegel Online
2013-06-17 de "Wir stehen vor einem Rätsel"Seit 15 Jahren steigen die Temperaturen nicht mehr an.
Sollte die globale Erwärmung weitere 5 Jahre pausieren, sagt der Klimaforscher Hans von Storch, stecke in den Modellen ein fundamentaler Fehler - und die Vorhersagen müssten korrigiert werden.
↑ Klimaforscher Hans von Storch: Klimamodelle berücksichtigen möglicherweise Änderungen der Sonnenaktivität zu wenig
-
Die kalte Sonne (Fritz Vahrenholt & Sebastian Lüning)
2013-09-13 de Klimaforscher Hans von Storch: Klimamodelle berücksichtigen möglicherweise Änderungen der Sonnenaktivität zu wenigAm 9. September 2013 hat Prof. Hans von Storch, Direktor des Instituts für Küstenforschung am Helmholtz-Zentrum Geesthacht, ein bemerkenswertes Interview im Deutschlandfunk gegeben, auf das ich Sie hinweisen möchte.
Auf die Frage nach dem seit 15 Jahren fehlenden Anstieg der Temperaturen antwortet von Storch:
"Es ist aber so, dass wir tatsächlich in den letzten 15 Jahren einen deutlich geringeren Erwärmungstrend hatten, als unsere Szenarien, die mit Klimamodellen hergestellt worden sind, uns avisiert haben."
Auf die Frage nach den Ursachen führt er aus:
"Zum einen ist das die natürliche Klimavariabilität.
Das Klima wackelt auch von alleine und weil es dynamische Prozesse in dem Klimasystem gibt.
Diese Variabilität könnte nun mal in eine andere Richtung gehen, hin zu einer Verlangsamung der Erwärmung.
Eine andere Erklärung könnte sein, dass wir bisher die Wirkung der Treibhausgase ein bisschen überschätzt haben, dass wir deshalb stärkere Erwärmungen erwartet haben.
Oder schließlich, dass ein weiterer Faktor hier mitwirkt:
Man könnte da zum Beispiel an die Sonne denken oder Ähnliches."Da ist er, der bemerkenswerte und mutige Tabubruch eines etablierten deutschen Klimaforschers:
Man könnte auch an die Sonne denken.
Aber von Storch geht noch einen Schritt weiter:
"Wir rechnen eigentlich mit unseren Klimamodellen immer nur den zukünftigen Effekt von Treibhausgasen und eventuell auch industriellen Aerosolen hinein.
Aber wir berücksichtigen zum Beispiel nicht die systematischen Änderungen der Sonnenleistung in der Zukunft.
Insofern kann es sein, dass die Klimamodelle ganz wunderbar in Ordnung sind.
Nur wir haben sie nicht genügend versorgt mit den relevanten Angaben, die man braucht, um Zukunft bestimmen zu können."
Eine solche Aussage - zwei Wochen vor der Veröffentlichung des 5. IPCC Klimaberichts, in dem die Sonne erneut eine für unsere Klimaentwicklung zu vernachlässigende Größe spielt - ist mutig und verdient Beachtung.
↑ Hans von Storch stärkt Klimaskepsis
-
Science Skeptical Blog / Peter Heller
2013-06-23 de Hans von Storch stärkt Klimaskepsis
⇧ 2009
↑ Das Klima-Kartell? Von Storch, Latif und Rahmstorf äußern sich zu Climategate
Während auf der Klimakonferenz Politiker aus aller Welt um einen neuen Klimavertrag ringen, rumort es in der Wissenschaftswelt:
Werden Klimaszenarien übertrieben oder Daten vor der Öffentlichkeit geheim gehalten?
Hans von Storch, Mojib Latif und Stefan Rahmstorf äußern sich in der Sendung ZDF.UMWELT vom 13.12.2009 zur Climategate Affäre.
⇧ 2004
↑
Die Hockeyschläger-Kurve: "Die Kurve ist Quatsch"
en
The Hockeystick Curve: The graph is non-sense
-
Spiegel
2004-10-04 Interview with Prof. Hans von Storch on his latest paper in ScienceDie Hockeyschläger-Kurve / The Hockeystick Curve
de Klima: "Die Kurve ist Quatsch"
Der deutsche Klimaforscher Hans von Storch, 55, zum Wissenschaftlerstreit über die Temperaturkurve der letzten tausend Jahre und den Treibhauseffekt
Spiegel
Sie behaupten, die Rekonstruktion vergangener Temperaturen durch die US-Forscher um Michael Mann sei falsch.
Wie kommen Sie darauf ?Storch
Die Mann-Kurve besagt, dass es in den letzten tausend Jahren nie wärmer war als heute.
In geradezu perfektem Verlauf sinkt sie vom Mittelalter bis um 1800 ab, um dann sei Beginn der Verbrennung fossiler Brennstoffe in die Höhe zu schiessen.
Die Berechnungen von Mann basieren unter anderem auf der Analyse von Baumringen und Korallen.
Wir konnten nun in einer Veröffentlichung in "Science" demonstrieren, dass in der Kurve unzulässige Annahmen stecken.
Methodisch ist sie falsch, man könnte auch sagen: Quatsch.
en Climate: The graph is non-sense
The German climate researcher Hans von Storch comments on the dispute between scientist concerning the temperature curve of the last thousand years and the greenhouse effect.
Spiegel
You claim that the reconstruction of past temperatures by the US researcher Michael Mann is wrong.
What gives you this idea?Storch
The Mann graph indicates that it was never warmer during the last ten thousand years than it is today.
In a near perfect slope the curve declines from the Middle Ages up to 1800, only to shoot up sharply with the beginning of fossil burning.
Mann calculations rest, inter alia, on analyses of tree rings and corals.
We were able to show in a publication in 'Science' that this graph contains assumptions that are not permissible.
Methodologically it is wrong: rubbish.
| Michael E. Mann |
Dr. Distinguished Professor für Meteorologie
und Direktor am Zentrum für Geowissenschaften
("Earth System Science Center") der Pennsylvania State
University (USA).
▶Michael E. Mann: Who is who (Aktivisten der anthropogenen Globalen Erwärmung) ▶Ausschluss und Maulkorb für Kritiker (Das renommierte amerikanische Museum für nationale Geschichte (AMNH) in New York Opfer des Klimakriegs) |
| de | en | fr |
|---|---|---|
|
Fehler, Teil I Falsche Temperaturen von IPCC und Kyoto Das Hockeyschläger Diagramm Fälschung von Michael Mann Das IPCC lässt das Mittelalterliche Klimaoptimum verschwinden |
Errors, Part I Wrong temperatures of IPCC and Kyoto The Hockey Stick Curve Falsification by Michael Mann IPCC changed viewpoint on the MWP in 2001 |
Erreurs, partie I Fausses températures du GIEC et de Kyoto La courbe en crosse de hockey Falsification par Michael Mann Le GIEC fait disparaître l'optimum médiéval climatique |
↑ e Rekonstruktion von Ozeanzyklen in der Vergangenheit
Quelle und weitere Informationen:
-
Die kalte Sonne (Fritz Vahrenholt & Sebastian Lüning)
2014-09-06 de IPCC-Mitbegründer Bert Bolin hatte die klimatische Rolle der Ozeanzyklen bereits sehr wohl gekannt
| Deng et al. 2013 | Rekonstruktion der PDO seit 1853 mithilfe von Korallen im Südchinesischen Meer |
| Olafsdottir et al. 2013 | Rekonstruktion der AMO und NAO in Island für die vergangenen 3000 Jahre |
| Svendsen et al. 2014 | Rekonstruktion der AMO für die vergangenen 200 Jahre |
| Chylek et al. 2012 | Rekonstruktion der AMO für die vergangenen 660 Jahre anhand von Eiskernen |
| Chiessi et al. 2013 | AMO in Brasilien während der letzten 5000 Jahre |
| Olsen et al. 2012 | NAO der letzten 5200 Jahre |
↑
f Im Takt der Sonne
en Correlations with Solar Cycles
fr Correlationns avec cycles solaires
-
Die kalte Sonne (Fritz Vahrenholt & Sebastian Lüning)
2013-07-24 de Antarktisches Oberflächeneis wuchs und schmolz in den vergangenen 800 Jahren im Takt der Sonnenaktivität
-
Die kalte Sonne (Fritz Vahrenholt & Sebastian Lüning)
Horst Malberg
2013-05-12 de Klimawandel seit der Kleinen Eiszeit: Die Wirkung der Sonne wurde unterschätzt
-
Die kalte Sonne (Fritz Vahrenholt & Sebastian Lüning)
2013-04-05 de Sonne erwärmt Erde anders als Treibhauseffekt? Klimamodellierer übersehen aktive Sonne der vergangenen 50 Jahre
-
Die kalte Sonne (Fritz Vahrenholt & Sebastian Lüning)
2013-03-25 de Seespiegel des Kaspischen Meeres pulsierte im Takt der Sonne: Fallende Pegel während der Mittelalterlichen Wärmeperiode
-
Die kalte Sonne (Fritz Vahrenholt & Sebastian Lüning)
2013-03-23 de Krankheitswellen im Takte der Sonne? Das Pionierwerk "Schuld ist die Sonne" von 1975
-
Die kalte Sonne (Fritz Vahrenholt & Sebastian Lüning)
2013-03-21 de Grönlandische Temperaturen von Sonnenaktivität beeinflusst: Je stärker die Sonne, desto kälter war es in Grönland
-
Die kalte Sonne (Fritz Vahrenholt & Sebastian Lüning)
2013-03-19 de Osteuropäische Kälteperioden während solarer Schwächephasen
-
Die kalte Sonne (Fritz Vahrenholt & Sebastian Lüning)
2013-03-18 de Natürliche Variabilität: Wirbelstürme an der mexikanischen Pazifikküste pusteten im Takt des solaren Schwabe-Zyklus
-
Die kalte Sonne (Fritz Vahrenholt & Sebastian Lüning)
2013-03-18 de Solarer 11-Jahreszyklus beeinflusst Temperaturen über Europa lokal um mehr als 1 Grad
↑ g Anerkennung des Einflusses der Ozeanzyklen von Aktivisten der globalen Erwärmung
-
Die kalte Sonne (Fritz Vahrenholt & Sebastian Lüning)
2014-09-06 de IPCC-Mitbegründer Bert Bolin hatte die klimatische Rolle der Ozeanzyklen bereits sehr wohl gekannt
-
Die kalte Sonne (Fritz Vahrenholt & Sebastian Lüning)
2013-08-24 de Mojib Latif: Natürlicher Ozeanzylus bremst zurzeit die Erwärmung
-
Die kalte Sonne (Fritz Vahrenholt & Sebastian Lüning)
Frank Bosse
2013-05-16 de Mojib Latif hatte Recht: Wohl keine Erwärmung in den nächsten Jahren
-
Die kalte Sonne (Fritz Vahrenholt & Sebastian Lüning)
Frank Bosse
2013-03-14 de Leiter des russischen WWF-Klimaprogramms: 60-Jahres-Ozeanzyklus wird in den kommenden zwei Jahrzehnten voraussichtlich für Abkühlung sorgen
⇧ 3 El Niño (der Knabe/warm) & La Niña (das Mädchen/kalt)
Mit folgenden Links wird von anderen Webseiten auf diese Seite verwiesen:
▶El Niño (der Knabe/warm) & La Niña (das Mädchen/kalt)
Links zur Klimaschau
|
|
▶El Niño (der Knabe/warm) & La Niña (das Mädchen/kalt) ▶ENSO: El Niño‑Southern Oscillation |
| Siehe auch: | ▶ENSO: El Niño‑Southern Oscillation |
⇧ de Verzeichnis en Contents fr Sommaire
- a Das ENSO-Phänomen
- b Oceanic Niño Index (ONI)
- c El Niño Stärken
- d Korrelationen mit El Niño & La Niña
- 2018
- de Klimaschützer können auf steigende Temperatur hoffen!
- 2017
- de El Ninos während der Kleinen Eiszeit intensiver und häufiger als in Warmperioden
- de University of Washington: Modelle können Einfluss des Klimawandels auf El Ninos nicht zuverlässig vorhersagen
- de Zwei Super-Christuskinder: El Nino 2015/16 erreichte ähnliche Stärke wie 1997/98
- 2016
- fr El Niño L'enfant terrible du climat
- 2015
- de Fachwelt ist sich einig: El Nino-Prognose bleibt schwierig. Das PIK hingegen spricht von einem "Durchbruch" der Vorhersagekunst
- de Neue Studie aus Peru: El Nino lässt Kinder schrumpfen
- 2014
- de Kein Trend in der El Nino-Entwicklung der letzten 150 Jahre: Klimamodelle mit zukünftigem Dauer-El Nino können die Vergangenheit nicht reproduzieren
- 2011
- de Raimund Leistenschneider: La Niña und El Niño, was sich dahinter verbirgt und was sie, wann auslöst - Die Sonne ist an allem schuld
- 1998
- en Dr. Theodor Landscheidt: Solar Activity Controls El Niño and La Niña
⇧ Welt-Info
|
|
Ozeane / Oceans / Océans | ||
| ▷Die Kalte Sonne Blog‑Themen Vahrenholt/Lüning ▶Die kalte Sonne |
de
▷Ozeanzyklen
▷El Nino El Niño (warm) & La Niña (kalt) Perioden ▷AMO Atlantische Multidekaden-Oszillation / Atlantic Multidecadal Oscillation ▷NAO Nordatlantische Oszillation / North Atlantic Oscillation ▷PDO Pazifische Dekaden-Oszillation / Pacific Decadal Oscillation ▷Golfstrom / Gulf Stream ▷Ozeanische Wärme |
||
| EIKE | de Ozean | ||
| ►Der Wasserplanet (Ernst-Georg Beck) | de ▷Der hydrologische Zyklus (Wayback‑Archiv) | ||
| WUWT |
en
Ocean Page Oceanic Oscillation Page ENSO (El Nino/La Nina Southern Oscillation) Page Atmospheric Oscillation Page Potential Climatic Variables Page Geomagnetism Page |
||
| NoTricksZone |
en
Oceans
Sea Levels 100+ Papers - Sun Drives Climate |
||
| Popular Technology |
en
1350+ Peer-Reviewed Papers Supporting Skeptic Arguments Sea Level Gulf Stream Ocean Acidification Coral Reefs 1,500-Year Climate Cycle Satellite Temperatures Historic |
||
| Wikipedia |
|
||
| Vademecum |
▶Ozeanzyklen/Ozeanische Oszillationen
▶Welt-Info |
||
| Begriffe |
de
Begriffe und Definitionen en Terms and Definitions fr Termes et définitions |
||
| Siehe auch: |
▶El Niño (der Knabe/warm) & La Niña (das Mädchen/kalt)
▶ENSO: El Niño‑Southern Oscillation |
⇧ de Allgemein en General fr Générale
|
⇧ de Text en Text fr Texte
↑ a Das ENSO-Phänomen
-
ENSO Info / Kurt G. Baldenhofer
de Das ENSO-PhänomenInformationen zum ozeanisch-atmosphärischen Phänomen El Niño / Southern Oscillation
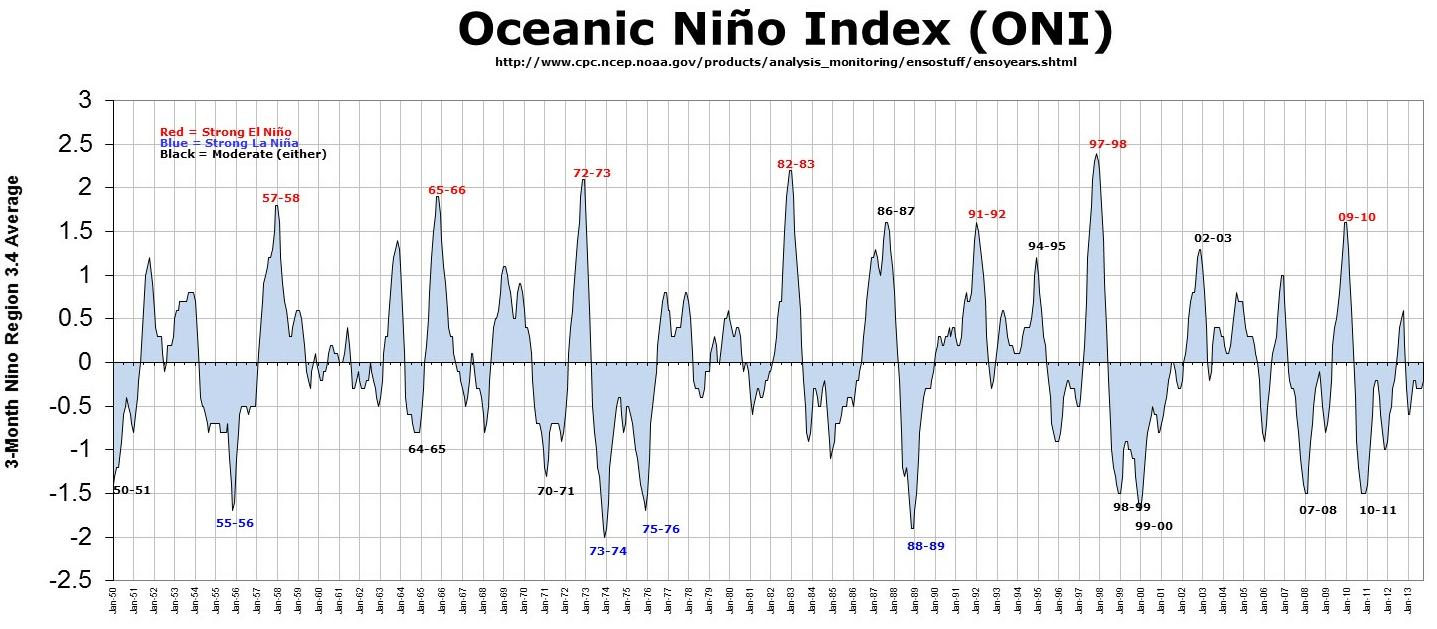
↑ b Oceanic Niño Index (ONI)
Quelle/Source:
-
Golden Gate Weather Services.
en El Niño and La Niña Years and Intensities Based on Oceanic Niño Index (ONI)
↑ c El Niño Stärken
![]()
![]() El Niño & La Niña - Temperatur
El Niño & La Niña - Temperatur
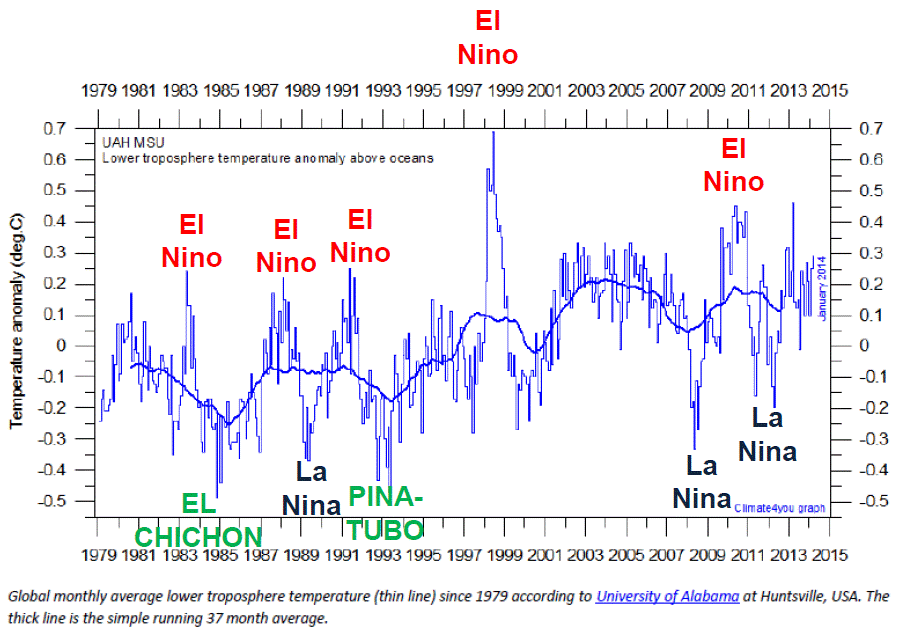
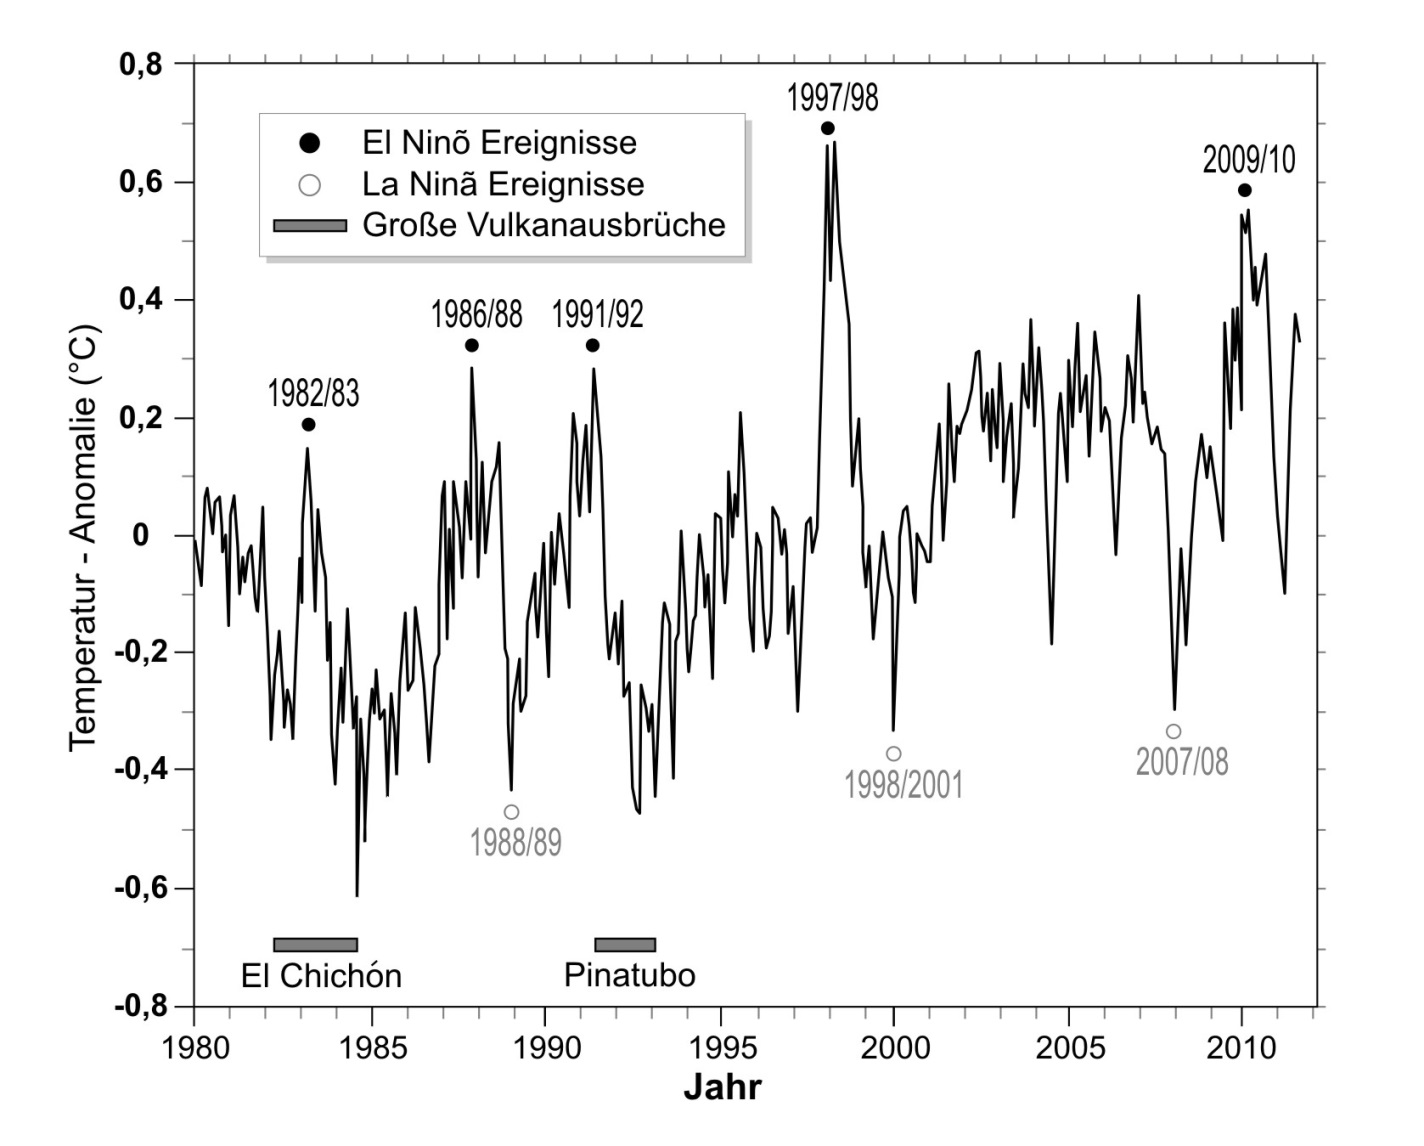
El Ninos treten alle 2-7 Jahre auf.
Ihre Stärke ist unterschiedlich und es wird in schwache, moderate und starke El Ninos unterschieden.
- Der El Nino von 1998 gehört in die Kategorie "stark" und besitzt noch immer den Temperaturrekord.
- Der El Nino von 2009/2010 war "moderat". Die Temperatur lag nach UAH-Datensatz um satte 0,25°C unter der von 1998.
- Der vorletzte starke El Nino datiert von 1982.
Zur Zukunft:
So richtig häufig kommen die also nicht vor.
Ein moderater oder schwacher El Nino wird daher wohl keine Goldmedaille einbringen.
Richtig interessant wird es, falls ein starker El Nino auftreten sollte und trotzdem kein neuer Temperaturrekord aufgestellt wird.
Dies wäre ein Indiz dafür, dass das Temperaturplateau langsam abknickt, da Ozeanzyklen und Sonnenaktivität sich auf dem absteigenden Ast befinden.
Es wird spannend, denn dass ein El Nino irgendwann wieder einmal auftreten wird, ist kein Geheimnis.
Quelle/Source:
-
Die kalte Sonne (Fritz Vahrenholt, Sebastian Lüning)
2014-02-25 de Katastrophaler Focus-Artikel stellt die Klimawissenschaften auf den Kopf: Folgen für den seriösen Wissenschaftsjournalismus sind fatal
↑ d de Korrelationen mit El Niño & La Niña
▶Klima-Beobachtungen: Korrelationen mit El Niño & La Niña
| de | en | fr |
|---|---|---|
|
Klima: Wandel Klima-Beobachtungen Korrelationen mit der Sonne |
Climate: Change Climate Observations Correlations with the Sun |
Climat: Changement Observations sur le climat Corrélations avec le soleil |
↑ El Niño und der Ölpreis
-
Die kalte Sonne (Fritz Vahrenholt & Sebastian Lüning)
2018-08-04 de El Niño und der ÖlpreisEl Niño und der Ölpreis

 Die blaue Kurve zeigt El Niño (nach unten) und La Niña
(nach oben),
die orangene Kurve stellt den Rohölpreis dar.
Die Graphik deutet an, dass der Rohölpreis während El-Niño-Phasen zurückgeht.

Zur Wissenschaft gehört es, sich unvoreingenommen erst einmal Entwicklungen anzuschauen, bevor man dann in einem zweiten Schritt überlegt, ob es sich bei bestimmten Mustern um Zufälle oder eine bisher nicht vollständig verstandene Systematik handelt.
Dabei darf der erste Schritte gerne spielerisch ausfallen, denn wer nicht ausprobiert, kann auch nichts finden.
Die Welt der Klimawissenschaften mit ihrer großen Datenfülle und die Börsenwelt haben da sicher einiges gemeinsam. Robert Rethfeld gibt den Börsenbrief "Der Wellenreiter" heraus.
In der Frühausgabe vom 11. Juli 2018 hat er dabei eine interessante Einleitunggewählt, wobei er einfach mal die El-Niño Tätigkeit (ausgedrückt als ONI-Index) und den Rohölpreis zusammen aufgetragen hat:
Der Wellenreiter schreibt:
Die Stärke des Wetterphänomens El Niño und der Ölpreis korrelieren positiv miteinander.
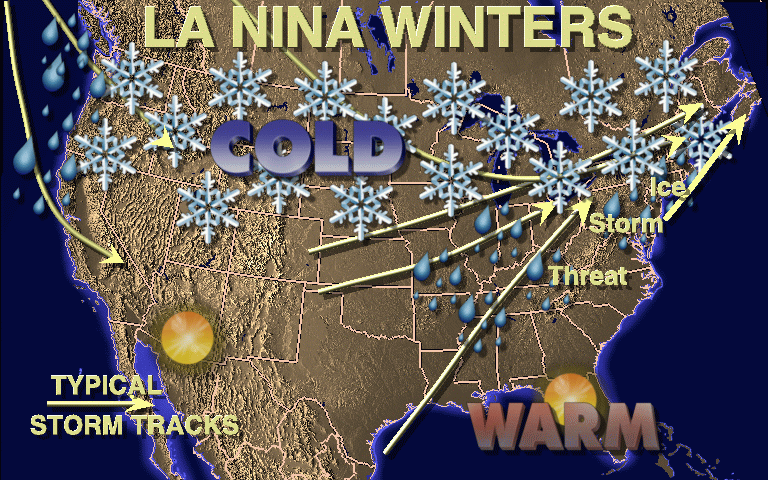
Heizt sich der pazifische Ozean stärker auf als normal (El Niño), hat dies überwiegend einen warmen US-Winter zur Folge.
Ein warmer US-Winter lässt die Nachfrage nach Erdöl sinken, der Preis fällt.
El Niño und sein Gegenpart La Niña sind weitgehend vorhersehbare Phänomene.
Die US-Wetterbehörde NOAA zeigt für das Jahr 2018 eine Entwicklung von La Niña zu El Niño (siehe Pfeil folgender Chart).
Die Wassertemperatur des Pazifiks steigt und bringt den USA aller Voraussicht nach einen warmen Winter 2018/19.
Die Erdölnachfrage müsste dadurch negativ beeinflusst werden, der Preis müsste fallen.
Aktuell sehen wir eine Verzögerung.
Der Ölpreis stieg in den vergangenen Monaten, obwohl der dargestellte Oceanic-Niño-Index (ONI) sich bereits seit Anfang 2018 in Richtung Süden bewegt.
Wir nehmen an, dass der Ölpreis letztendlich dieser Bewegung folgen und fallen wird.
Die positive Korrelation ist in der Tat beachtlich, und auch die Erklärung macht natürlich irgendwie Sinn.
Trotzdem bleibt es spekulatv, weil der Ölpreis letztendlich natürlich von einer Vielzahl von Faktoren abhängt.
Die Prognose des El Nino ist übrigens etwas schwieriger als suggeriert.
Ob jetzt wirklich ein neuer El Niño ins Haus steht?
Die NOAA sieht momentan neutrale ENSO-Bedingungen, hält aber einen El Niño im kommenden Nordhemisphären-Winter mit 70% Wahrscheinlichkeit für möglich.
Prognose vom 30. Juli 2018 als pdf hier.
Oder anders ausgedrückt: Könnte sein, aber nicht ganz sicher.
Warten wir es ab. Siehe auch den Artikel Strong El Niño helps reduce U.S. winter heating demand and fuel prices der US Energy Information Administration von 2016.
-
Wellenreiter Invest
2017-09-22 de La Nina unterstützt den Ölpreis
↑ CO2-Wachstumsrate & El Niño/La Niña
-
Die kalte Sonne (Fritz Vahrenholt & Sebastian Lüning)
2018-08-04 de El Niño und der ÖlpreisCO2-Wachstumsrate & El Niño/La Niña

 CO2-Wachstumsrate und
El Niño/La Niña.
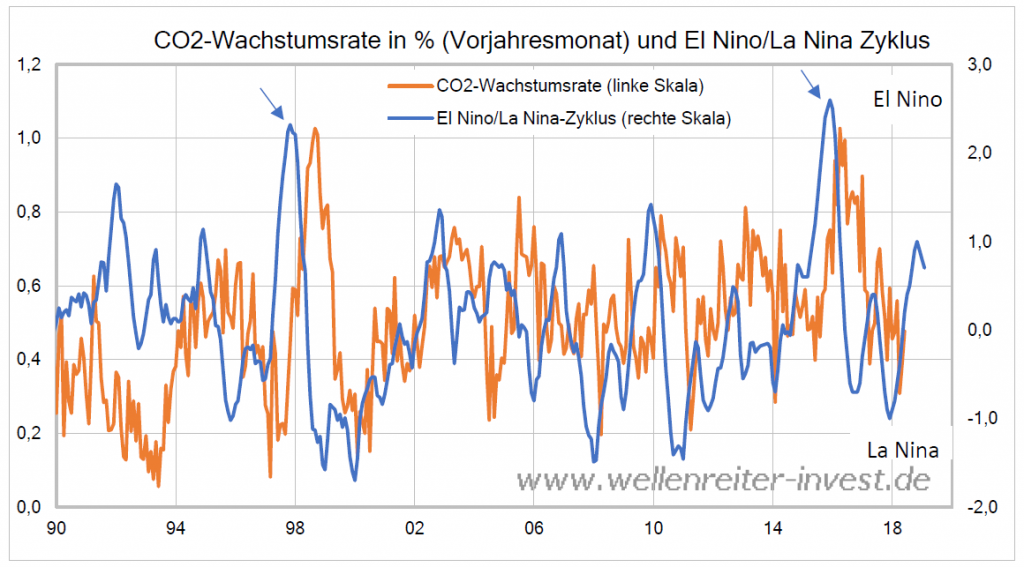
Der Wellenreiter schreibt dazu:
Der El Niño/La Niña-Zyklus (ONI) läuft der Entwicklung der CO2-Wachstumsrate voraus.
Dies ist auf dem obigen Chart gut zu erkennen (siehe auch die Pfeilmarkierungen).
Die Wachstumsrate des CO2-Ausstoßes folgt dem El Niño/La Niña-Zyklus und damit der Temperaturentwicklung.
Das bedeutet nicht, dass der Mensch keinen Einfluss auf die CO2-Entwicklung hat.
Aber die Feinsteuerung erfolgt durch den El Niño/La Niña-Zyklus.
-
Wellenreiter Invest
2016-10-11 de Dicke Luft
⇧ 2018
↑ Klimaschützer können auf steigende Temperatur hoffen!
-
Science Skeptical Blog / Michael Krueger
2018-11-17 de El Nino bahnt sich an. Klimaschützer können auf steigende Temperatur hoffen!Es deutet alles darauf hin, dass sich derzeit ein El Nino im Ost- und Zentralpazifik zur Jahreswende entwickelt und damit die Globaltemperatur wieder ansteigen lässt.
Der El Nino ist ein Wetterphänomen, welches warme Temperaturen im Pazifik mit sich bringt.
2015/16 bescherte ein El Nino uns neue Rekorde der Globaltemperatur.
Die Temperaturanomalie der NASA stieg auf 1°C seit 1880.
Mit Abklingen des El Nino ist sie wieder auf 0,8°C gefallen!
Seit einigen Monaten steigen die Temperaturen aufgrund der Wetterbedingungen im Pazifik wieder an.
Seit dem letzten Sommer ist dort ein Temperaturanstieg von 1°C zu verzeichnen.
In den nächsten Monaten ist infolge dessen mit einer steigenden Globaltemperatur zu rechnen.
Zur Freude der Klimaschützer.
Über den Rückgang der Globaltemperatur nach dem letzten El Nino wurde nicht berichtet, man hat sich statt dessen auf den warmen und trockenen Sommer in Deutschland konzentriert.
Sollte der nächste Sommer in Deutschland wieder kühler ausfallen, kann man sich erneut auf die steigende Globaltemperatur konzentrieren, als Beleg für den meschengemachten Klimawandel.
Ich wage mal die Prognose, dass das so geschehen wird.
Auch WetterOnline berichtet über den anstehenden El Nino.
In den nächsten Tagen stehen erst mal frostige Temperaturen in Deutschland an.
Die Kraniche fliehen vor der anstehenden Kälte schon nach Süden.
Und auch in den USA ist der Winter schon eingezogen.
Im Nordosten der USA herrschte gerade Schneechoas.
Bis zu 20 Zentimeter Neuschnee brachten die Autofahrer an der Ostküste an den Rand der Verzweiflung.
Grund dafür, die Nordatlantische Oszillation und die Arktische Oszillation, zwei Wettersysteme im hohen Norden, gehen gerade in eine negative Phase über, die kalte Temperaturen für uns und die Ostküste der USA mit sich bringen.
Kalte, polare Luft strömt dabei über Skandinavien zu uns nach Deutschland.
Und kalte, polare Luft über Kanada in den Osten der USA.
Auch hier würde ich mich nicht wundern, wenn in den nächsten Tagen die Medien berichten, auch das würde am menschengemachten Klimawandel liegen.
⇧ 2017
↑ El Ninos während der Kleinen Eiszeit intensiver und häufiger als in Warmperioden
-
Die kalte Sonne (Fritz Vahrenholt & Sebastian Lüning)
2017-10-20 de El Ninos während der Kleinen Eiszeit intensiver und häufiger als in Warmperioden
↑ University of Washington: Modelle können Einfluss des Klimawandels auf El Ninos nicht zuverlässig vorhersagen
-
Die kalte Sonne (Fritz Vahrenholt & Sebastian Lüning)
2017-02-27 de University of Washington: Modelle können Einfluss des Klimawandels auf El Ninos nicht zuverlässig vorhersagen
↑ Zwei Super-Christuskinder: El Nino 2015/16 erreichte ähnliche Stärke wie 1997/98
-
Die kalte Sonne (Fritz Vahrenholt & Sebastian Lüning)
2017-01-05 de Zwei Super-Christuskinder: El Nino 2015/16 erreichte ähnliche Stärke wie 1997/98
⇧ 2016
↑ fr El Niño L'enfant terrible du climat
-
Le Figaro
2016-01-28 de El Niño L'enfant terrible du climatCette année, l'épisode climatique risque d'être aussi catastrophique que celui de 1997-1998, qui avait fait 22.000 victimes et 33 milliards de dollars de pertes économiques.?
⇧ 2015
↑ Fachwelt ist sich einig: El Nino-Prognose bleibt schwierig. Das PIK hingegen spricht von einem "Durchbruch" der Vorhersagekunst
-
Die kalte Sonne (Fritz Vahrenholt & Sebastian Lüning)
2015-5-12 de Fachwelt ist sich einig: El Nino-Prognose bleibt schwierig. Das PIK hingegen spricht von einem "Durchbruch" der Vorhersagekunst
↑ Neue Studie aus Peru: El Nino lässt Kinder schrumpfen
-
Die kalte Sonne (Fritz Vahrenholt & Sebastian Lüning)
2015-01-04 de Neue Studie aus Peru: El Nino lässt Kinder schrumpfen
⇧ 2014
↑ Kein Trend in der El Nino-Entwicklung der letzten 150 Jahre: Klimamodelle mit zukünftigem Dauer-El Nino können die Vergangenheit nicht reproduzieren
-
Die kalte Sonne (Fritz Vahrenholt & Sebastian Lüning)
2014-06-24 de Kein Trend in der El Nino-Entwicklung der letzten 150 Jahre: Klimamodelle mit zukünftigem Dauer-El Nino können die Vergangenheit nicht reproduzieren
⇧ 2011
↑ Raimund Leistenschneider: La Niña und El Niño, was sich dahinter verbirgt und was sie, wann auslöst - Die Sonne ist an allem schuld
-
EIKE Europäisches Institut für Klima und Energie
Raimund Leistenschneider
2011-01-24 de La Niña und El Niño, was sich dahinter verbirgt und was sie, wann auslöst - Die Sonne ist an allem schuldDie Medien
In den vergangenen Tagen war viel in den Medien von katastrophalen Überschwemmungen in Brasilien und Australien zu hören, die zahlreiche Opfer unter der dortigen Bevölkerung forderten.
In den vergangenen Tagen war viel in den Medien von katastrophalen Überschwemmungen in Brasilien und Australien zu hören, die zahlreiche Opfer unter der dortigen Bevölkerung forderten.
Sie werden mit dem Wetter-/Klimaphänomen La Niña in Verbindung gebracht.
Natürliche, durch die Sonne unmittelbar ausgelöste Wetterereignisse
Der Bericht zeigt auf, dass es sich dabei um natürliche, durch die Sonne unmittelbar ausgelöste Wetterereignisse handelt und dass die Medien, wieder einmal, in ihrer Berichterstattung mit Superlativen wie z.B. Jahrhunderthochwasser, stark übertreiben.
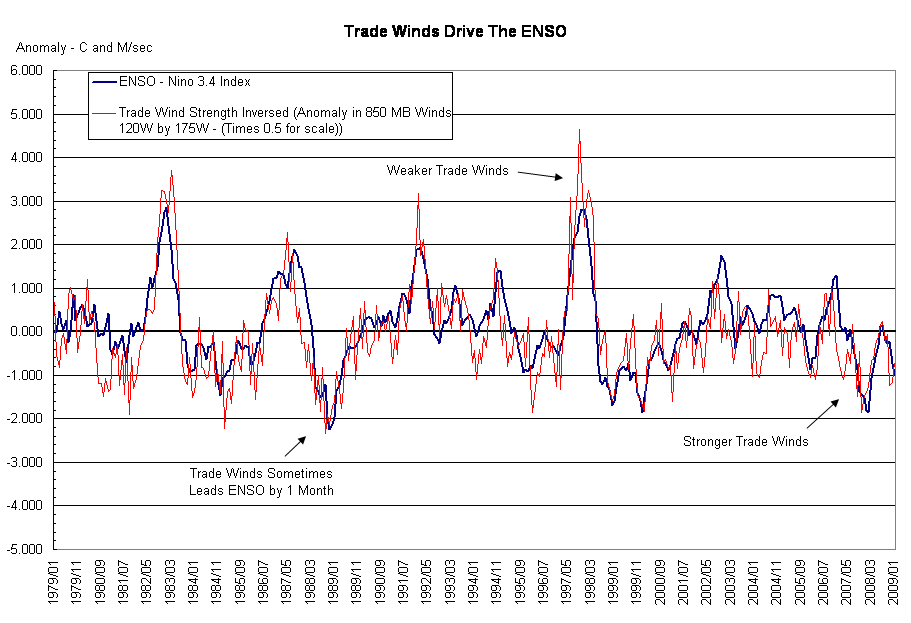
La Niña, was übersetzt "das Mädchen" bedeutet und El Niño ("der Knabe"), basieren auf einer Änderung der Passatwinde im pazifischen Tropengürtel.
Während bei einem El Niño die Passatwinde abflauen und dadurch die Wind- und Wasserzirkulation zusammenbricht, verstärken sich bei einem La Niña die Passatwinde und treiben sozusagen pazifisches Oberflächenwasser vor sich her, wodurch das warme Wasser vor die Küste Indonesiens getrieben wird und kaltes Wasser von der Küste Perus nachströmt.
Dieses Wasser ist bis zu 3°C kälter als der Durchschnitt (Langfristmittel).
Dies führt zu mehr Niederschlägen im Westpazifik, so auch in Australien.
| Raimund Leistenschneider |
Physiker
▶Raimund Leistenschneider: Who is who (Skeptiker) |
⇧ 1998
↑ Dr. Theodor Landscheidt: Solar Activity Controls El Niño and La Niña
-
Dr. Theodor Landscheidt
1999-01-11 en Solar Activity Controls El Niño and La Niña
Dr Theodor Landscheidt
Schroeter Institute for Research in Cycles of Solar Activity Nova Scotia, Canada
1. Forecast of ENSO events
Anomalous warming (El Niño) or cooling (La Niña) of surface water in the eastern equatorial Pacific occurs at
irregular intervals between 2 and 7 years
in conjunction with the Southern Oscillation,
a massive seesawing of atmospheric pressure between the southeastern and the western tropical Pacific.
---
2. 11-year sunspot cycle and the Golden section
The 11-year sunspot cycle meets these conditions of external forcing.
Yet climatologists who exclusively consider the change in the sun's irradiance solely look at maxima and minima of the sunspot cycle.
...
12. Objections to a strong link between solar activity and climate
...
Hansen [NASA/GISS] does not even mention the effect of solar eruptions and the solar wind on climate.
H. Svensmark and E. Friis-Christensen have demonstrated that this is in accordance with reality.
Clouds have a hundred times stronger effect on weather and climate than carbon dioxide in the atmosphere.
▶Landscheidt (2002-03-18): El Niño Forecast Revisited
|
Theodor Landscheidt *1927-03-10 †2004-05-19 |
Dr., Schroeter Institute for Research in Cycles of Solar Activity,
Nova Scotia, Canada
▶Theodor Landscheidt: Who is who (Skeptiker) ►Klima Analysen: Theodor Landscheidt |
⇧ 4 ENSO: El Niño-Southern Oscillation
Mit folgenden Links wird von anderen Webseiten auf diese Seite verwiesen:
▶ENSO: El Niño‑Southern Oscillation
Links zur Klimaschau
|
|
▶El Niño (der Knabe/warm) & La Niña (das Mädchen/kalt) ▶ENSO: El Niño‑Southern Oscillation |
| Siehe auch: | ▶El Niño (der Knabe/warm) & La Niña (das Mädchen/kalt) |
⇧ de Verzeichnis en Contents fr Sommaire
- a Wissenschaftlich begutachtete Studie erschüttert erneut offizielle Klimadoktrin!
- b Dr. Horst Borchert: Südpazifische Oszillation (SO) und Kosmische Strahlung
- c The Trade Winds (Passatwinde/Alizé) Drive The ENSO
- d Welche Rolle spielen Treibhausgase ?
⇧ de Allgemein en General fr Générale
| ENSO | = |
de
El Niño-Southern Oscillation en El Niño-Southern Oscillation fr El Niño (ENSO El Niño-Southern Oscillation) |
⇧ de Text en Text fr Texte
↑
a Wissenschaftlich begutachtete Studie erschüttert erneut offizielle
Klimadoktrin!
en Influence of the Southern Oscillation on tropospheric temperature
-
EIKE Europäisches Institut für Klima und Energie
2010-08-30 de Wissenschaftlich begutachtete Studie erschüttert erneut offizielle Klimadoktrin! 'Die Natur, nicht der Mensch, ist für die jüngste globale Erwärmung verantwortlich!'Drei australische Forscher haben in einer kürzlich veröffentlichten Studie im hoch angesehenen Journal of Geophysical Research gezeigt, dass der dominante Einfluss auf das Klima von natürlichen Kräften ausgeht. Nach dieser Studie kann man nur einen geringen oder gar keinen Beitrag zu Erwärmung und Abkühlung des späten 20. Jahrhunderts durch menschliche Aktivitäten erkennen.
Die Forschungen von Chris de Freitas, einem Klimawissenschaftler an der Universität von Auckland, Neuseeland, John McLean (Melbourne) und Bob Carter (James Cook Universität) ergaben, dass die El Niño-Southern Oscillation (ENSO) ein Schlüsselindikator für die Temperaturentwicklung sieben Monate später ist.
-
The New Zealand Climate Science Coalition
2009-01-20 en Three Australian Scientists find AGW Link to Southern Oscillation
A study by three Australasian researchers published 23 July in the highly regarded Journal of Geophysical Research shows that most of the late 20th century global warming and cooling can be attributed to natural climate processes.
The research by Chris de Freitas (University of Auckland, New Zealand), John McLean (Melbourne) and Bob Carter (James Cook University, Australia) finds that the Southern Oscillation is a key indicator of global atmospheric temperatures seven months later. -
en
 Compelling new research shows nature rules climate
A study by three Australasian researchers published 23 July 2009 in the highly regarded "Journal of Geophysical Research" shows that most of the late 20th century global warming and cooling can be attributed to natural climate processes.
The research, by Chris de Freitas (University of Auckland, New Zealand), John McLean (Melbourne) and Bob Carter (James Cook University, Australia), finds that the Southern Oscillation is a key indicator of global atmospheric temperatures seven months later.
Climate researchers have long been aware that El Niño-Southern Oscillation (ENSO) events influence global temperature, such as causing a high temperature spike in 1998 and a subsequent fall as conditions moved to La Niña.
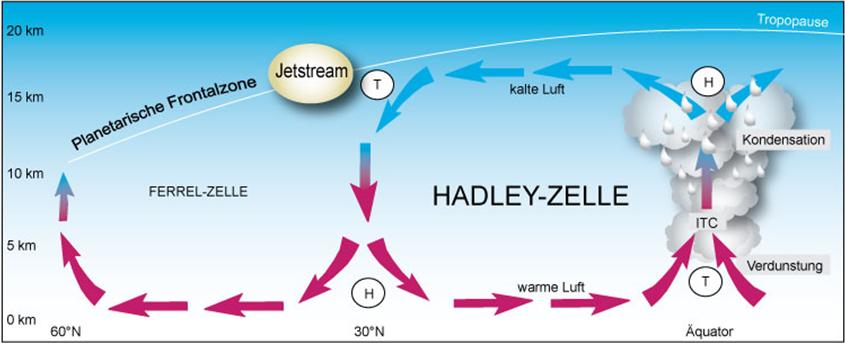
According to the three researchers, ENSO-related warming during El Niño conditions is caused by a stronger Hadley Cell circulation moving warm tropical air into the mid-latitudes.
During La Niña conditions the Pacific Ocean is cooler and the Walker circulation, west to east in the upper atmosphere along the equator, dominates. It is also well known that volcanic activity has a cooling influence.
-
JGR Journal of Geophysical Research
Chris de Freitas, John McLean, Bob Carter
2009-07-23 en Influence of the Southern Oscillation on tropospheric temperature
↑ b Dr. Horst Borchert: Südpazifische Oszillation (SO) und Kosmische Strahlung
|
Südpazifischen Oszillation und kosmischen Strahlung
Eine Gegenüberstellung der um 30 Monate zeitverzögerten gleitenden 3 Jahresmittel der Südpazifischen Oszillation und der durch die Sonnenaktivität modulierten kosmischen Strahlung zeigt in Abb. 4d eine gute Übereinstimmung im periodischen Verlauf von 1980 bis 2008 und weist auf die extraterrestrische Beeinflussung der La Nina - El Nino Perioden hin.
|
de Kurzfassung
Vergleichbar mit den Untersuchungsergebnissen der Nordatlantischen Oszillation (NAO) wird auch die Südpazifische Oszillation (SO) durch Sonnenaktivität beeinflusst:
Während der Wärmeperiode ab 1980 wird eine Resonanz zwischen den Periodizitäten der Sonnenfleckenhäufigkeit in der 22. und 23. Sonnenfleckenperiode und des Sonnenwindindex "aa" mit der zeitverzögerten Südpazifischen Oszillation beobachtet.
Auch die durch die Magnetfelder der Sonnenwinde ausgelösten Periodizitäten der Kosmischen Strahlung sind in diesem Zeitraum mit der zeitverzögerten Südpazifische Oszillation (SO) in Resonanz (K=0,8).
Das führt zu solar gesteuerter Bewölkungsreduktion durch den Svensmark-Effekt und dadurch zu verstärkter Sonneneinstrahlung.
Es erfolgt so ein zusätzlicher Temperaturanstieg und eine zusätzliche Erwärmung des Ozeans in der südlichen Hemisphäre.
Diese solar bewirkte Meereserwärmung führt zur Emission von gelöstem CO2, was als Zusatzdüngung der Weltflora dient.
Eine Temperaturerhöhung durch CO2 lässt sich aus den Messwerten nicht ableiten.
Mit Beendigung der Sonnenaktivität im Dezember 2006 hat auch in der südlichen Hemisphäre eine kalte Wetterperiode begonnen.
en Abstract
It was found that the South Pacific Oscillation (SO) is influenced by Sun activity similar to the North Atlantic Oscillation (NAO).
Especially during the warming period from 1980 to 2009 the oscillation of Sunwind - Index "aa" was in good resonance with the delayed South Pacific Oscillation.
The same observation was found between the Oscillation of Cosmic Radiation, which is controlled by the Forbush - Reduction by the magnetic fields of the sun protons of the Sunwind and the delayed SO (K=0,8).
The consequence of this observations is the postulation, that the increase of global temperature in the Southern Hemisphere was caused by sun activity with strong emissions of Proton-rays in Earth's direction during the 22. and 23. Sunspot-Periods reducing Cosmic Rays with the consequence of reduction of cloudiness, increasing global rays and warming up the lower atmosphere (Svensmark - Effect).
As a consequence resolved CO2 was continuously emitted from the slowly warming up Ocean giving a good fertilizer of the flora of the world.
A relevance of CO2 concerning Climate Change could not be found.
With the end of Sun activity in 2006 a cold weather period has started in the Southern Hemisphere too.
|
Horst Borchert †2015-11-11 |
Dr. Dipl. Physiker,
Physikdirektor a. D. Lehrbeauftragter am Geographischen Institut der
Johannes Gutenberg-Universität Mainz, i.R.;
Beiratsmitglied von EIKE
▶Horst Borchert: Who is who (Skeptiker) ▶Horst Borchert: Präsentationen (Artikel & Vorträge) ▶Horst Borchert: Video (Präsentationen) |
↑ c The Trade Winds (Passatwinde/Alizé) Drive The ENSO
-
Watts Up With That? (Anthony Watts)
2009-02-17 en The Trade Winds Drive The ENSO
↑ d Welche Rolle spielen Treibhausgase ?
-
EIKE Europäisches Institut für Klima und Energie
2012-04-02 de Welche Rolle spielen Treibhausgase? Teil 1 Teil 2
2010-04-06 de Die Lüge über die Treibhausgase
Zitat des früheren Präsidenten der Max Planck Gesellschaft, Prof. Dr. Hubert Markl:
"Es ist nicht zu bestreiten, dass es auch in der Wissenschaft - häufiger als uns Wissenschaftlern lieb ist - Lug und Trug gibt, nicht nur fahrlässige Schlamperei, sondern wirklich absichtlichen Betrug."
⇧
5 AMO: Atlantische Multidekaden-Oszillation
en Atlantic multidecadal oscillation
fr Oscillation atlantique multidécennale
Mit folgenden Links wird von anderen Webseiten auf diese Seite verwiesen:
▶AMO: Atlantische Multidekaden-Oszillation
Links zur Klimaschau
|
|
▶AMO: Atlantische Multidekaden-Oszillation |
- 2019
- de
AMO-Zyklus auf dem absteigenden Ast:
Rotes Meer wird sich in den kommenden Jahrzehnten wohl abkühlen
en Natural Climate Oscillations may Counteract Red Sea Warming Over the Coming Decades - 2018
- de US-Atmosphärenforscher warnt davor, die kalifornischen Waldbrände reflexhaft dem Klimawandel anzulasten
- 2017
- en
Correlation of Accumulated Cyclone Energy and Atlantic Multidecadal
Oscillations
Mittelfristig lässt sich die Hurrikanaktivität ganz gut vorhersagen, denn sie ist eng an den AMO-Ozeanzyklus gekoppelt, die Atlantische Multidekadenoszillation, die eine Periodizität von 60 Jahren besitzt. - de Trends der ozeanischen Zyklen und langfristige Veränderungen der Lufttemperaturen in Europa
- 2016
- de Die Sonne im Juli 2016 und die Sache mit der AMO
- 2015
- de Atlantikwellen
- 2012
- de
Munich Re rührt wieder kräftig die Werbetrommel für Sturm- und
Dürreversicherungen
Die atlantische Hurrikan-Aktivität (ACE) der vergangenen 60 Jahre verlief parallel zur Entwicklung der Atlantisch Multidekaden Oszillation (AMO).
| AMO | = |
de
Atlantische Multidekaden-Oszillation en Atlantic multidecadal oscillation fr Oscillation atlantique multidécennale |
↑ 2019
↑
AMO-Zyklus auf dem absteigenden Ast:
Rotes Meer wird sich in den kommenden Jahrzehnten wohl abkühlen
en
Natural Climate Oscillations may Counteract Red Sea Warming Over the
Coming Decades
![]()
![]() Temperaturentwicklung des Roten Meeres
Temperaturentwicklung des Roten Meeres

-
Die kalte Sonne (Fritz Vahrenholt & Sebastian Lüning)
2019-07-07 de AMO-Zyklus auf dem absteigenden Ast: Rotes Meer wird sich in den kommenden Jahrzehnten wohl abkühlenVor sieben Jahren schlugen wir in unserem Buch "Die kalte Sonne" vor, Ozeanzyklen für Mittelfristprognosen einzusetzen.
Das Klimaestablishment war damals strikt dagegen.
Heute haben sich die Zeiten zum Glück geändert.
Ein Team um George Krokos analysierte am 15. März 2019 in den Geophysical Research Letters die Temperaturentwicklung des Roten Meeres, welches sich in den letzten Jahrzehnten spürbar erwärmt hat.
Die Forscher setzten dies in den Langfrist-Kontext und erkannten eine starke Korrelation mit dem 70-jährigen Ozeanzyklus der AMO (Atlantischen Multidekadenoszillation).
Da die AMO nun ihren Scheitelpunkt erreicht hat, erwarten Krokos und Kollegen nun eine Abkühlung des Roten Meeres in den kommenden drei Jahrzehnten.
Hier der Abstract des Papers:
-
Geophysical Research Letters
2019-03-15 en Natural Climate Oscillations may Counteract Red Sea Warming Over the Coming DecadesAbstract
Recent reports of warming trends in the Red Sea raise concerns about the response of the basin's fragile ecosystem under an increasingly warming climate.
Using a variety of available Sea Surface Temperature (SST) data sets, we investigate the evolution of Red Sea SST in relation to natural climate variability.
Analysis of long-term SST data sets reveals a sequence of alternating positive and negative trends, with similar amplitudes and a periodicity of nearly 70 years associated with the Atlantic Multidecadal Oscillation.
High warming rates reported recently appear to be a combined effect of global warming and a positive phase of natural SST oscillations.
Over the next decades, the SST trend in the Red Sea purely related to global warming is expected to be counteracted by the cooling Atlantic Multidecadal Oscillation phase.
Regardless of the current positive trends, projections incorporating long-term natural oscillations suggest a possible decreasing effect on SST in the near future.
|
|
AMO-Zyklus auf dem absteigenden Ast: Rotes Meer wird sich in den kommenden Jahrzehnten wohl abkühlen Ozeanzyklen: AMO-Atlantische Multidekaden-Oszillation, Ozeanzyklen steuern das Klima |
↑ 2018
↑ US-Atmosphärenforscher warnt davor, die kalifornischen Waldbrände reflexhaft dem Klimawandel anzulasten
-
Die kalte Sonne (Fritz Vahrenholt & Sebastian Lüning)
2018-11-19 de US-Atmosphärenforscher warnt davor, die kalifornischen Waldbrände reflexhaft dem Klimawandel anzulastende Fakten en Facts fr Faits
Einiger Aussagen
Die Gesamtzahl aller Feuer in Kalifornien hat überhaupt nicht zugenommen; die Zahl der großen, verheerenden Feuer aber sehr wohl.
Von den 20 größten je dokumentierten Feuern in Kalifornien brannten 15 in diesem Jahrtausend.
Ich sehe zweierlei Ursachen:
Zum einen sind da die wärmeren, trockeneren Klimabedingungen, vor allem im Norden Kaliforniens.Besonders wichtig ist dabei, dass die nächtlichen Temperaturen gestiegen sind.
Der andere Punkt ist, dass wir über viele Jahre hin erfolgreich Feuer verhindert haben.
Das klingt zwar erfreulich, aber es führt gleichzeitig dazu, dass sich immer mehr Brennstoff angesammelt hat.
In der Feuerökologie gilt die Grundregel:
Klima ermöglicht Feuer, Wetter facht es an.Mit anderen Worten:
Ja, wenn es wärmer und trockener wird - und das beobachten wir in Kalifornien -, dann bedeutet das erhöhte Feuergefahr.Ich zögere trotzdem zu sagen:
"Der Klimawandel verursacht diese großen, zerstörerischen Feuer."
Wir dürfen die anderen, mindestens ebenso wichtigen Faktoren nicht außer Acht lassen:
dass es in der Vergangenheit eine Form der Brandvorsorge gegeben hat, die wir überdenken sollten; und dass die Menschen ihre Häuser an ebenjenen Orten bauen, wo die Gefahr besonders groß ist.
Die Menschen wollen raus aus den Städten, und sie dringen dabei immer weiter vor in die Übergangszone zwischen Stadt und Wildnis.
Wer aber sein Eigenheim an einem Platz inmitten einer Vegetation errichtet, die alljährlich austrocknet, der riskiert, dass es irgendwann in Flammen aufgeht.
Sollte das bei der Siedlungsplanung besser berücksichtigt werden?
Brown: Unbedingt! Denn nachträglicher Feuerschutz von Häusern, nachdem sie einmal gebaut sind, kann sehr teuer werden. Ungefähr zwei Millionen Häuser in Kalifornien stehen in Gegenden mit hoher Brandgefahr.
de Panik-Küche en Panic laboratory fr Marmite alarmiste
Ist das der Klimawandel? "Ich denke schon", sagt Mojib Latif
Ist das der Klimawandel? "Ich denke schon", sagt Mojib Latif, einer der wichtigsten Klimaforscher in Deutschland, Professor am Helmholtz-Zentrum für Ozeanforschung Kiel.
"Das ist mit Sicherheit der Klimawandel", sagt Johann Georg Goldammer, Feuerökologe und Gründer des Global Fire Monitoring Centers Freiburg.
Die Zeit der Zweifel scheint vorbei.
Bei der Dürre in Kalifornien und den Bränden, die sich immer häufiger dort entwickeln, handelt es sich vermutlich eben nicht mehr um Einzelereignisse, sagt Mojib Latif.
Der Klimaforscher war für seine Arbeit oft in Kalifornien.
Er kennt die Landschaften und das Klima aus eigener Anschauung seit mehr als zwanzig Jahren.
Er weiß, dass regelmäßige Brände in Kalifornien natürlich sind, manche Bäume dort sogar Feuer brauchen, um sich fortzupflanzen.
Latif kennt auch die wissenschaftlichen Daten über das Klima der Region.
Aus diesen Daten könne man das Klima Kaliforniens seit dem Jahr 800 rekonstruieren, sagt er.
"Seit Jahrzehnten ist es in Kalifornien sehr trocken. Das ist in mehr als 1200 Jahren einmalig."
Das Mojib-Orakel hat gesprochen.
Es muss wohl der Klimwandel gewesen sein. Oder vielleicht doch nicht?
Mojib Latif Dr. rer. nat., Professor für Meteorologie am Leibniz-Institut für Meereswissenschaften (IFM-GEOMAR) an der Universität Kiel.
▶Mojib Latif: Who is who (Aktivisten der anthropogenen Erwärmung)de Selbst Beurteilen! en Judge yourself! fr Jugez vous-même!
Die Autoren berichten über schlimme Dürreserien während der Mittelalterlichen Wärmeperioden, die zum Aussterben von ganzen Indianerkulturen geführt hat.
Benson et al. 2007 erwähnen sogar Gründe für die vorindustriellen Dürreserien.
Die treten in der Region vor allem während Minima des PDO-Ozeanzyklus sowie während positiven Phasen des AMO-Ozeanzyklus auf.
So war es jedenfalls vor 1000 Jahren.
Ein guter Hinweis.
Wir schauen nach, in welcher Phase die PDO und AMO gerade schwingen.
Als erstes die PDO, die Pazifische Dekadenoszillation (Abb. 1).
Sie befindet sich gerade in einem Minimum, wie unschwer zu sehen ist.
Das fördert Dürren in Kalifornien.

 Verlauf der PDO während der letzten 120 Jahre
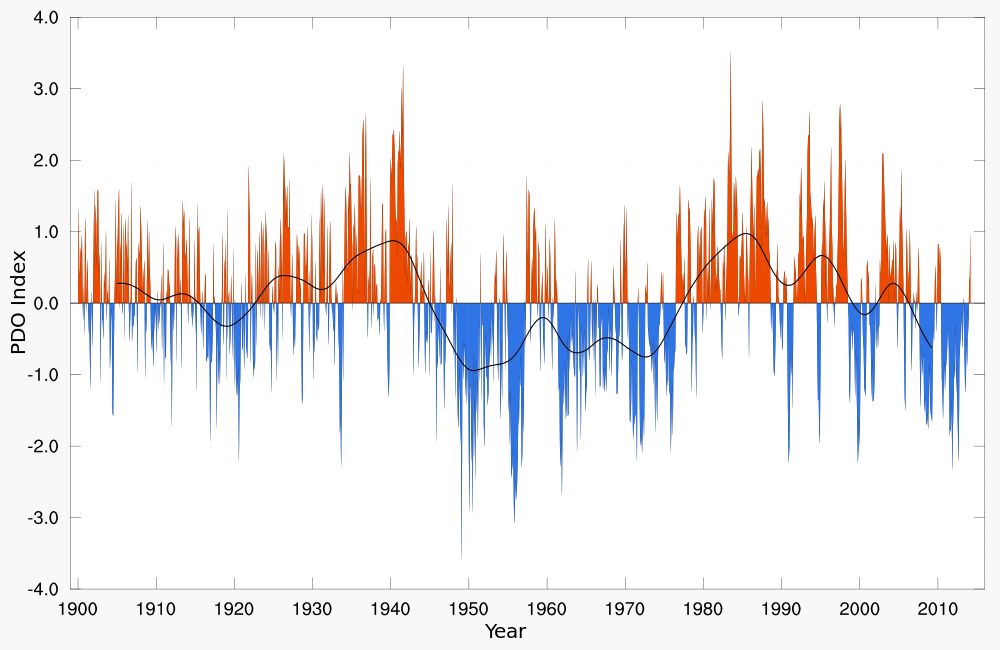
▶PDO: Pazifische Dekaden‑Oszillation
Und jetzt der zweite Ozeanzyklus, die AMO, Atlantische Multidekadenoszillation (Abb. 2).
Wir befinden uns in einer positien Phase, genau wie vor 1000 Jahren,
als es schon einmal so viele Dürren gegeben hat.

 Entwicklung der AMO während der letzten 130 Jahre.

▶AMO: Atlantische Multidekaden‑Oszillation
Fazit:
Wieder einmal führt Latif sein Publikum hinters Licht.
Anstatt die gut bekannten Zusammenhänge zwischen Ozeanzyklen und Regenmengen an der US-Westküste zu erläutern, erklärt er die Heutezeit einfach zur Sonderzone.
Das ist umso erstaunlicher, weil Latif früher selber über die Ozeanzyklen publiziert hat.
Nun stehen sie ihm und seinem lukrativen Klimaaktivismus im Weg, so dass er sie einfach verleugnet.
Aber der Welt-Artikel fängt an der Stelle erst an.
Wiebke und Céline lassen sich sogleich von der Münchener Rück den zweiten Bären aufbinden:
Die Rückversicherungsgesellschaft Munich Re erhebt und analysiert seit den 1970er-Jahren Daten über Brände in Kalifornien: über die Schadenssummen nach einer Saison.
Lange seien es zwei, drei, vier Milliarden Dollar im Jahr gewesen, sagt Ernst Rauch, leitender Klima- und Geowissenschaftler bei Munich Re.
"Das Jahr 2017 hat die bisherigen Dimensionen gesprengt.
Die Landschaftsbrände verursachten gesamtwirtschaftliche Schäden von fast 18 Milliarden Dollar."
Für 2018 gibt es noch keine abschließenden Zahlen.
Aber es sehe leider so aus, meint Rauch, als sei 2017 keine einsame Ausnahme gewesen.
Was Ernst Rauch verschweigt:
Die versichterten Werte sind in den letzten Jahrzehnten natürlich ebenfalls gestiegen.
Berücksichtig man dies, so sieht die Situation gänzlich anders aus.
Siehe: Neue Arbeit von Roger Pielke Jr.:
Anstieg der globalen Extremwetterversicherungsschäden basiert fast vollständig auf sozioökonomischen Gründen.
Die Welt sollte den Autoren vielleicht doch wieder mehr Zeit zur Recherche geben.
Momentan sieht es so aus, als wenn man den Reportern fast alles in den Block diktieren kann.
Ein bisschen Mitdenken bzw. naturwissenschaftliche Grundkenntnisse wären vielleicht vorteilhaft...
Das gilt nicht nur für Wiebke Hollersen (Studium der Publizistik, Politikwissenschaft, Neueren Geschichte an der FU Berlin) und Céline Lauer (Studium der Europäischen Ethnologie und Sozialwissenschaften an der Humboldt-Universität zu Berlin).
de en fr Who is who
VersicherungenWho is who
InsurancesQui est qui
Assurances
↑ 2017
↑ en Correlation of Accumulated Cyclone Energy and Atlantic Multidecadal Oscillations
Mittelfristig lässt sich die Hurrikanaktivität ganz gut vorhersagen, denn sie ist eng an den AMO-Ozeanzyklus gekoppelt, die Atlantische Multidekadenoszillation, die eine Periodizität von 60 Jahren besitzt.
Michel de Rougemont erinnerte daran in einem Aufsatz in WUWT.
-
Watts UP With That? (Antony Watts) / Michel de Rougemont
2017-09-04 en Correlation of Accumulated Cyclone Energy and Atlantic Multidecadal OscillationsVarious sources, scientists publishing their opinion in the media, claim that Tropical Storm Harvey, recently landed in Texas, is one more signal of the influence of global warming on such catastrophic events.
These claims are based on model calculations.
Let's examine the facts.

 In the Atlantic Ocean, sea surface temperature oscillations are
observed as a multidecadal cycle (AMO).


 The total energy accumulated each year by tropical storms and
hurricanes (ACE) is also showing such a cyclic pattern.


 A correlation between ACE and AMO is confirmed by regression
analysis.

↑ Trends der ozeanischen Zyklen und langfristige Veränderungen der Lufttemperaturen in Europa
![]()
![]() Verlauf von AMO/PDO-Index,
Lufttemperaturen in Genf
Verlauf von AMO/PDO-Index,
Lufttemperaturen in Genf

-
Die kalte Sonne (Fritz Vahrenholt & Sebastian Lüning)
Dr. Hans-J. Dammschneider (IFHGK, Schweiz)
2017-01-31 de Trends der ozeanischen Zyklen und langfristige Veränderungen der Lufttemperaturen in Europa
↑ 2016
↑ Die Sonne im Juli 2016 und die Sache mit der AMO
-
Die kalte Sonne (Fritz Vahrenholt & Sebastian Lüning)
Frank Bosse und Fritz Vahrenholt
2016-08-07 de Die Sonne im Juli 2016 und die Sache mit der AMOUnsere einzig relevante Energiequelle im Zentrum des Sonnensystems war im Juli auch für die Verhältnisse des Solaren Zyklus (SC) 24 unterdurchschnittlich aktiv.
Die Sache mit der AMO
Die AMO beeinflusst u.a. das Hurrican- Geschehen und die Temperaturen in der warmen Jahreszeit auch hierzulande.
Ja, Sie haben richtig gelesen: Wie warm unsere Sommer sind wird recht weitgehend auch von der Oszillation bestimmt.
Ein Blick auf die Landtemperaturen Westeuropas zeigt dies recht plastisch:
Deutlich ist ein Peak um 1950 zu erkennen,
danach fallen die Temperaturen bis zu einer Delle um 1970
und steigen wie die AMO nach 1990 wieder an mit einem Maximum um 2005.
Danach wurden die Sommer wieder kühler, dem Verlauf der AMO entsprechend.
Dass unser gegenwärtiger Sommer also nicht so warm ist wie die zu Beginn des Jahrtausends kann Sie nun nicht mehr überraschen, als AMO- Auskenner!
↑ 2015
↑ Atlantikwellen
-
Die kalte Sonne (Fritz Vahrenholt & Sebastian Lüning)
Frank Bosse und Fritz Vahrenholt
2015-06-11 de Die Sonne im Mai 2014 und Atlantikwellen
-
Nature
2015-05-27 en Ocean impact on decadal Atlantic climate variability revealed by sea-level observations
↑ 2012
↑ Munich Re rührt wieder kräftig die Werbetrommel für Sturm- und Dürreversicherungen
|
|
|
| de | en | fr |
|---|---|---|
|
Wetterphänomene Hurrikan |
Weather phenomena Hurricane |
Phénomènes météorologiques Ouragan |
⇧
6 NAO: Nordatlantische Oszillation
en North Atlantic Oscillation
fr Oscillation nord-atlantique
Mit folgenden Links wird von anderen Webseiten auf diese Seite verwiesen:
▶NAO: Nordatlantische Oszillation
Links zur Klimaschau
|
|
▶NAO: Nordatlantische Oszillation |
- a
de
Neue Finnische Studie belegt Kopplung zwischen Sonne und NAO sowie
NAO und Temperatur
en New Finnish Study Confirms Coupling Between Sun and NAO, NAO and Temperature - b
de
Sonne übt starken Einfluss auf die Nordatlantische Oszillation (NAO) aus
en Trends in sunspots and North Atlantic sea level pressure - c
de
Die Nordatlantische Oszillation beeinflusste die Arktis und Nordeuropa
während der letzten 5000 Jahre in systematischer Weise
en New paper shows how natural variability controls North Atlantic climate
| NAO | = |
de
Nordatlantische Oszillation en North Atlantic oscillation fr Oscillation nord-atlantique |
↑
a Neue Finnische Studie belegt Kopplung zwischen Sonne und NAO sowie
NAO und Temperatur
en
New Finnish Study Confirms Coupling Between Sun and NAO, NAO and
Temperature
-
Die kalte Sonne (Fritz Vahrenholt, Sebastian Lüning)
2012-04-17 de Neue Finnische Studie belegt Kopplung zwischen Sonne und NAO sowie NAO und TemperaturDie finnischen Forscher Samuli Helama und Jari Holopainen haben jetzt die Frühlings-Temperaturentwicklung der vergangenen 260 Jahre für Südwest-Finnland statistisch auf Korrelationen hin untersucht und geprüft, ob es Anzeichen für die Beteiligung solarer Aktivitätsschwankungen und ozeanischer Zyklen gibt.
Die Wissenschaftler fanden, dass die Temperatur stark an die Nordatlantische Oszillation (NAO) gekoppelt war, die im Prinzip den Luftdruck-Unterschied zwischen dem Islandtief und dem Azorenhoch darstellt.
Dies betrifft vor allem die letzten 160 Jahre, wobei die Luftdruck-Messdaten zur Rekonstruktion der NAO aus der Zeit vor 1850 möglicherweise nicht zuverlässig sind, schreiben die Autoren.
-
NoTricksZone (Pierre L. Gosselin)
2018-04-18 en More Reconstructions Show Climate Is Natural (And That IPCC Climate Models Are Rubbish)No. 2
New Finnish Study Confirms Coupling Between Sun and NAO, NAO and TemperatureTranslated/edited by P. Gosselin
Quelle / Source:
-
SciVerse/ScienceDirect
2012-04-01 en Spring temperature variability relative to the North Atlantic Oscillation and sunspots - A correlation analysis with a Monte Carlo implementationHighlights
-
We evaluate the role of external and internal forcings in temperature variability.
-
We examine scales appropriate for solar and atmospheric oscillations.
-
North Atlantic Oscillation drives the spring temperature variability.
-
Solar forcing modulates the North Atlantic Oscillation in spring.
-
Solar forcing on temperatures may have been augmented by the atmospheric pathway.
-
↑
b Sonne übt starken Einfluss auf die Nordatlantische Oszillation
(NAO) aus
en Spring temperature variability relative to the
North Atlantic Oscillation and sunspots - A correlation analysis with a
Monte Carlo implementation
-
Die kalte Sonne (Fritz Vahrenholt, Sebastian Lüning)
2012-05-06 de Sonne übt starken Einfluss auf die Nordatlantische Oszillation (NAO) aus: Neue Studie im Journal of Geophysical ResearchDie Nordatlantische Oszillation (NAO) ist ein bedeutender Ozeanzyklus der den Luftdruck-Unterschied zwischen dem Islandtief und dem Azorenhoch darstellt und das Klimageschehen im Nordatlantik und Mitteleuropa signifikant prägt.
Neben kurzfristigen Schwankungen im Bereich von 2 bis 5 Jahren besitzt die NAO noch überlagerte Oszillationen im Rhythmus von 12 bis 15 Jahren (Dekaden-Oszillation) und etwa 70 Jahren.
Die NAO stieg zwischen 1970 und 1990 stark an und hat wohl - neben anderen Faktoren - einen gewissen Beitrag zur Klimaerwärmung des späten 20. Jahrhunderts geliefert.
Seit 1990 befindet sich die NAO im Abschwung und könnte mit ein Grund für die stagnierenden globalen Temperaturen seit 2000 sein.
Der Kieler Klimaforscher Mojib Latif und sein Team prognostizierten 2008 aufgrund des Abfallens eines NAO-verwandten Zyklus, dass die globalen Temperaturen bis 2015 nicht weiter ansteigen würden.
Etliche Studien konnten zeigen, dass die NAO von der Sonnenaktivität in komplexer Weise beeinflusst wird.
-
SciVerse/ScienceDirect
2012-04-01 en Trends in sunspots and North Atlantic sea level pressureKey Points
-
The NAO was stronger and the baroclinity steeper in 1878-1944 than in 1944-2008.
-
Long-term trends in the NAO Index are linked to the trend in sunspot number.
-
Solar activity relates to North Atlantic Ocean and atmosphere trends.
-
↑
c Die Nordatlantische Oszillation beeinflusste die Arktis und Nordeuropa
während der letzten 5000 Jahre in systematischer Weise
en
New paper shows how natural variability controls North Atlantic climate
-
Die kalte Sonne (Fritz Vahrenholt, Sebastian Lüning)
2012-09-26 de Die Nordatlantische Oszillation beeinflusste die Arktis und Nordeuropa während der letzten 5000 Jahre in systematischer WeiseDie Ozeanzyklen wirken in systematischer Weise auf das Klimageschehen ein.
Das Klima in der Arktis und in Nordwest Europa wird stark durch die Nordatlantische Oszillation (NAO) geprägt, die dominante Form der atmosphärischen Variabilität in mittleren Breiten in der nordatlantischen Region.
Der NAO-Index ist ein Indikator für die atmosphärische Zirkulation und Wettermuster:
- Wenn der Index positiv ist, herrschen in Europa und den östlichen USA milde und feuchte Bedingungen.
- Ein negativer Index bewirkt entsprechend das Gegenteil.
Die Rekonstruktion der NAO war bisher auf die letzten 900 Jahre beschränkt.
In dieser Arbeit analysieren wir ein Seesedimente aus Südwest-Grönland, welche die Klimageschichte der vergangenen 5200 Jahre enthalten.
Anhand dieser Daten interpretieren wir sauerstoffarme Phasen in diesem See und versuchen die Muster mit bereits existierenden Rekonstruktionen der NAO anhand von Baumringe und Höhlen-Tropfsteinen.
Die Analyse der beiden Datenreihen ergibt, dass vor 4500 und 650 Jahren, also gegen Ende des sogenannten holozänen Klimaoptimums, sowie zu Beginn der Kleinen Eiszeit, die NAO aus einer positiven Phase kommend in einen wechselhaften und zum Teil negativen Status verfiel.
Wir konnten in unserer Studie zeigen, dass Änderungen in der NAO mit großmaßstäblichen klimatischen Veränderungen in der nördlichen Hemisphäre zusammenfallen.
Der Beginn der Mittelalterlichen Wärmeperiode war hingegen nicht mit einer spürbaren Veränderung der NAO verbunden.
Die Autoren zeigen in ihrer Arbeit außerdem, dass der Sommer-NAO-Index seit 2005 stark negativ ist und sich daher Grönland und das nördliche Kanada aufgrund des empirischen Zusammenhangs relativ warm und feucht gegenüber Europa sein sollte.
Die systematische Klimabeeinflussung durch Ozeanzyklen spielt eine große Rolle im Klimageschehen und sollte vom IPCC in realistischer Weise berücksichtigt werden, auch für die Zukunfts-Prognosen.
Die Muster können in der Vergangenheit studiert werden und dann als Vorhersagewerkzeug in Klimaprognosen verwendet werden.
Bislang hat der IPCC jedoch auf diese Art der Analyse verzichtet.
-
THE HOCKEY SCHTICK
2012-09-24 en New paper shows how natural variability controls North Atlantic climate
Quelle / Source:
-
Nature Geoscience
2012-09-23 en Variability of the North Atlantic Oscillation over the past 5,200 years
⇧
7 AO: Arktische Oszillation
en Arctic Oscillation
fr Oscillation arctique
- a
de
Ist Abnahme des arktischen Meereises von der
Arktischen Oszillation verursacht?
en Could Arctic Sea Ice Decline be Caused by the Arctic Oscillation?
| AO | = |
de
Arktische Oszillation oder auch Northern Hemispheric Annular Mode (NAM) en Arctic oscillation fr Oscillation arctique |
↑
a Ist Abnahme des arktischen Meereises von der Arktischen Oszillation
verursacht?
en Could Arctic Sea Ice Decline be Caused by the
Arctic Oscillation?
![]()
![]() Arktis / Arktic
Arktis / Arktic
↑ Zunahme des Meereises / Sea Ice Increase
↓ Abnahme des Meereises / Sea Ice Decrease
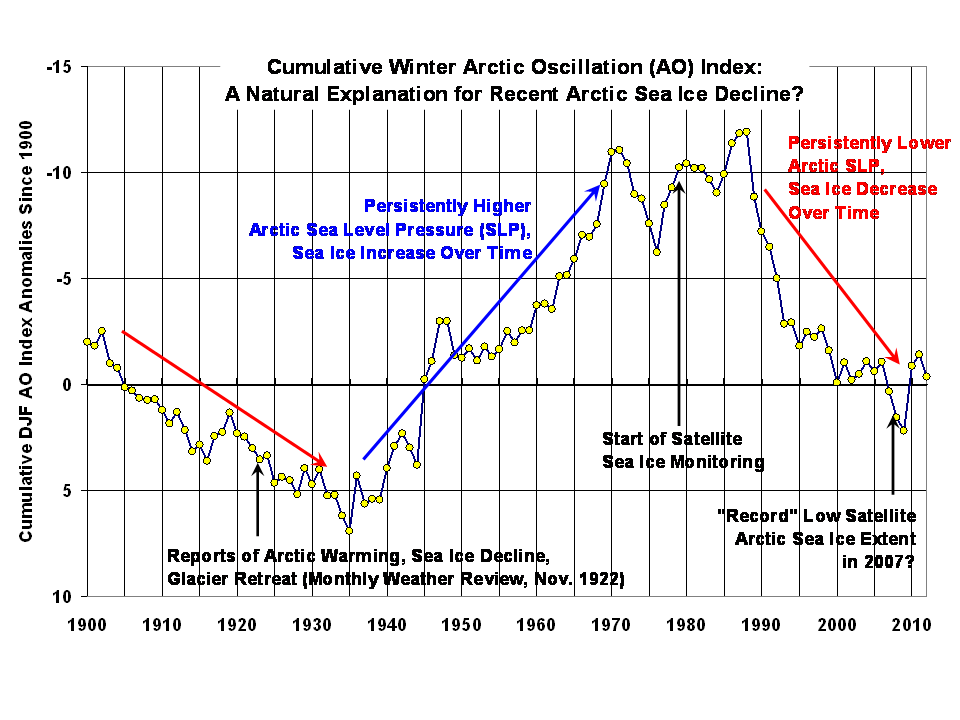
-
Klimaskeptiker Info (Andreas Kreuzmann
2012-03-22 de Ist die langfristige Abnahme des arktischen Meereises von der Arktischen Oszillation verursacht worden?Von Seiten des IPCC wird behauptet, daß die Abnahme des arktischen Meereises in den letzten Jahrzehnten das Ergebnis menschgemachter globaler Erwärmung sei.
Es gibt jedoch auch überzeugende Beleg dafür, daß auch natürliche Zyklen in den atmosphärischen Zirkulationsmustern an der Entwicklung der Eisbedeckung in der Arktis beteiligt sein könnten.
-
Global Warming (Dr. Roy Spencer)
2012-03-22 en Could Arctic Sea Ice Decline be Caused by the Arctic Oscillation?While the IPCC claims that recent Arctic sea ice declines are the result of human-caused warming, there is also convincing observational evidence that natural cycles in atmospheric circulation patterns might also be involved.
⇧
8 IOD: Indischer Ozean Dipol
en IOD
fr IOD
Mit folgenden Links wird von anderen Webseiten auf diese Seite verwiesen:
Links zur Klimaschau
|
|
▶IOD: Indischer Ozean Dipol |
⇧
9 PDO: Pazifische Dekaden-Oszillation
en Pacific decadal oscillation
fr Oscillation décennale du Pacifique
Mit folgenden Links wird von anderen Webseiten auf diese Seite verwiesen:
▶NAO: Nordatlantische Oszillation
Links zur Klimaschau
|
|
▶PDO: Pazifische Dekaden‑Oszillation |
- a de La Ola im Ozean: Die klimazyklische Stadionwelle
- b en We Can't Think of Anything Else It Could Be
- c de
Sechzig-Jahres-Ozeanzyklus jetzt auch in der Meeresspiegelentwicklung
gefunden
en Is There a 60-Year Oscillation in Global Mean Sea Level? - d
de
Neues Paper halbiert die anthropogene Erwärmungsrate der letzten 50 Jahre
en New paper cuts recent anthropogenic warming trend in half - e de Ähnlichkeit der Temperaturentwicklung in den USA während der Sommermonate mit dem Verlauf des PDO-Ozeanzyklus
- f de US-Atmosphärenforscher warnt davor, die kalifornischen Waldbrände reflexhaft dem Klimawandel anzulasten
| PDO | = |
de
Pazifische Dekaden-Oszillation en Pacific decadal oscillation fr Oscillation décennale du Pacifique |
↑ a La Ola im Ozean: Die klimazyklische Stadionwelle
![]()
![]() Die Pazifisch Dekadische Oszillation (PDO) besitzt eine
Zyklendauer von ca. 60 Jahren.
Die Pazifisch Dekadische Oszillation (PDO) besitzt eine
Zyklendauer von ca. 60 Jahren.

Die Pazifisch Dekadische Oszillation erhöht bzw. erniedrigt die Temperatur um jeweils etwa 0,2°C je nach PDO-Phase.
Der Erwärmungsstop im Jahr 2000 fällt mit dem Abstieg der PDO zusammen und stellt eine Wiederholung der Situation aus den 1940er Jahren dar
Aber es gibt ja nicht nur die PDO, sondern eine ganze Flöte von weiteren klimasysteminternen Zyklen.
Nehmen wir zum Beispiel die AMO. Auch sie besitzt einen etwa 60-jährigen Zyklus, der jedoch um 10-20 Jahre zeitverzögert zur PDO abläuft.
Und auch die Nordatlantische Oszillation (NAO) schwingt in diesem Größenmaßstab.
Ist es nicht verwunderlich, dass all diese Zyklen in ähnlichen Zeitmaßstäben schwingen, wenn auch nicht synchron?
-
Die kalte Sonne (Fritz Vahrenholt & Sebastian Lüning)
2012-07-28 de La Ola im Ozean: Die klimazyklische Stadionwelle
![]()
![]() Temperaturzyklen sind dem Langzeittrend überlagert.
Temperaturzyklen sind dem Langzeittrend überlagert.

Die Temperaturprognose aus dem 2007er IPCC-Bericht folgt offensichtlich der durch die Ozeanzyklen übersteilten Flanke, wäre jedoch besser dem Langzeittrend gefolgt.
Der Langzeittrend wird zudem vermutlich in Kürze für eine Weile abknicken, da die Sonnenaktivität als wichtige Einflussgröße in den kommenden Jahrzehnten abnehmen wird.
-
Die kalte Sonne (Fritz Vahrenholt & Sebastian Lüning)
2012-06-19 de Wu et al. 2011: Erwärmung im späten 20. Jahrhundert durch Ozeanzyklen verstärkt
↑ b PDO: We Can't Think of Anything Else It Could Be
PDO = Pacific Decadal Oscillation
-
Climate Skeptic
2008-09-18 en We Can't Think of Anything Else It Could Be
↑
c Sechzig-Jahres-Ozeanzyklus jetzt auch in der Meeresspiegelentwicklung
gefunden
en Is There a 60-Year Oscillation in Global
Mean Sea Level?
de Die Meeresspiegelentwicklung des letzten Jahrhunderts ist durch einen ausgeprägten 60-Jahres-Zyklus geprägt.
Auch das Ende der Erwärmung 1940 und 2000 lag wiederum 60 Jahre auseinander.
en We find that there is a significant oscillation with a period around 60-years in the majority of the tide gauges examined during the 20th Century, and that it appears in every ocean basin.
-
Die kalte Sonne (Fritz Vahrenholt & Sebastian Lüning)
2012-09-20 de Sechzig-Jahres-Ozeanzyklus jetzt auch in der Meeresspiegelentwicklung gefundenWenn man die Temperaturentwicklung der letzten gut hundert Jahre anschaut muss man sich fast ein wenig wie der berühmte Alfred Wegener fühlen:
Deutlich zeichnet sich in den Daten ein Zyklus ab, der etwa 60 Jahre umfasst.
So begannen die beiden jüngsten Erwärmungsepisoden gegen 1915 und 1975, also im Abstand von 60 Jahren.
Aber auch das Ende der Erwärmung 1940 und 2000 lag wiederum 60 Jahre auseinander.
Der Weltklimarat kann sich mit dieser zyklischen Eigendynamik des Klimas so gar nicht anfreunden.
Anstatt den Ozeanzyklus als steuernde Größe anzuerkennen, denkt sich das Gremium allerlei wackelige Hilfskonstruktionen aus, nur um den deutlichen Herzschlag der Natur nicht in die Temperaturprognosen einbauen zu müssen.
Und die Quittung kam prompt: Keines der ehemals so hochgelobten IPCC-Modelle hat den seit nunmehr 14 Jahren andauernden Erwärmungsstop vorhergesagt.
Warum sträubt sich der IPCC so sehr gegen eine sinnhafte Einbeziehung der Ozeanzyklen?
Es spricht viel dafür, dass ein gewichtiger Teil der Erwärmungsepisode von 1977-2000 auf das Konto der aufstrebenden Ozeanzyklen geht.
Denn genau in dieser Zeit stieg auch die Pazifisch Dekadische Oszillation (PDO) stark an und verharrte dann auf einem warmen, hohen Plateau.
Die Mitwirkung der Ozeanzyklen würde damit automatisch die Klimakraft des CO2 schwächen.
Kritik am CO2 hingegen ist beim IPCC unerwünscht und wird mit allen Mitteln unterdrückt.
Aus der Kurzfassung
Wir haben lange Datenreihen von Küstenpegeln in allen Ozeanbecker der Erde untersucht, um zu überprüfen, ob sich in der globalen Meeressiegelentwicklung ein etwa 60-Jahre langer Zyklus wiederfinden lässt, und ob es sich um einen wirklich global wirkenden Zyklus oder nur ein Artefakt in einer kleinen Anzahl von Pegeln handelt.
Wir fanden, dass in der Tat eine bedeutende Oszillation mit einer Periode von etwa 60 Jahren in der überwiegenden Mehrheit der untersuchten Küstenpegel während des 20. Jahrhunderts existiert, und dass diese in jedem Ozean der Erde auftritt.
Mittelt man die Küstenpegel für die einzelnen Ozeanbecken, so zeigt sich, dass sich die Phase und Amplitude der Zyklik im Nordatlantik, westlichen Nordpazifik und Indischen Ozean stark ähneln.
Im westlichen Südpazifik hingegen setzt die Entwicklung um etwa 10 Jahre verzögert ein.
Die einzige untersuchte Region, in der kein deutlicher 60-Jahreszyklus im Meeresspiegel existiert, ist der zentrale und östliche Nordpazifik.
Die in den Küstenpegeldaten identifizierte Phase des 60-Jahres-Zyklus ist so ausgebildet, dass sich der Meeresspiegel im Nordatlantik, westlichen Nordpazifik und Indischen Ozean seit etwa 1985-1990 zusätzlich angehoben hat.
Leider gibt es in Bezug auf die zeitliche als auch räumliche Abdeckung noch nicht genügend Küstenpegeldaten, um den 60-Jahreszyklus in der Meeresspiegelentwicklung zweifelsfrei nachweisen zu können.
Dennoch sollte der Zyklus berücksichtigt werden, wenn es um Betrachtungen zur Beschleunigung des Meeresspiegelanstiegs und die regionale Meeresspiegelentwicklung geht.
Aus dem Diskussionsabschnitt
Bis wir nicht vollständig verstanden haben, ob die Meeresspiegelentwicklung im Zeitraum von mehreren Jahrzehnten durch charakteristische Umbiegepunkte oder einen 60-Jahres-Zyklus geprägt wird und sich dies global auswirkt, sollte man mit Berechnungen eines beschleunigten Meeresspiegelanstiegs sehr vorsichtig sein.
Ausnahmen wären, wenn die verwendeten Datenreihen länger als zwei Zyklenperioden sind oder das Modell die Möglichkeit einer 60-Jahres-Oszillation bereits berücksichtigt.
Diese Einschränkungen gelten insbesondere für die Interpretation eines beschleunigten Meeressiegelanstiegs unter Verwendung von Satellitendaten, die lediglich 20 Jahre zurückreichen sowie für einzelne Pegel mit kurzen Datenreihen.
-
GEOPHYSICAL RESEARCH LETTERS
Don P. Chambers, Mark A. Merrifield, R. Steven Nerem
2012-08-17 en Is There a 60-Year Oscillation in Global Mean Sea Level?We examine long tide gauge records in every ocean basin to examine whether a quasi 60-year oscillation observed in global mean sea level (GMSL) reconstructions reflects a true global oscillation, or an artifact associated with a small number of gauges.
We find that there is a significant oscillation with a period around 60-years in the majority of the tide gauges examined during the 20th Century, and that it appears in every ocean basin.
Averaging of tide gauges over regions shows that the phase and amplitude of the fluctuations are similar in the North Atlantic, western North Pacific, and Indian Oceans, while the signal is shifted by 10 years in the western South Pacific.
The only sampled region with no apparent 60-year fluctuation is the Central/Eastern North Pacific.
The phase of the 60-year oscillation found in the tide gauge records is such that sea level in the North Atlantic, western North Pacific, Indian Ocean, and western South Pacific has been increasing since 1985-1990.
Although the tide gauge data are still too limited, both in time and space, to determine conclusively that there is a 60-year oscillation in GMSL, the possibility should be considered when attempting to interpret the acceleration in the rate of global and regional mean sea level rise.
↑
d Neues Paper halbiert die anthropogene Erwärmungsrate der letzten 50 Jahre
en New paper cuts recent anthropogenic warming trend in half
-
Die kalte Sonne (Fritz Vahrenholt, Sebastian Lüning)
2012-10-31 de Neues Paper halbiert die anthropogene Erwärmungsrate der letzten 50 Jahre
-
De staat van het klimaat (Marcel Crok)
2012-10-17 en New paper cuts recent anthropogenic warming trend in half
Quelle / Source:
-
Journal of the Atmospheric Sciences
Jiansong Zhou and Ka-Kit Tung, Department of Applied Mathematics, University of Washington, Seattle, WA 98195, USA
2012 en Deducing Multi-decadal Anthropogenic Global Warming Trends Using Multiple Regression AnalysisAbstract
In order to unmask the anthropogenic global warming trend imbedded in the climate data, multiple linear regression analysis is often employed to filter out short-term fluctuations caused by El Nino-Southern Oscillation (ENSO), volcano aerosols and solar forcing.
These fluctuations are unimportant as far as their impact on the deduced multidecadal anthropogenic trends is concerned: ENSO and volcano aerosols have very little multi-decadal trend.
Solar variations do have a secular trend, but it is very small and uncertain.
What is important, but is left out of all multiple regression analysis of global warming so far, is a long-perioded oscillation called the Atlantic Multi-decadal Oscillation (AMO).
When the AMO Index is included as a regressor (i.e. explanatory variable), the deduced multi-decadal anthropogenic global warming trend is so impacted that previously deduced anthropogenic warming rates need to be substantially revised.
The deduced net anthropogenic global warming trend has been remarkably steady and statistically significant for the past 100 years.
↑ e Ähnlichkeit der Temperaturentwicklung in den USA während der Sommermonate mit dem Verlauf des PDO-Ozeanzyklus
![]()
![]() Temperaturentwicklung in den USA während der Sommermonate.
Temperaturentwicklung in den USA während der Sommermonate.

Die Ähnlichkeit im Verlauf mit dem PDO-Ozeanzyklus ist frappierend
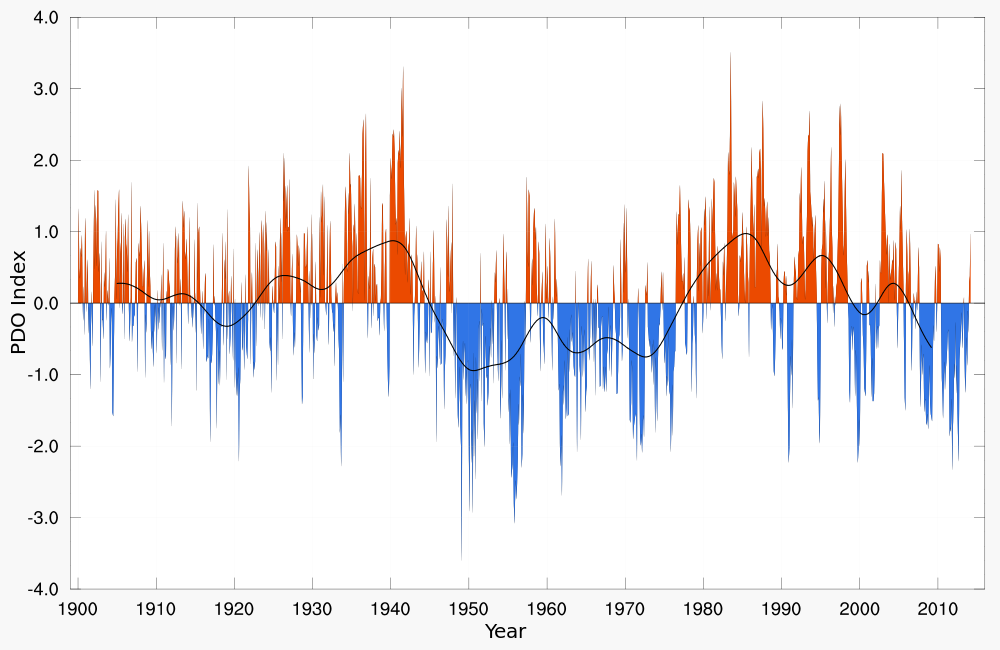
-
Die kalte Sonne (Fritz Vahrenholt & Sebastian Lüning)
2018-01-28 de Ach wie gut, dass niemand weiß, dass ich PDO heiß'Die Sommertemperaturen in den USA nahmen einen unerwarteten Verlauf in den letzten 90 Jahren.
In den 1930ern waren die Sommer ziemlich heiß, zum Teil sogar heißer als heute.
Dazwischen sackten die Temperaturen jahrzehntelang ab.
Extrapoliert man den Zyklus in die Zukunft,
kann man schon ahnen, was als nächstes kommt:
Die Sommer in den USA werden wieder kälter werden.
Ein Paper von Alter et al. 2017 kommt zu einem interessanten Schluss:
Die Sommertemperaturen in den USA hatten im letzten Jahrhundert wenig mit dem CO2 zu tun.
↑ f US-Atmosphärenforscher warnt davor, die kalifornischen Waldbrände reflexhaft dem Klimawandel anzulasten
-
Die kalte Sonne (Fritz Vahrenholt & Sebastian Lüning)
2018-11-19 de US-Atmosphärenforscher warnt davor, die kalifornischen Waldbrände reflexhaft dem Klimawandel anzulastende Fakten en Facts fr Faits
Einiger Aussagen
Die Gesamtzahl aller Feuer in Kalifornien hat überhaupt nicht zugenommen; die Zahl der großen, verheerenden Feuer aber sehr wohl.
Von den 20 größten je dokumentierten Feuern in Kalifornien brannten 15 in diesem Jahrtausend.
Ich sehe zweierlei Ursachen:
Zum einen sind da die wärmeren, trockeneren Klimabedingungen, vor allem im Norden Kaliforniens.Besonders wichtig ist dabei, dass die nächtlichen Temperaturen gestiegen sind.
Der andere Punkt ist, dass wir über viele Jahre hin erfolgreich Feuer verhindert haben.
Das klingt zwar erfreulich, aber es führt gleichzeitig dazu, dass sich immer mehr Brennstoff angesammelt hat.
In der Feuerökologie gilt die Grundregel:
Klima ermöglicht Feuer, Wetter facht es an.Mit anderen Worten:
Ja, wenn es wärmer und trockener wird - und das beobachten wir in Kalifornien -, dann bedeutet das erhöhte Feuergefahr.Ich zögere trotzdem zu sagen:
"Der Klimawandel verursacht diese großen, zerstörerischen Feuer."
Wir dürfen die anderen, mindestens ebenso wichtigen Faktoren nicht außer Acht lassen:
dass es in der Vergangenheit eine Form der Brandvorsorge gegeben hat, die wir überdenken sollten; und dass die Menschen ihre Häuser an ebenjenen Orten bauen, wo die Gefahr besonders groß ist.
Die Menschen wollen raus aus den Städten, und sie dringen dabei immer weiter vor in die Übergangszone zwischen Stadt und Wildnis.
Wer aber sein Eigenheim an einem Platz inmitten einer Vegetation errichtet, die alljährlich austrocknet, der riskiert, dass es irgendwann in Flammen aufgeht.
Sollte das bei der Siedlungsplanung besser berücksichtigt werden?
Brown: Unbedingt! Denn nachträglicher Feuerschutz von Häusern, nachdem sie einmal gebaut sind, kann sehr teuer werden. Ungefähr zwei Millionen Häuser in Kalifornien stehen in Gegenden mit hoher Brandgefahr.
de Panik-Küche en Panic laboratory fr Marmite alarmiste
Ist das der Klimawandel? "Ich denke schon", sagt Mojib Latif
Ist das der Klimawandel? "Ich denke schon", sagt Mojib Latif, einer der wichtigsten Klimaforscher in Deutschland, Professor am Helmholtz-Zentrum für Ozeanforschung Kiel.
"Das ist mit Sicherheit der Klimawandel", sagt Johann Georg Goldammer, Feuerökologe und Gründer des Global Fire Monitoring Centers Freiburg.
Die Zeit der Zweifel scheint vorbei.
Bei der Dürre in Kalifornien und den Bränden, die sich immer häufiger dort entwickeln, handelt es sich vermutlich eben nicht mehr um Einzelereignisse, sagt Mojib Latif.
Der Klimaforscher war für seine Arbeit oft in Kalifornien.
Er kennt die Landschaften und das Klima aus eigener Anschauung seit mehr als zwanzig Jahren.
Er weiß, dass regelmäßige Brände in Kalifornien natürlich sind, manche Bäume dort sogar Feuer brauchen, um sich fortzupflanzen.
Latif kennt auch die wissenschaftlichen Daten über das Klima der Region.
Aus diesen Daten könne man das Klima Kaliforniens seit dem Jahr 800 rekonstruieren, sagt er.
"Seit Jahrzehnten ist es in Kalifornien sehr trocken. Das ist in mehr als 1200 Jahren einmalig."
Das Mojib-Orakel hat gesprochen.
Es muss wohl der Klimwandel gewesen sein. Oder vielleicht doch nicht?
Mojib Latif Dr. rer. nat., Professor für Meteorologie am Leibniz-Institut für Meereswissenschaften (IFM-GEOMAR) an der Universität Kiel.
▶Mojib Latif: Who is who (Aktivisten der anthropogenen Erwärmung)de Selbst Beurteilen! en Judge yourself! fr Jugez vous-même!
Die Autoren berichten über schlimme Dürreserien während der Mittelalterlichen Wärmeperioden, die zum Aussterben von ganzen Indianerkulturen geführt hat.
Benson et al. 2007 erwähnen sogar Gründe für die vorindustriellen Dürreserien.
Die treten in der Region vor allem während Minima des PDO-Ozeanzyklus sowie während positiven Phasen des AMO-Ozeanzyklus auf.
So war es jedenfalls vor 1000 Jahren.
Ein guter Hinweis.
Wir schauen nach, in welcher Phase die PDO und AMO gerade schwingen.
Als erstes die PDO, die Pazifische Dekadenoszillation (Abb. 1).
Sie befindet sich gerade in einem Minimum, wie unschwer zu sehen ist.
Das fördert Dürren in Kalifornien.

 Verlauf der PDO während der letzten 120 Jahre

▶PDO: Pazifische Dekaden‑Oszillation
Und jetzt der zweite Ozeanzyklus, die AMO, Atlantische Multidekadenoszillation (Abb. 2).
Wir befinden uns in einer positien Phase, genau wie vor 1000 Jahren,
als es schon einmal so viele Dürren gegeben hat.

 Entwicklung der AMO während der letzten 130 Jahre.

▶AMO: Atlantische Multidekaden‑Oszillation
Fazit:
Wieder einmal führt Latif sein Publikum hinters Licht.
Anstatt die gut bekannten Zusammenhänge zwischen Ozeanzyklen und Regenmengen an der US-Westküste zu erläutern, erklärt er die Heutezeit einfach zur Sonderzone.
Das ist umso erstaunlicher, weil Latif früher selber über die Ozeanzyklen publiziert hat.
Nun stehen sie ihm und seinem lukrativen Klimaaktivismus im Weg, so dass er sie einfach verleugnet.
Aber der Welt-Artikel fängt an der Stelle erst an.
Wiebke und Céline lassen sich sogleich von der Münchener Rück den zweiten Bären aufbinden:
Die Rückversicherungsgesellschaft Munich Re erhebt und analysiert seit den 1970er-Jahren Daten über Brände in Kalifornien: über die Schadenssummen nach einer Saison.
Lange seien es zwei, drei, vier Milliarden Dollar im Jahr gewesen, sagt Ernst Rauch, leitender Klima- und Geowissenschaftler bei Munich Re.
"Das Jahr 2017 hat die bisherigen Dimensionen gesprengt.
Die Landschaftsbrände verursachten gesamtwirtschaftliche Schäden von fast 18 Milliarden Dollar."
Für 2018 gibt es noch keine abschließenden Zahlen.
Aber es sehe leider so aus, meint Rauch, als sei 2017 keine einsame Ausnahme gewesen.
Was Ernst Rauch verschweigt:
Die versichterten Werte sind in den letzten Jahrzehnten natürlich ebenfalls gestiegen.
Berücksichtig man dies, so sieht die Situation gänzlich anders aus.
Siehe: Neue Arbeit von Roger Pielke Jr.:
Anstieg der globalen Extremwetterversicherungsschäden basiert fast vollständig auf sozioökonomischen Gründen.
Die Welt sollte den Autoren vielleicht doch wieder mehr Zeit zur Recherche geben.
Momentan sieht es so aus, als wenn man den Reportern fast alles in den Block diktieren kann.
Ein bisschen Mitdenken bzw. naturwissenschaftliche Grundkenntnisse wären vielleicht vorteilhaft...
Das gilt nicht nur für Wiebke Hollersen (Studium der Publizistik, Politikwissenschaft, Neueren Geschichte an der FU Berlin) und Céline Lauer (Studium der Europäischen Ethnologie und Sozialwissenschaften an der Humboldt-Universität zu Berlin).
de en fr Who is who
VersicherungenWho is who
InsurancesQui est qui
Assurances
⇧ de Diverses en Miscellaneous fr Divers
↑
a Klimamodelle
en Climate Models
fr Modèles climatiques
↑
Klimamodelle kriegen die Ozeanzyklen nicht in den Griff
en Evaluation of short-term climate change
prediction in multi-model CMIP5 decadal hindcasts
-
Die kalte Sonne (Fritz Vahrenholt & Sebastian Lüning)
2012-11-14 de Klimamodelle kriegen die Ozeanzyklen nicht in den GriffKurzfassung
Die meisten Modelle überschätzen Trends.
In den frühen Jahrzehnten [des Untersuchungszeitraums] postulieren die Modelle eine geringere Erwärmung (oder sogar Abkühlung) als die realen Messwerte, während die Modelle eine zu starke Erwärmung für die letzten Jahrzehnte angeben.
Alle Modelle besitzen eine gute Vorhersagefähigkeit für die Oberfächentemperaturen im Indischen Ozean, Nordatlantik und westlichen Pazifik, wo externe Klimafaktoren und eine träge Klimavariabilität vorherrschen.
Die Vorhersagefähigkeit im äquatorialen und nördlichen Pazifik hingegen ist sehr gering.
Die atlantische Multidekaden-Oszillation (AMO) ist in den meisten Modellen mit einer gewissen Vorhersage-Genauigkeit enthalten.
Die Pazifische Dekadenoszillation (PDO) besitzt in den meisten Modellen jedoch nur eine ziemlich schlechte Vorhersage-Genauigkeit.
-
NIPCC
2012-10-16 en Initial Testing of IPCC Fith Assessment Report Climate ModelsConclusion:
As for the implications of their findings, Kim et al. write that "the prediction of decadal climate variability against a background of global warming is one of the most important and challenging tasks in climate science."
And in light of their findings, it would appear that the CMIP5 models they tested are still not fully up to accomplishing this "most important and challenging task."
Quelle / Source;
-
GEOPHYSICAL RESEARCH LETTERS
2012-03-09 en Evaluation of short-term climate change prediction in multi-model CMIP5 decadal hindcastsSummary:
This study assesses the CMIP5 decadal hindcast/forecast simulations of seven state-of-the-art ocean-atmosphere coupled models.
Each decadal prediction consists of simulations over a 10 year period each of which are initialized every five years from climate states of 1960/1961 to 2005/2006.
Most of the models overestimate trends, whereby the models predict less warming or even cooling in the earlier decades compared to observations and too much warming in recent decades.
All models show high prediction skill for surface temperature over the Indian, North Atlantic and western Pacific Oceans where the externally forced component and low-frequency climate variability is dominant.
However, low prediction skill is found over the equatorial and North Pacific Ocean.
The Atlantic Multidecadal Oscillation (AMO) index is predicted in most of the models with significant skill, while the Pacific Decadal Oscillation (PDO) index shows relatively low predictive skill.
The multi-model ensemble has in general better-forecast quality than the single-model systems for global mean surface temperature, AMO and PDO.
⇧ de Text en Text fr Texte
↑
b Verlauf
en Events
fr Déroulements
- 2018-11
- 2018-02
- 2017-10
- 2016-07
- 2016-01
- 2015-12
- 2015-07
- 2014-08
- 2014-06
- 2014-02
- 2011-10
- 2011-01
- 2010-12
- 2010-05
- 2009-08
- 2009-07
- 2009-01
▶Neuste Meldungen über die Sonnenaktivität
| de | en | fr |
|---|---|---|
|
Die Sonne Sonnenaktivität |
The Sun Solar Activity |
Le soleil Activité solaire |
↑ 2018-11
-
Science Skeptical Blog / Michael Krueger
2018-11-17 de El Nino bahnt sich an. Klimaschützer können auf steigende Temperatur hoffen!Es deutet alles darauf hin, dass sich derzeit ein El Nino im Ost- und Zentralpazifik zur Jahreswende entwickelt und damit die Globaltemperatur wieder ansteigen lässt.
Der El Nino ist ein Wetterphänomen, welches warme Temperaturen im Pazifik mit sich bringt.
2015/16 bescherte ein El Nino uns neue Rekorde der Globaltemperatur.
Die Temperaturanomalie der NASA stieg auf 1°C seit 1880.
Mit Abklingen des El Nino ist sie wieder auf 0,8°C gefallen!
Seit einigen Monaten steigen die Temperaturen aufgrund der Wetterbedingungen im Pazifik wieder an.
Seit dem letzten Sommer ist dort ein Temperaturanstieg von 1°C zu verzeichnen.
In den nächsten Monaten ist infolge dessen mit einer steigenden Globaltemperatur zu rechnen.
Zur Freude der Klimaschützer.
Über den Rückgang der Globaltemperatur nach dem letzten El Nino wurde nicht berichtet, man hat sich statt dessen auf den warmen und trockenen Sommer in Deutschland konzentriert.
Sollte der nächste Sommer in Deutschland wieder kühler ausfallen, kann man sich erneut auf die steigende Globaltemperatur konzentrieren, als Beleg für den meschengemachten Klimawandel.
Ich wage mal die Prognose, dass das so geschehen wird.
Auch WetterOnline berichtet über den anstehenden El Nino.
In den nächsten Tagen stehen erst mal frostige Temperaturen in Deutschland an.
Die Kraniche fliehen vor der anstehenden Kälte schon nach Süden.
Und auch in den USA ist der Winter schon eingezogen.
Im Nordosten der USA herrschte gerade Schneechoas.
Bis zu 20 Zentimeter Neuschnee brachten die Autofahrer an der Ostküste an den Rand der Verzweiflung.
Grund dafür, die Nordatlantische Oszillation und die Arktische Oszillation, zwei Wettersysteme im hohen Norden, gehen gerade in eine negative Phase über, die kalte Temperaturen für uns und die Ostküste der USA mit sich bringen.
Kalte, polare Luft strömt dabei über Skandinavien zu uns nach Deutschland.
Und kalte, polare Luft über Kanada in den Osten der USA.
Auch hier würde ich mich nicht wundern, wenn in den nächsten Tagen die Medien berichten, auch das würde am menschengemachten Klimawandel liegen.
↑ 2018-02
-
Die kalte Sonne (Fritz Vahrenholt & Sebastian Lüning)
Frank Bosse und Fritz Vahrenholt
2018-03-18 de Die Sonne im Februar 2018 und der Status der Ozeane zu Beginn des JahresDie Sonne

 Die Aktivität des Zyklus SC 24 (rot)
im Vergleich mit einem mittleren Zyklus (blau)
und dem seit vielen Monaten recht ähnlichen SC 5 (schwarz)

Unser Heimatstern war auch im Februar 2018 sehr unterdurchschnittlich aktiv.
Die festgestellte mittlere SSN (SunSpotNumber) für den Monat betrug 10,6.
Sie lag bei 30% dessen, was in diesem Zyklusmonat im Mittel (Zyklus 1...23) bisher zu verzeichnen war.
An 11 der 28 Tage war überhaupt kein Fleck zu beobachten, zwischen dem 4. und dem 16. des Monats war auf der Südhemisphäre der Sonne ein wenig Aktivität zu verzeichnen.
Auf der Nordhemisphäre waren nur während der letzten 3 Tage d.M. Flecke sichtbar.
Der gegenwärtige Status der Ozeane

 Die globalen Meeresoberflächentemperaturen
(SST: SeaSurfaceTemperatures)
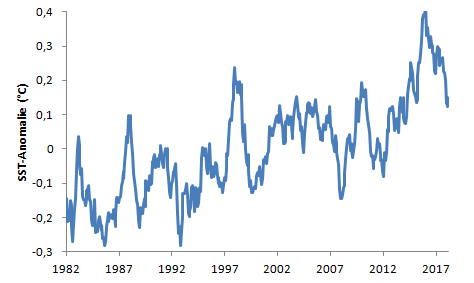
Die SST sind nach ihrem ElNino-bedingten Höhenflug inzwischen wieder auf dem mittleren Niveau von 2014 angekommen, etwa +0,12°C.
Der Wärmeimpuls der jüngeren Vergangenheit war zeitlich und in der Amplitude deutlich stärker als der letzte große Ausreißer 1997/98.
Warum, darüber hatten wir hier vor Jahresfrist berichtet und hier bestätigt: die freigesetzte Wärmemenge aus dem Unterwasserreservoir des westpazifischen Warmpools war etwa doppelt so groß als beim letzten großen ElNino.
Es ist jetzt deutlich sichtbar, wie stark die natürliche Erscheinung ElNino in Zeit und Amplitude wirkte und wie sich danach alles normalisiert.
Ob wir eine "Treppenstufe" sehen wie nach 2002 im Vergleich zu den 90ern auf etwas höherem Niveau...das bleibt abzuwarten.
Jedenfalls werden wir wohl von weiterem "Rekord-Gebrüll" vorerst verschont bleiben.
Die "Oszillationen" der Ozeane der Nordhalbkugel
Atlantische multidekadische Oszillation (AMO)
 Die AMO seit 1950 leicht geglättet mit einem 3-Jahrestiefpass.
Bis etwa 1965 war sie in ihrer positiven Phase,
bis Mitte der 70er dann ein sehr markanter Dip.
Nach 1995 dann ein rasanter Anstieg in die positive Phase zurück in der sie gegenwärtig noch ist.

Beide großen Ozeane , Atlantik und Pazifik, weisen in ihrem nördlichen Teil periodische Temperaturschwankungen auf, genannt Atlantische multidekadische Oszillation (AMO) und Pazifische dekadische Oszillation (PDO).
Beide beschreiben streng genommen etwas Unterschiedliches:
Die AMO stellt eine Temperaturvarianz der SST des gesamten außer-tropischen atlantischen Beckens dar. Sie wird definitionsgemäß (das war zu Beginn der 2000er) als trendbereinigte Reihe dargestellt. Dies ist jedoch nicht mehr Stand des Wissens, eine einfache Trendbefreiung ist kaum physikalisch. Es gibt daher den Ansatz, die globalen Temperaturen von den SST des nördlichen Atlantiks durch eine Regression zu entfernen. Wir benutzen diese Herangehensweise.
Wir sahen in jüngster Vergangenheit etwa 2015/16 schon einen Abschwung, der allerdings in den letzten Monaten wieder aufgefangen wurde. Ein nachhaltiger Umschwung ins Negative wird nicht vor 2020 erwartet.
Pazifische dekadische Oszillation (PDO)

 Die PDO seit 1900. Sie war bis etwa 1945 in ihrer positiven Phase,
danach bis etwa 1980 negativ mit schnellem Anstieg um 1985 und zeigt nach 2000 fallende Tendenz. Ab 2015 machte sie einen "Hüpfer" die Wechselwirkung mit dem Super-ElNino ließ wahrscheinlich grüßen. Sie fällt gegenwärtig wieder gen null.

Die PDO bezeichnet eher ein Muster der Temperaturverteilung des nördlichen Pazifik. Die PDO wechselwirkt mit der ENSO, der tropischen Variabilität des Pazifiks.
Beide "Oszillationen" die in dekadischen Zeiträumen ihr Vorzeichen wechseln, könnten also in naher Zukunft negativ werden.
Das hätte Auswirkungen auch auf die globalen Temperaturen und das verstärkte/unterdrückte Auftreten von ElNinos.
Der tropische Pazifik
El Niño-Southern Oscillation (ENSO)
 Die Entwicklung des Index Nino3,4 seit 1980.
Er zeigt eine moderate LaNina an gegenwärtig.

Die ENSO ist seit September 2017 in einer moderat negativen Phase.
Eine LaNina ist (noch) nicht ausgerufen, dafür sind 5 zusammenhängende Monate mit ONI (OceanicNinoIndex) - Werten von unter -0,5 erforderlich.
Da bislang 4 Monate erreicht sind und auch der März noch nicht über -0,5 gestiegen ist, sollten wir also letztendlich eine LaNina 2017/18 bekommen, wenn auch keine sehr starke.
Wie lange dieser Zustand anhalten wird ist momentan schwer vorherzusagen.
Wir müssen uns bis zum Sommer gedulden um zu sehen, ob sich der tropische Pazifik hin zu neutralen Bedingungen entwickeln wird oder die Tendenz zur LaNina anhält.
Der Meeresspiegel
de Panik-Küche en Panic laboratory fr Marmite alarmiste
Mitte Februar ging eine erschreckende Mitteilung durch alle Medien, auch die Tagesschau mahnte:
Der Pegel steigt nicht linear sondern quadratisch und bis Ende des Jahrhunderts haben wir 65 cm zu erwarten!
Bei linearem Anstieg mit den heutigen Raten von ca. 3mm/a wären es nur beherrschbare 25 cm.
Was steckte dahinter?
Die Eilmeldungen gingen zurück auf diese Arbeit unter Führung von Robert S. Nerem von der Universität Boulder/Colorado.
Darin hatten die Autoren die Schwankungen des Meeresspiegels die ENSO erzeugt, aus den Beobachtungen heraus rechnen sollen.
Ein ElNino lässt es im Ostpazifik viel mehr regnen und das viele Wasser im Ozean führt zu einem temporären Anstieg des globalen Meeresspiegels.
Umgekehrt, bei einer LaNina, wird viel Regenwasser auf Land (besonders Australien) zwischengespeichert und dieser vorübergehende Mangel im Ozean ist auch global deutlich sichtbar.
Wie Sie in Abb. 6 (Die Entwicklung des Index Nino3,4) gut sehen können, hatten wir nahe dem Beginn der Satellitenaufzeichnungen 1998 einen Wasserüberschuss, nach 2010 einen Mangel und 2017 wieder zu viel.
Die beteiligten Autoren entfernten jedoch diese natürlichen Schwankungen nicht vollständig, wie sich bald herausstellte.
Dadurch ging der jüngste El Nino zumindest teilweise in die Rechnungen ein und beeinflusste den Trend, ebenso die LaNina 2011/12 und der ElNino 1997/98.
Diese zeitliche Verteilung muss einen wachsenden Trend produzieren.
Mit diesem Lapsus in den Daten legte man in Nerem et al (2018) einen quadratischen Fit und extrapolierte flugs bis 2100.
Ein solches Verfahren impliziert einen Anfängerfehler, den man "Overfitting" nennt.
Eine viel zu kleine Datenbasis von 1993 bis 2017, hier auch noch fehlerbehaftet, erzeugt einen viel zu sicher geglaubten Trend bis 2100.
Da der Arbeit keine Daten angefügt waren, musste man schon zwei, drei Stunden investieren um die Probleme freizulegen.
Vermutlich hatten sich die Reviewer dieser Mühe nicht unterziehen wollen und ließen diese wissenschaftlichen Fehlleistung in ein Journal passieren.
Von da aus trat die Headline Ihren Zug durch die Medien der Welt an.
Glatter Fehlalarm!
Es bleibt festzuhalten:
ein fehlerhaftes Papier, dass in die Richtung des Alarmismus weist, schafft es bis in die Tagesschau und die Frühnachrichten vieler Rundfunkanstalten.Erkenntnisse über natürliche, die Temperaturentwicklung dämpfende Einflüsse wie die AMO oder die PDO schaffen es nicht einmal immer bis in den Wissenschaftsteil unserer Medien.
So wird mit der Selektion von wissenschaftlichen Nachrichten Politik gemacht.
Wir werden sehen, was die Entwicklungen der nächsten Jahre bringt.
Beide bedeutenden Ozeanindexe negativ und eine unternormal starke Sonne, das wären schon Konterparts für weitere Erwärmungsszenarien.
Wenn es dann offenkundig und für jedermann erfahrbar wird, werden wir das auch in unseren Zeitungen lesen.
↑ 2017-10
![]()
![]() Die SSN- Zahlen des aktuellen Zyklus ( rot)
Die SSN- Zahlen des aktuellen Zyklus ( rot)
im Vergleich mit einem mittleren Zyklus ( blau)
und dem seit über 2 Jahren sehr ähnlichen Zyklus 5 (schwarz).
Auch auffällig: seit etwa einem Jahr erkennen wir einen Stillstand
("Hiatus") der Aktivität bei einer mittleren SSN von 25 und leichten
Pendelbewegungen um diesen Wert.
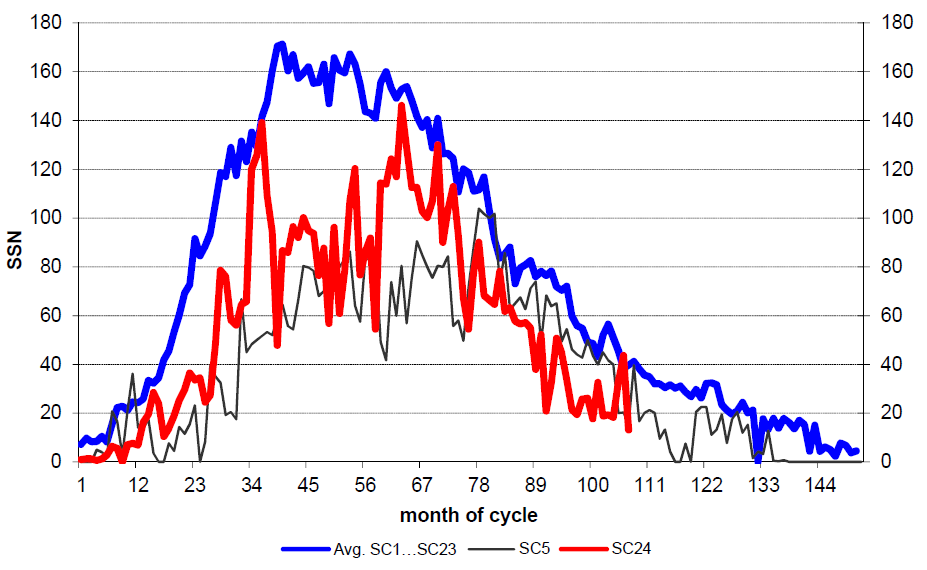
![]()
![]() Die Temperaturverteilung beim letzten großen El Niño unter dem
pazifischen Äquator.
Die Temperaturverteilung beim letzten großen El Niño unter dem
pazifischen Äquator.
Man erkennt die warmen Wässer vor allem bis in nur 100m Tiefe
im östlichen Pazifik
während die tieferen Schichten des Westpazifiks deutlich kühler
als normal sind.

![]()
![]() Die gleiche Darstellung wie Abb.3 nun unter La Niña- Bedingungen.
Die gleiche Darstellung wie Abb.3 nun unter La Niña- Bedingungen.
Der Ostpazifik bis weit westlich der Datumsgrenze bei 180° ist kühler
in den oberen Schichten,
dafür ist der Westpazifik vor allem in Schichten unter 100m viel
wärmer als normal.

-
Die kalte Sonne (Fritz Vahrenholt & Sebastian Lüning)
Frank Bosse und Fritz Vahrenholt
2017-11-20 de Die Sonne im Oktober 2017 und das Christ-Mädchen vor der TürUnser (fast) einziger Energielieferant im Zentrum des Sonnensystems war im Vormonat wieder so unternormal aktiv wie wir es - außer im September - immer vermelden mussten.
Die festgestellte Sonnenfleckenzahl (SunSpotNumber SSN) betrug im Monatsmittel 13,2.
Besonders zur Monatsmitte (vom 9. bis 20. d.M.) war die Sonne häufig - an 11 von 12 Tagen - gänzlich ohne Fleck.
Damit brachte es unser Zentralgestirn nur auf eine Aktivität, die bei 33% des zu diesem Zyklusmonat ( Nr. 107) üblichen lag.
Über den gesamten Zyklus betrachtet sahen wir damit nur 56% der Aktivität des mittleren Zyklus, gebildet aus dem Mittelwert aller bisher vollendeten 23 Zyklen, blau im Bild unten.
↑ 2016-07
![]()
![]() Say Hello to La Niña Conditions
Say Hello to La Niña Conditions

-
Watts Up With That? (Antony Watts)
2016-07-18 en Say Hello to La Niña Conditions
↑ 2016-01
-
Watts Up With That? (Anthony Watts)
2016-01-12 en January 2016 ENSO Update - It Appears the El Niño Has Peaked
-
Die kalte Sonne (Fritz Vahrenholt & Sebastian Lüning)
Frank Bosse und Fritz Vahrenholt
2016-02-09 de Die Sonne im Januar 2016, Rekorde und Ozeanströmungen: Der Golfstrom bleibt stabil!Das Rekordjahr 2015 und was dazu beitrug
Das Jahr 2015 endete mit einem Rekordwert: Die Temperaturreihe GISS verzeichnete +0,87 °C Anomalie gegenüber dem Referenzzeitraum 1951-1981.
Dies waren nochmals 0,13°C mehr als im Vorjahr 2014 global festgestellt wurde. Besonders stark stiegen die Ozeantemperaturen an.
Ein Blick zurück auf einen nur wenige Monate älteren Datensatz GISS vom Mai 2015 zeigt, dass die globalen Mitteltemperaturen 2014 damals noch um 0,06°C geringer angezeigt wurden als im Januar 2016.
Wie kann das sein? Im Sommer 2015 wurde eine Korrektur der Meerestemperaturen eingeführt, wir hatten u.a. hier darüber berichtet.
Der Auslöser:
Die Messmethoden zur Erfassung der Oberflächentemperaturen der Meere (SST- Sea Surface Temperature) änderten sich ab 1998.Wurden früher die SST von Schiffen aus bestimmt, oft indem die Wassertemperatur in Eimern oder über das angesaugte Kühlwasser gemessen wurde, ging man später zu präziseren Bojenmessungen über.
Dieser Übergang trug, so die Wissenschaftler um T. Karl von der NOAA, eine negative Verfälschung ein, die man mit Korrekturen (für die offensichtlich zu warmen Messungen der Vergangenheit nach unten, für die präzisen Messungen der Gegenwart nach oben) minimierte.
Diese Maßnahme wurde sehr schnell für die globalen Bodentemperatur-Reihen übernommen.
Es gibt hierfür nicht nur Beifall in der Fachwelt, wie unser Artikel "IPCC-Autor Gerald Meehl verurteilt fragwürdige Rettungsaktionen von Klimaaktivisten zur Erwärmungspause: Der Hiatus ist real und ist erklärungsbedürftig" zeigte.
Es erscheint recht fragwürdig, gute neuere Bojenmessungen nach oben zu verändern, um sie an die schlechten alten Eimermessungen anzupassen.
...
 NOAA in Not: Erwärmungspause der letzten 15 Jahre lässt sich nicht so
einfach wegtricksen
Update: University of Alabama in Huntsville (UAH) lehnt fragwürdige Veränderungen am RSS-Satelliten-Temperaturdatensatz abEinfluss des El Nino
Einen deutlich höheren Einfluss auf die weltweiten Temperaturen sehen Sie in Abb. 4 im äquatorialen Pazifik: den bereits im November 2015 voll entwickelten ElNino.
Über die Entstehung und den Verlauf dieser internen Variabilität unseres Klimas hatten wir hier berichtet.
Bereits im Jahre 2014 kündigte er sich an, zumindest bis zum Mai.
Ab Anfang August 2014 war er abgesagt, wie wir hier meldeten.
Nun also kam er mit einiger Wucht in 2015 und bescherte den globalen Temperaturen im Jahr 2015 im Mittel einen Anstieg von ca. 0,09 °C.
Das viele rot in Abb. 4 hinterließ seine Spuren in den Troposphären-und Bodentemperaturen.
Alle genannten Beiträge zum Rekord in Summe belaufen sich auf ca. 0,16°C. Nach GISS hätten wir dann etwa die globalen Temperaturen des Vorjahres.
Der Rekord in 2015 ist also zu ganz großen Teilen auf natürliche Variabilität
und eine umstrittene Korrektur von Messdaten größtenteils der Vergangenheit zurückzuführen,
die die Trends ansteigen ließ, gewissermaßen "on top" auf die klimatische Entwicklung.
Im Übrigen zeigen die Satellitenmessungen der Troposphäre keinen Rekordanstieg : beide Messreihen, sowohl UAH als auch RSS, geben 2015 nur als drittwärmstes Jahr seit 1979 an.
Dass die Troposphärentemperaturen langsamer steigen als die Bodentemperaturen ist ein Sachverhalt, den die Klimamodelle nicht reproduzieren. Sie erwarten es genau anders herum.
...
Was erwarten wir von 2016?
Zunächst werden die Temperaturen weiter hoch bleiben.
Die Wärme des ElNino ist noch vorhanden: Sie schlägt sich in verstärkter Wolkenbildung im Ostpazifik nieder. Diese latente Wärme wird erst später in den Weltraum abgestrahlt.
Der ganze Vorgang sollte noch etwa 4-5 Monate dauern,
dann werden die globalen Temperaturen sinken.
Es kündigt sich dann nämlich eine LaNina an. Dies ist nicht etwa das Gegenteil eines ElNino mit seiner Strömungsumkehr.
Vielmehr sind es "verstärkte Normalbedingungen".
Die Passatwinde wehen heftiger als normal und fördern sehr viel kühles Tiefenwasser vor Südamerika an die Oberfläche.
Dadurch wird ein Teil des erwärmten Wassers eines ElNino wieder in die Tiefe vor Indonesien verfrachtet und in die Oberflächentemperaturen geht eine große Kaltwasserfläche im äquatorialen Teil des Pazifiks ein.
In die globalen Temperaturen wird dieser doch recht heftige Umschwung sehr wahrscheinlich erst in 2017 voll durchschlagen.
Für klimatische Einschätzungen wird es so auch in 2017 noch zu früh sein, denn erst nach der zu erwartenden LaNina wird sich ein "neutrales Niveau" einstellen.
Wo das liegt ist noch unbestimmt.
Entwarnung im Atlantik
Erinnern Sie sich noch an die medial so "ausführlich" ausgeschlachteten Meldungen vom Frühjahr 2015, dass sich der Golfstrom dramatisch abgeschwächt hat durch das Schmelzen des Grönlandeises?
Wir hatten uns hier sehr kritisch mit einer Arbeit (Rahmstorf 2015) von Stefan Rahmstorf vom PIK und Kollegen auseinandergesetzt, die den neuerlichen Hype auslöste.
Die Süddeutsche Zeitung beispielsweise vermied das Wort "Katastrophe", zitierte jedoch die Autoren, die ihrer Besorgnis Ausdruck verliehen, dass stark reduzierte Atlantikströme "massive Folgen" für Mensch und Umwelt haben, ergänzten die Forscher.
Die Ökosysteme in den Meeren könnten gestört werden, was die Fischerei und die Lebensgrundlage vieler Menschen entlang der Küsten treffe.
Auch trügen Veränderungen zu einem regionalen Meeresspiegelanstieg etwa in den US-Städten New York und Boston bei.
Zudem seien auch Wetterveränderungen sowohl in Nordamerika als auch in Europa denkbar."
Im Januar 2015 erschien nun eine Arbeit von Parker & Ollier, die die Schlüsse von Rahmstorf2015 entschieden zurückweist.
Wie wir in unserem Artikel damals schon zeigten hatte Rahmstorf 2015 einen Stellvertreter ("Proxy") für die Stärke der AMOC (Atlantic Meridional Overturning Circulation, der Wärmetransport nach Norden) verwendet, der bei näherer Betrachtung offensichtlich Schwierigkeiten mit der Kausalität hatte: er reagierte auf AMOC- Veränderungen bevor diese eintraten.
Die Autoren der widerlegenden Arbeit um Albert Parker von der James Cook- Universität in Townsville, Australien verwendeten einen vertrauenserweckenden Parameter, der auch kürzere Schwankungen der AMOC gut abbildet.
-
EIKE Europäisches Institut für Klima und Energie
Klaus-Eckart Puls
2016-02-17 de Klima-Fakten 2015/16Das Jahr 2015 wurde von den Klima-Alarmisten in bewährtem engen Schulterschluß mit den deutschen(!) Medien zum "wärmsten Jahr aller Zeiten" und zum "endgültigen Klimasignal" hoch gejubelt. Jedoch - die Nachprüfung zeigt:
Es war ein so genannter "Super-El-Nino",
der die Temperatur trieb - wie zuletzt 1998. Eine nahezu verzweifelte Aktion, um nach 18 Jahren der Temperatur-Stagnation eine angeblich anthropogen verursachte Klima-Katastrophen-Hypothese zu retten, anhand eines einzigen Jahres.
Alle anderen Parameter machen auch nicht mit:
Weder die Stürme, noch die Sturmfluten, noch der Meeres-Anstieg!
EIKE Europäisches Institut für Klima und Energie
Quang M. Nguyen, P.E.
2016-02-16 de Wärmer, noch wärmer, am wärmsten - NOAA und NASA erwischt mit der Manipulation der AufzeichnungenFAZIT
Wie so häufig von den Mainstream-Medien seit April 2015 wiederholt, erklärten NOAA und NASA offiziell, dass 2015 heißer als 2014 war, das alte wärmste Jahr der Aufzeichnungen und "versprechen", dass 2016 heißer als 2015 sein könnte!
Jedoch, unleugbare Beweise zeigen, dass die von NOAA und der NASA berechneten durchschnittlichen globalen Temperaturen ungenau, unzuverlässig und nicht mit den Satellitendaten konsistent erscheinen.
1997 war das heißeste Jahr
Laut Daten der NOAA Website, war 1997 wirklich das heißeste Jahr der Aufzeichnung mit 16,9°C (62.45°F).
Die globale Durchschnittstemperatur im Jahr 2015 betrug 14,8°C (58.62°F) oder 2,12K (3.83F) von unter der Temperatur 1997. [... und unter der "Normal" Temperatur von 15°C gemäß PIK u.ä., der Übersetzer]
Nach den Daten der NOAA Website, haben die Parameter wie beispielsweise die Durchschnittstemperatur des 20. Jahrhunderts und der jährlichen Temperaturanomalien, die konstant sein müssten, unterschiedliche Werte in den jährlichen globalen Analysen.
Korrigierte historische Temperaturdaten
NOAA und NASA korrigierten historische Temperaturdaten und stellten Temperaturdaten in Gebieten ohne Temperaturaufzeichnung systematisch her, weit verbreitet und unidirektional zum "kühlen" der Vergangenheit, in dem Versuch, einen steigenden Temperaturtrend zu beweisen.
NOAA und NASAm diskreditieren ihre eigenen Satellitendaten.
NOAA und der NASA haben Anstrengungen unternommen, um ihre eigenen Satellitendaten zu diskreditieren - die im Einklang mit dem Ballon Daten sind - weil eine globale Erwärmung Pause seit 1998 im Widerspruch mit der von NOAA und der NASA bevorzugten Behauptung steht.
NOAA und NASA weigern sich die angeforderten Daten heraus zugeben
NOAA und NASA haben sich geweigert, die durch das US-Repräsentantenhaus für Wissenschaft, Weltraum und Technologie angeforderten Daten und Informationen heraus zugeben.
Es gibt keinen Grund für sie die Daten und Informationen, die öffentlich zugänglich sind, zurückzuhalten, es sei denn, sie haben etwas zu verbergen.
↑ 2015-12
Tremendous Cooling Of Northern Hemisphere Sea Surface Temperatures - Sharp Spell Of Global Cooling Ahead?
|
|
|

|
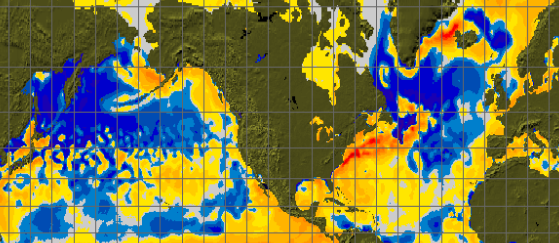
|
|
Today we see a powerful storm centered over Iceland that is pumping up yet more warmth - all the way to the North Pole. |
Wouldn't that pattern accelerate the surface cooling of the oceans at the mid and lower Atlantic latitudes ? Could this now protracted pattern have made the cooling in the Atlantic even more pronounced and explain in part why the North Atlantic has cooled? |
|
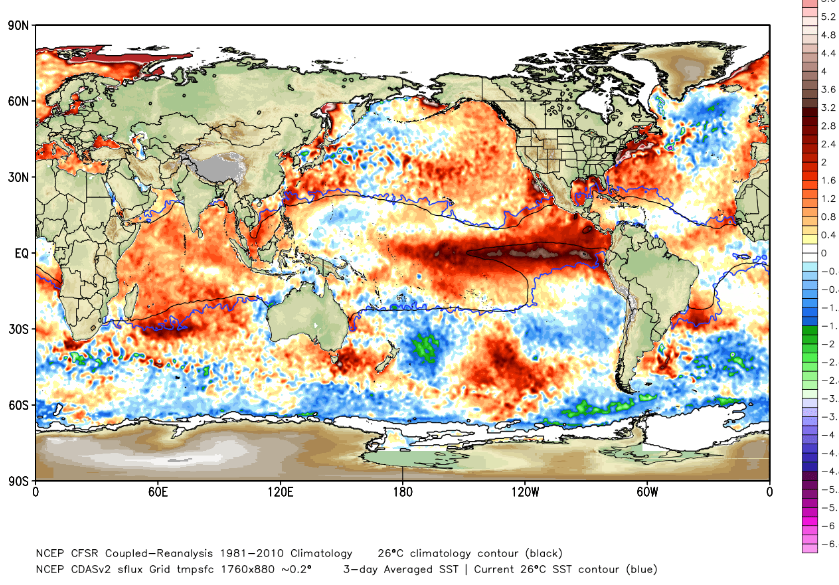
|
-
NoTricksZone (Pierre L. Gosselin)
2015-12-30 en Tremendous Cooling Of Northern Hemisphere Sea Surface Temperatures - Sharp Spell Of Global Cooling Ahead?
-
Basler Zeitung
2015-12-31 de Das Wetter, diese gefährliche Diva
-
Le Figaro
2015-12-31 fr Au Pôle Nord, le thermomètre affiche 20 degrés de plus que les normales de saison
-
EIKE Europäisches Institut für Klima und Energie
2016-01-01 de Sturm "ECKARD": Massenhysterie in den Medien - nicht in den Wetterstatistiken2016-01-06 de Die Klimaente zum Jahreswechsel Der Nordpol taut mitten im Winter
-
Die kalte Sonne (Fritz Vahrenholt & Sebastian Lüning)
2016-01-04 de Wirbel um den Polarwirbel: Klage gegen Wissenschaftsberater des US-Präsidenten wegen Klimaaktivismus eingereicht2016-01-16 de Wochenzeitung 'Die Zeit': Nordpol-Hitzewelle liegt nicht am Klimawandel
2016-01-17 de Wo bleibt die 'ungebremste' Erwärmung? Kein neuer Wärmerekord 2015 - trotz El Nino-Unterstützung
↑ 2015-07
-
Watts Up With That? (Anthony Watts)
2015-07-14 en July 2015 ENSO Update - Tropical Pacific at the Threshold of a Strong El Niño
↑ 2014-08
-
EIKE Europäisches Institut für Klima und Energie
2014-09-03 de FAZ: Bauchlandung für die Klimavorhersagen: El Nino flaut früh ab, kein Super-Klimachaos
↑ 2014-06
|
↑ 2014-02
-
Watts Up With That? (Anthony Watts)
Bob Tisdale
2014-02-15 en El Niño or La Nada for the 2014/15 ENSO Season
↑ 2011-10
-
Watts Up With That? (Anthony Watts)
2011-10-17 en NCEP ensemble forecast shows deep La Niña coming
We know that we are currently in a La Niña pattern
-
NOAA / Update prepared by Climate Prediction Center / NCEP
2011-10-17 en ENSO Cycle: Recent Evolution, Current Status and Predictions
↑ 2011-01
2010/2011: Überschwemmungen in Australien und Brasilien
|
|
-
EIKE Europäisches Institut für Klima und Energie
2011-01-24 de La Niña und El Niño, was sich dahinter verbirgt und was sie, wann auslöst - Die Sonne ist an allem schuldIn den vergangenen Tagen war viel in den Medien von katastrophalen Überschwemmungen in Brasilien und Australien zu hören, die zahlreiche Opfer unter der dortigen Bevölkerung forderten.
Sie werden mit dem Wetter-/Klimaphänomen La Niña in Verbindung gebracht.
Der Bericht zeigt auf, dass es sich dabei um natürliche, durch die Sonne unmittelbar ausgelöste Wetterereignisse handelt und dass die Medien, wieder einmal, in ihrer Berichterstattung mit Superlativen wie z.B. Jahrhunderthochwasser, stark übertreiben.
-
Die kalte Sonne (Fritz Vahrenholt & Sebastian Lüning)
2012-05-10 de Australische Überschwemmungen 2011 und 2012 haben natürliche Gründe: La Nina verstärkt durch die negative Phase der Pazifisch Dekadischen Oszillation (PDO)
-
Watts Up With That? (Antony Watts)
2011-01-23 en Will global warming survive a strong La Nina?A global temperature stagnation despite warm El Nino year 2010?
↑ 2010-12
2010-12: La Niña ist im November und Dezember 2010 kräftig geblieben
en 2010-12: NASA Satellites Capture a Stronger La Niña
|
The La Niña is evident by the large pool cooler than normal (blue
and purple) water stretching from the eastern to the central Pacific
Ocean, reflecting lower than normal sea surface heights. This La Niña has strengthened for the past seven months, and is one of the most intense events of the past half century
|
-
Klimaskeptiker Info
2011-01-15 de La Niña ist im November und Dezember 2010 kräftig gebliebenDie seit sieben Monaten bestehende la Niña, eine periodisch auftretende natürliche Klimavariation, ist auch in den letzten beiden Monaten kräftig geblieben, zeigen Satellitendaten der NASA.
La Niña wird durch kühle Temperaturen der Meeresoberfläche im tropischen Pazifik gekennzeichnet.
La Niña bleibt uns also noch ein wenig erhalten.
Damit dürften die globalen Temperaturanomalien der nächsten Monate recht gering ausfallen.
-
Watts Up With That? (Antony Watts)
2010-01-15 en NASA: La Niña has remained strongThe solid record of La Niña strength only goes back about 50 years and this latest event appears to be one of the strongest ones over this time period.
It is already impacting weather and climate all around the planet.
Although exacerbated by precipitation from a tropical cyclone, rainfalls of historic proportion in eastern Queensland, Australia have led to levels of flooding usually only seen once in a century.
The copious rainfall is a direct result of La Niña's effect on the Pacific trade winds and has made tropical Australia particularly rainy this year.
Earth's ocean is the greatest influence on global climate.
Only from space can we observe our vast ocean on a global scale and monitor critical changes in ocean currents and heat storage.
Continuous data from satellites like OSTM/Jason-2 help us understand and foresee the effects of ocean changes on our climate and on climate events such as La Niña and El Niño.
The latest report from NOAA's Climate Prediction Center (CPC) noted that "A moderate-to-strong La Niña continued during December 2010 as reflected by well below-average sea surface temperatures (SSTs) across the equatorial Pacific Ocean."
The CPC report said that La Niña is expected to continue well into the Northern Hemisphere spring 2011.
↑ 2010-05
Global wird 2010 eines der wärmsten Jahre seit Beginn der
Temperaturaufzeichnungen
en
WMO: 2010 warmest, but no statistically significant difference between
global temperatures in 2010, 2005 and 1998
-
Science-Skeptical Blog
2010-05-18 de El Niño schwächeltDer letzte Winter und der diesjährige Mai sind deutschlandweit bisher deutlich zu kalt ausgefallen.
Global wird 2010 aber eines der wärmsten Jahre seit Beginn der Temperaturaufzeichnungen erwartet.
Wie passt das zusammen? Des Rätsels Lösung sind die globalen Wettersysteme.
Der Stand der Dinge
Aktuell befinden wir uns in einer El Niño-Phase.
Eine Wetteranomalie, einhergehend mit warmen Oberflächenwasser im Zentral- und Ostpazifik. Diese Temperaturanomalie ist nun am ausklingen.
Neben dem El Niño gab es ein zweites Wetterereignis, welches vor allem in der Arktis in den letzten Monaten für hohe Temperaturen gesorgt hat, nämlich eine schwache Arktische Oszillation.
Der Winterindex der Arktischen Oszillation (AO) lag auf einem Rekordminimum und hat der Arktis Temperaturen beschert, die bis zu 4°C über dem langjährigen Referenzmittelwert lagen.
Auch diese Anomalie klingt nun langsam aus.
Der Arktis brachte das Rekordtief der winterlichen AO Wärme.
In weiten Teilen der USA, Asien und Europa hat die AO hingegen für winterliche Kälte gesorgt. Das haben wir auch in Deutschland zu spüren bekommen.
Global gesehen gab es durch die großflächigen Wärmeanomalien im Pazifik und der Arktis (Regionen, die weitgehend unbewohnt sind) jedoch ein Zwischenhoch der Globaltemperatur.
Der Ausblick?
Die National Oceanic and Atmospheric Administration (NOAA), die Wetter- und Ozeanografiebehörde der Vereinigten Staaten, prognostiziert für die nächsten Monate fallende Temperaturen im Pazifik und in der Arktis.
Tendenziell ist also mit einer sinkenden Globaltemperatur zu rechnen.
Überraschend kommt das nicht, denn Wettersysteme ändern sich in aller Regel zyklisch, einem Temperaturhoch folgt somit ein Temperaturtief.
-
Watts Up With That? (Antony Watts)
2011-01-20 en WMO: 2010 warmest, but no statistically significant difference between global temperatures in 2010, 2005 and 1998
-
World Meteorological Organization
2011-01-20 en Press Release No. 906Geneva, 20 January 2011 (WMO) - The year 2010 ranked as the warmest year on record, together with 2005 and 1998, according to the World Meteorological Organization.
Data received by the WMO show no statistically significant difference between global temperatures in 2010, 2005 and 1998.
Klimaerwärmung in Deutschland nicht nachweisbar: Der DWD hantiert mit falschen Daten - Eine Bestandsaufnahme der Deutschlandtemperaturen
-
EIKE Europäisches Institut für Klima und Energie
Raimund Leistenschneider
2010-12-05 de Klimaerwärmung in Deutschland nicht nachweisbar: Der DWD hantiert mit falschen Daten - Eine Bestandsaufnahme der DeutschlandtemperaturenIn unseren beiden Beiträgen am 04. und 14.10.2010 hatten wir Ihnen gezeigt, dass die DWD-Messstationen nicht annähernd das halten, was der DWD der Nation in Sachen Temperaturentwicklung glauben machen will - eine wissenschaftlich und somit korrekte Wiedergabe der Temperaturentwicklung in unserem Land
und wie das ZDF einzelne Warmstationen (Frankfurter Flughafen) herauspickt und daraus sein eigenes Wetter macht, welches weder mit der Realität, nicht einmal mit den DWD-Messwerten übereinstimmt.
In diesem Artikel zeigen wir Ihnen erstmalig den tatsächlichen Temperaturverlauf für Deutschland auf,
da es uns anhand einer Referenzstation des DWD gelungen ist, den Betrag des Wärmeinselseffekts (WI) für verschiedene Zeitepochen zu berechnen.
Die Datenquellen der Berechnungen stammen dabei vom Deutschen Wetterdienst.
Die tatsächliche Temperaturkurve für Deutschland für die letzten 130 Jahre wird auf EIKE erstmalig veröffentlicht.
Nicht nur die weltweit zunehmende Verlagerung der Temperaturmessstationen auf Flughäfen verfälscht die Messwerte deutlich nach oben und zwar bis um zu 2,5°C, wie wir in unseren beiden ersten Beiträgen zeigen konnten, sondern die schleichende Landschaftsveränderung und der Wärmeeintrag der Städte.
| Raimund Leistenschneider |
Physiker
▶Raimund Leistenschneider: Who is who (Skeptiker) |
↑ 2009-08
-
Skyfall / Changement Climatique
2009-08-30 fr Un épisode El Niño s'installe et persistera très probablement jusqu'à la fin de l'année.
de
2009-09: Schwacher El Niño könnte kalten Winter an der
US-Ostküste bedingen
en
U.S. Northeast May Have Coldest Winter in a Decade
de Schwacher El Niño könnte kalten Winter an der US-Ostküste bedingen
-
Klimaskeptiker Info
2009-09-29 de Schwacher El Niño könnte kalten Winter an der US-Ostküste bedingenDer gegenwärtige El Niño, eine warme Oberflächenströmung im tropischen Pazifik, die alle paar Jahre auftritt, fällt recht schwach aus.
Schwache El Niños sind aus den Erfahrungen der Vergangenheit bekannt dafür, daß sie von besonders kalten Wintern an der nordamerikanischen Ostküste begleitet werden.
en U.S. Northeast May Have Coldest Winter in a Decade
-
Bloomberg
2009-09-28 de U.S. Northeast May Have Coldest Winter in a DecadeThe U.S. Northeast may have the coldest winter in a decade because of a weak El Niño, a warming current in the Pacific Ocean
Weak El Niño are notorious for cold and snowy weather on the Eastern seaboard.
It could be one of the coldest winters, or the coldest, winter of the decade.
↑ 2009-07
-
Watts Up With That? (Anthony Watts)
2009-07-09 en NOAA announces the arrival of El Niño
↑ 2009-01
-
Watts Up With That? (Anthony Watts)
2009-01-20 en It's official: La Niña is back

