3.4.7 Temperatur (Wissenschaft)
en Temperature
fr Température
Mit folgenden Links wird von anderen Webseiten auf diese Seite verwiesen:
▶Temperatur (Wissenschaft)| de | en | fr |
|---|---|---|
|
Klimawandel: Wissenschaft Temperatur |
Climate change: Science Temperature |
Changement climatique: Science Température |
| Temperatur-Zyklen | Temperature Cycles | Cycles des températures |
| Temperatur und Wärmeinhalt der Ozeane | Temperatures and Heat content of the oceans | Températures et contenu thermique des océans |
|
Gefälschte Temperaturdaten Prinzip der Temperatur-Manipulationen Nachträgliche Temperatur-Manipulationen durch NASA-GISS |
||
Siehe Klimaschau in Welt-Info
⇧ de Verzeichnis en Contents fr Sommaire
- 1
de
Temperaturmessungen durch Satelliten
en Temperature measurements by satellites
fr Mesures de température par satellites - 2
de
Offizielle, weltweite, amtliche
Temperaturbestimmungen
en Official worldwide temperature measurement
fr Mesurages officielles des températures mondiales
- 3
Wood For Trees
- - de Allgemein / en General / fr Générale
- a de Temperaturen / en Temperatures / fr Températures
- b de CO₂ / en CO₂ / fr CO₂
- c
de
Sonnenfleckenzahl (Anzahl Sonnenflecken pro Monat)
en Sunspot Number (SSN, Monthly sunspot numbers)
fr Taches solaires (Nombre de taches par mois) - d
de
Kurzzeitzyklen der Temperatur im Vergleich zu CO₂
en Short-term cycles in temperature compared with CO₂
fr cycles de température à court terme par rapport au CO₂
- 4 UAH - University of Alabama in Huntsville
- 5 CRU - Climate Research Unit at the University of East Anglia (UEA)
- 6 GISS - Goddard Institute for Space Studies (NASA)
- 7 BEST - Berkeley Earth Surface Temperature
- 8 USHCN - United States Historical Climatology Network
- 9
de
Fehler in den Oberflächentemperaturen durch NCDC,
GISS et CRU
en Significant error in the global surface temp. analyses of NCDC, GISS & CRU
fr Erreurs dans les analyses de températures par NCDC, GISS et CRU - 10
de
Variationen der Erdoberflächentemperatur
in den letzten 140 Jahren
en Variations of the Earth's surface temperature for the past 140 years
fr Variations de la température de surface de la Terre au cours des 140 dernières années - 11
de
Dr. Syun Akasofu über die Prognosegenauigkeit des
IPCC
en Dr. Syun Akasofu on IPCC's forecast accuracy
fr Dr. Syun Akasofu sur l'exactitude des prévisions du GIEC - 12
de
Der Temperaturanstieg -
Die Lüge festgenagelt
en Reflections on the temperature increase
fr La montée en température - Le mensonge cloué - 13
de
Korrelation zwischen globaler
Temperatur und atmosphärischem CO₂
en Correlation between global temperature and atmospheric CO₂
fr Corrélation entre la température globale et le CO₂ atmosphérique - 14
de
Temperaturmessung und -Auswertung
en Temperature measurement and evaluation
fr Mesure et évaluation de la température - 15
de
Vier Schlüsseldiagramme für einen
Klimaskeptiker
en Four Key Charts for a Climate Change Skeptic
fr Quatre graphiques clés pour un sceptique du changement climatique
- 16
de
Prinzip der Temperatur-Manipulationen
en Principle of temperature manipulations
fr Principe des manipulations de température - 17
de
Gefälschte Temperaturdaten
en Temperature Data Fraud
fr Manipulation de températures - 18
de
Nachträgliche Temperatur-Manipulationen
en Subsequent temperature manipulations by NASA-GISS
fr Manipulations de température ultérieures par NASA-GISS - 19
de
Manifestationen
en Manifestations
fr Manifestations
- 20
de
Qualität der Temperaturdaten
en Station Site Quality Rating
fr Qualité des mesures de températures - 21
de
Wärmeinseln
en Urban Heat Islands
fr Îlots de chaleur urbain - 22
de
Wie man Temperaturen nicht misst
en How not to measure temperature
fr Comment on ne mesure pas les températures
- 23
de
Temperatur-Zyklen
en Temperature cycles
fr Cycles de température
- 24
de
Temperatur und Wärmeinhalt der Ozeane
en Temperature and heat content of the oceans
fr Températures et contenu thermique des océans
⇧ Welt-Info
⇧ de Allgemein en General fr Générale
Temperaturdaten
| de | en | fr |
|---|---|---|
|
Klima: Fragen Temperatur |
Climate: Questions Temperature |
Climat: Questions Température |
| de | en | fr |
|---|---|---|
|
Wetterphänomene Temperaturen |
Weather phenomena Temperatures |
Phénomènes météorologiques Tampératures |
| de | en | fr |
|---|---|---|
|
Klima: Wandel Temperatur der Erde |
Climate: Change Earth Temperature |
Climat: Changement Température de la terre |
Neuste Informationen & Erwärmungspause
| de | en | fr |
|---|---|---|
| Neuste Informationen über den Klimawandel | News on Climate Change | Nouvelles informations sur le changement climatique |
| Die Erwärmungspause | The Hiatus | La pause du réchauffement climatique |
Beobachtungen & Korrelationen
| de | en | fr |
|---|---|---|
|
Klima: Wandel Klima-Beobachtungen Korrelationen mit der Sonne |
Climate: Change Climate Observations Correlations with the Sun |
Climat: Changement Observations sur le climat Corrélations avec le soleil |
Fehler
| de | en | fr |
|---|---|---|
| Fehler der "Klimamacher", Teil I | Errors of the "Climatemakers", Part I | Erreurs des "faiseurs du climat", partie I |
| Fehlerhafte Temperatur-Messungen | Not reliable temperature measurements | Faux mesurages de températures |
| Links auf dieser Website | Links on this Website | Liens sur ce site web |
Manipulationen
| de | en | fr |
|---|---|---|
|
Klimawandel: Probleme Temperatur-Manipulationen |
Climate change: Problems Temperature Manipulations |
Climat: Problèmes Manipulation des températures |
Topics
|
Land-Oberflächentemperaturen |
|
|
|
▶Wood For Trees:
▶Temperaturen,
▶CO₂,
▶Sonnenflecken, |
|
|
|
|
en
World Surface Temperatures |
en
World temperature records available via Google Earth |
|
|
|
⇧
Begriffe und Definitionen
en Terms and definitions
fr Termes et définitions
| de | en | fr |
|---|---|---|
| Physikalische Grundlagen und Begriffe | Physical basis and terms | Bases physiques et termes |
| Begriffe | Terms | Termes |
⇧ de Text en Text fr Texte
⇧
1 Temperaturmessungen durch Satelliten
en Temperature measurements by satellites
fr Mesures de température par satellites
Links zur Klimaschau
|
|
Temperatur‑Manipulationen:
▶Probleme,
▶Wissenschaft
Wissenschaft: ▶Gefälschte Temperaturdaten Wissenschaft: ▶Nachträgliche Temperatur‑Manipulationen Wissenschaft: ▶Temperaturmessungen durch Satelliten Manifestationen: ▶Temperaturen Klima-Skandal: ▶Manipulationen |
- a de
Vergleich von Oberflächen- und Satelliten-Temperaturen
en Comparing surface and satellites - b Satellite Temperature Data
- c Ergebnis der Satellitenmessung
- d Why Does NASA Oppose Satellites?
Update: University of Alabama in Huntsville (UAH) lehnt fragwürdige Veränderungen am RSS-Satelliten-Temperaturdatensatz ab
↑
a Vergleich von Oberflächen- und Satelliten-Temperaturen
en Comparing surface and satellites
|
Vergleich von
Oberflächen- und
Satelliten-Temperaturen |
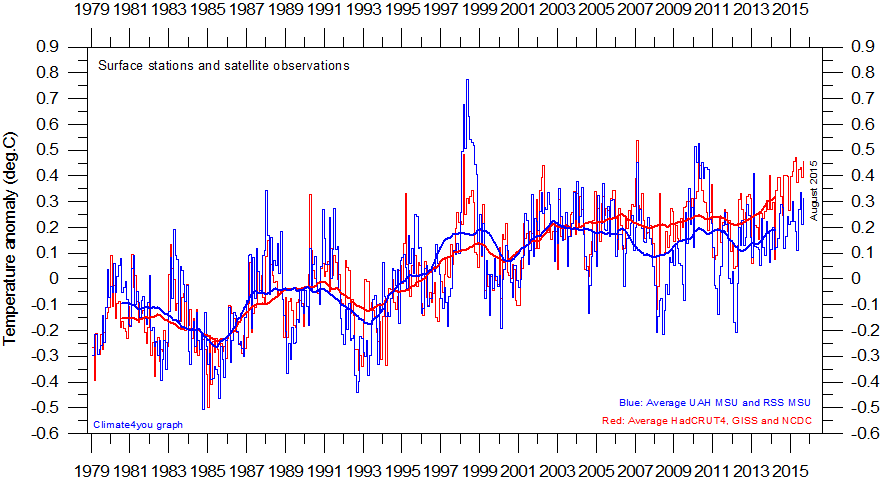
de Die seit 1979 von Satelliten gemessenen Temperaturen werden vom Weltklimarat und der Politik ignoriert.
Satellite measurement has a number of substantial advantages
over surface temperature measurement. |
Final 2015 Statistics (Now Includes December Data)
-
EIKE Europäisches Institut für Klima und Energie
2016-02-01 de Globale Mitteltemperatur! Abschluss-Statistik 2015: jetzt einschließlich Dezember 2015Eine der großen Schlagzeilen des Jahres 2015 sind die Rekorde brechenden Anomalien der Temperatur-Datensätze des Jahres 2015 im Vergleich zu den sich aus Satellitenbeobachtungen ergebenden Anomalien, die das Jahr 2015 an die dritte Stelle setzen.
Die Diskrepanz zwischen 1998 und 2015 zwischen beiden Quellen ist nunmehr größer denn je, wie man auf der Graphik rechts erkennt.
Man vergleiche die blauen Endpunkte mit den roten Endpunkten.
-
Watts Up With That? (Antony Watts)
2016-01-27 en Final 2015 Statistics (Now Includes December Data)One of the big stories from 2015 is the record shattering anomalies
on the surface temperature data sets for 2015
versus the third ranked satellite anomalies for 2015.
The discrepancy between 1998 and 2015 is now larger than it has ever been between the satellites and surface records as can be seen on the graphic above.
Compare the blue end points with the red end points.
Im Gegensatz zu erdgestützten Messungen zeigen die Ballon - und Satellitenmessungen im Mittel keine Erwärmung.
-
de Die verschiedenen Meßdaten (Thermometer Erde, Ballon und Satellit) sind nachfolgend zusammengestellt und zeigen die Tatsache, daß im Mittel erdgestützte Messungen eine Erwärmung, Ballon - und Satellitenmessungen keine Erwärmung zeigen.
-
en Here is the annual global averages of the surface and satellite records. Each has been adjusted to a common zero point in 1979 when satellite measurements began.
![]()
![]()
Im Gegensatz zu erdgestützten Messungen zeigen
die Ballon - und Satellitenmessungen im Mittel keine
Erwärmung.
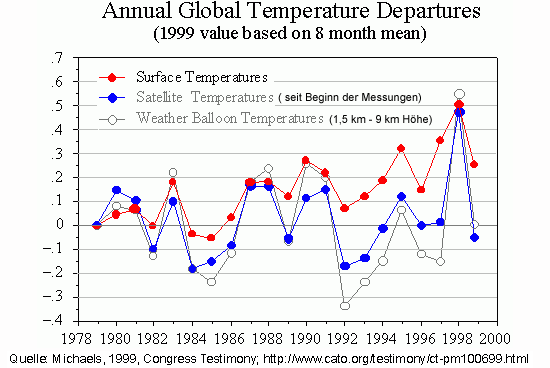
- Der Wasserplanet en Annual Global Temperature Departures
- john-daly.com en Data Sets Still at Odds
de
Messung der globalen Temperatur - Satelliten oder Thermometer?
en
Measuring global temperatures: Satellites or thermometers?
-
EIKE Europäisches Institut für Klima und Energie
Dr. Roy Spencer, The University of Alabama in Huntsville
2016-01-31 de Messung der globalen Temperatur - Satelliten oder Thermometer?
-
CFACT
Dr. Roy Spencer, University of Alabama in Huntsvill
2016-01-31 en Measuring global temperatures: Satellites or thermometers?
| de | en | fr |
|---|---|---|
| Neuste Informationen über den Klimawandel | News on Climate Change | Nouvelles informations sur le changement climatique |
| Die Erwärmungspause | The Hiatus | La pause du réchauffement climatique |
↑ b Satellite Temperature Data
de Seit Dezember 1978 liegen Temperaturdaten der TIROS-Wettersatelliten der amerikanischen Raumfahrtbehörde NASA vor.
-
Diese können natürlich nicht einfach ein Thermometer zur Erde herablassen, wieder einholen und ablesen, das sollte klar sein. Die Satelliten messen also zunächst nicht die Temperatur selbst, sondern einen indirekten Indikator, eine Strahlung einer bestimmten Wellenlänge.
Man hat sich dafür entschieden, die Mikrowellenstrahlung von Sauerstoffmolekülen in der Atmosphäre dafür heranzuziehen.
Daher bezeichnet man diese Daten auch als MSU-Daten
("Microwave Sounding Unit", das entsprechende Meßinstrument an Bord des Satelliten).
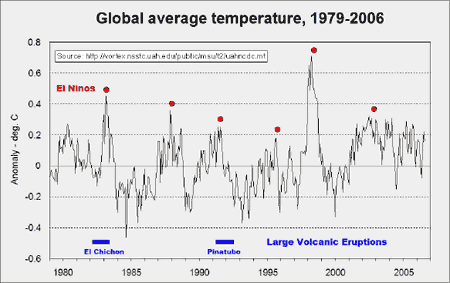
en In 1989, Dr. Roy Spencer and Dr. John Christy developed a global temperature data set from satellite microwave data beginning in 1979, which showed little or no warming above the surface.
-
Dr. Christy and Dr. Spencer addressed several climate issues including new regional surface temperature analysis, the effect of satellite adjustments on UAH temperature changes in the atmosphere, differences in these changes at various levels in the atmosphere, new (in-press) comparison results which enhance confidence in the UAH data and comparison results which enhance confidence in the UAH data, and our understanding of the causes of these changes and differences.
George C. Marshall Institute
2006-04-17 en Satellite Temperature Data
fr Température globale par satellite
-
Skyfall / Changement Climatique
2007-05-06 fr Température globale par satellite
| John R. Christy |
He is the Distinguished Professor of Atmospheric Science and
Director of the Earth System Science Center at the University
of Alabama in Huntsville. He was appointed Alabama's State Climatologist in 2000. For his development of a global temperature data set from satellites he was awarded NASA's Medal for Exceptional Scientific Achievement, and the American Meteorological Society's "Special Award." In 2002. Christy was elected Fellow of the American Meteorological Society. ▶John R. Christy: Who is who (Skeptiker) ▶John R. Christy: Video (Präsentationen) |
| Roy W. Spencer |
Ph.D. is a principal research scientist for the University of Alabama
in Huntsville and the U.S. Science Team Leader for the Advanced
Microwave Scanning Radiometer (AMSR-E) on NASA's Aqua satellite.
▶Roy W. Spencer: Who is who (Skeptiker) ▶Roy W. Spencer: Video (Präsentationen) ▶Roy W. Spencer: Websites (English) ▶Ausschluss und Maulkorb für Kritiker (The mission of NASA) |
↑
c Ergebnis der Satellitenmessung
en Result of the satellite measurement
fr Résultat des mesures par des satellites
de Die Messungen hatten ein Ergebnis, dass für die Klima-Erwärmungspropheten höchst überraschend war und entsprechend kritisch und sorgfältig analysiert wurde:
-
Für die Zeit seit 1979 kann man die "globale Erwärmung" mit gutem Gewissen als ein Märchen bezeichnen.
-
Die Satellitenmessungen stimmen untereinander auf 0.02°C, mit Ballonsondenmessungen auf 0.03°C überein.
-
Sie zeigen nur einen minimalen Anstiegstrend von 0.038°C pro Jahrzehnt seit 1979, also in der Zeit, in der der steilste Anstieg des CO2 in der Atmosphäre zu verzeichnen war.
-
Für die Zeit seit 1979 kann man die "globale Erwärmung" mit gutem Gewissen als ein Märchen bezeichnen.
- John Daly en The Satellite Record 1979-2008
-
Alvo v. Alvensleben
(aus Dimagb) de Temperaturmessungen von Satelliten aus
(aus Schulphysik) de Kohlendioxid und Klima
↑ d Why Does NASA Oppose Satellites?
-
en One of the ironies of climate science is that perhaps the most prominent opponent of satellite measurement of global temperature is James Hansen, head of ... wait for it ... the Goddard Institute for Space Studies at NASA!
As odd as it may seem, while we have updated our technology for measuring atmospheric components like CO2, and have switched from surface measurement to satellites to monitor sea ice, Hansen and his crew at the space agency are fighting a rearguard action to defend surface temperature measurement against the intrusion of space technology.
For those new to the topic, the ability to measure global temperatures by satellite has only existed since about 1979, and is admittedly still being refined and made more accurate.
However, satellite measurement has a number of substantial advantages over surface temperature measurement:
-
It is immune to biases related to the positioning of surface temperature stations, particularly the temperature creep over time for stations in growing urban areas.
-
It is relatively immune to the problems of discontinuities as surface temperature locations are moved.
-
It is much better geographic coverage, lacking the immense holes that exist in the surface temperature network.
Anthony Watts has done a fabulous job of documenting the issues with the surface temperature measurement network in the US, which one must remember is the best in the world.
-
-
Climate Skeptic
2008-07-19 en Why Does NASA Oppose Satellites? A Modest Proposal For A Better Data Set
-
Real Science (Steven Goddard)
2016-02-07 en The Wrong StufflFour years ago, the people with The Right Stuff sent this letter to NASA satellite deniers James Hansen and Gavin Schmidt, who are completely destroying the agency's reputation with their junk science.
March 28, 2012
Letter to The Honorable Charles Bolden, Jr. NASA Administrator NASA Headquarters Washington, D.C. 20546-0001We, the undersigned, respectfully request that NASA and the Goddard Institute for Space Studies (GISS) refrain from including unproven remarks in public releases and websites.
We believe the claims by NASA and GISS, that man-made carbon dioxide is having a catastrophic impact on global climate change are not substantiated, especially when considering thousands of years of empirical data.
With hundreds of well-known climate scientists and tens of thousands of other scientists publicly declaring their disbelief in the catastrophic forecasts, coming particularly from the GISS leadership, it is clear that the science is NOT settled.
The unbridled advocacy of CO2 being the major cause of climate change is unbecoming of NASA's history of making an objective assessment of all available scientific data prior to making decisions or public statements.
As former NASA employees, we feel that NASA's advocacy of an extreme position, prior to a thorough study of the possible overwhelming impact of natural climate drivers is inappropriate.
We request that NASA refrain from including unproven and unsupported remarks in its future releases and websites on this subject.
At risk is damage to the exemplary reputation of NASA, NASA's current or former scientists and employees, and even the reputation of science itself.
For additional information regarding the science behind our concern, we recommend that you contact Harrison Schmitt or Walter Cunningham, or others they can recommend to you.
⇧
2 Offizielle, weltweite, amtliche Temperaturbestimmungen
en
Official worldwide temperature measurement
fr
Mesurages officielles des températures mondiales
- a Die von Satelliten gemessenen Temperaturen werden ignoriert
- b Die Entwicklung der globalen Temperaturen seit 1860
- c de
Globale Temperaturen -
Erfindung von Daten mit Erwärmung dort, wo es gar keine gibt
en Meshing issues on global temperatures - warming data where there isn't any
↑ a Die von Satelliten gemessenen Temperaturen werden ignoriert
|
|
|
-
de Die seit 1979 von Satelliten gemessenen Temperaturen werden vom Weltklimarat und der Politik ignoriert.
Die von Satelliten tasten die gesamte Erdoberfläche ab.
Die gemessenen Temperaturen zeigen keinen Temperaturanstieg.Derzeit wird alles versucht, den Temperaturumschwung zu vertuschen.
Tatsächlich wurden bei der Meldung vom wärmsten März 2008 nur die Landtemperaturen verwendet. Die Satelliten zeigen keinen Anstieg bis zum März 2008. Und der Trend der Abkühlung auf der Südhalbkugel 2007 geht weiter. Im April 2008 herrschten in Australien die kältesten Temperaturen seit 60 Jahren.
↑ b Die Entwicklung der globalen Temperaturen seit 1860
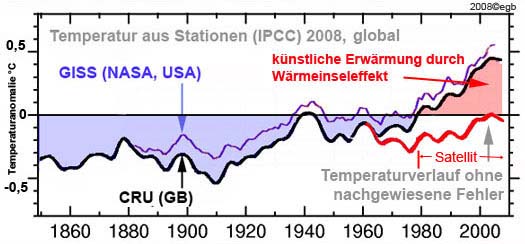
Die Entwicklung der globalen Temperatur in Bodennähe seit 1860
-
de Um 1860 endete eine Jahrhunderte lange Phase globaler Abkühlung, die "Kleine Eiszeit", die mit großen Gletschervorstößen verbunden war.
Seitdem stieg die globale Temperatur, gemessen in 2 m Höhe über dem Erdboden, um etwa 0.6 °C ±0.2 °C bis 1930.
Parallel dazu gingen die kontinentalen Gletscher stark zurück.
Von 1940 bis 1975 nahm die Lufttemperatur wieder um etwa 0.2 °C ab und stieg ab 1975 wieder auf Werte, wie sie zwischen 1930 und 1940 gemessen wurden. Dies gilt jedenfalls für den Bereich der Erde, aus dem die genauesten Messungen der bodennahen Lufttemperatur stammen, und in denen das dichteste Meßnetz bestand, nämlich die USA.
Satellitendaten ab 1979
-
de Seit 1979 kann man die Lufttemperatur von Satelliten aus messen und hat so erstmalig die Möglichkeit, die Temperatur der ganzen Erdatmosphäre, nicht nur die über den Kontinenten zu messen.
Zur Messung benutzt wird die Emission von Sauerstoffmolekülen, die ein sehr genaues Thermometer darstellt. An den Messungen sind ständig mindestens 2 Satelliten (mit gewöhnlich 4 Jahren Lebensdauer) beteiligt, deren Ergebnisse untereinander verglichen werden.
Die Meßmethode erlaubt sogar, zwischen verschiedenen Höhenbereichen, nämlich der Troposphäre und der Stratosphäre, zu unterscheiden.
Die Satellitendaten ab 1979 lassen keinen Temperaturanstieg erkennen.
Quelle: IPCC, ergänzt von John DalyAlvo v. Alvensleben
(aus Dimagb) de Temperaturmessungen von Satelliten aus
(aus Schulphysik) de Kohlendioxid und Klima
-
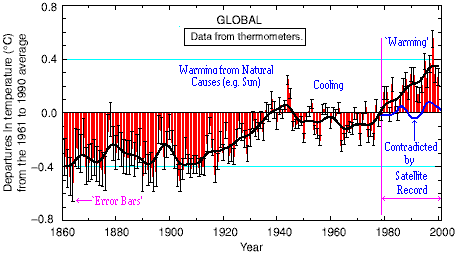
en This chart of global temperature as determined from surface thermometers was published in the latest `Summary for Policymakers' by the IPCC, with blue and purple labelling added by this website.
It illustrates one of the key points of contention between the advocates of global warming and the 'skeptics'.
The surface chart was mostly compiled by Tom Wigley and Phillip Jones, and it shows a +0.6°C warming from 1860 to 2000.
- john-daly.com en Wigley's Surface Record
-
en "If I go back now and look at that record of global warming, it's true that over the period from about 1910 to 1940, there was very substantial warming, so much so that it cannot have been due only to human activities.
But there are two other possibilities. It could be due to changes in the output of the sun. And, in fact, we believe that this is the primary reason for that warming."
PBS TV en Interview: Tom M. L. Wigley
↑
c Globale Temperaturen -
Erfindung von Daten mit Erwärmung dort, wo es gar keine gibt
en
Meshing issues on global temperatures -
warming data where there isn't any
-
EIKE Europäisches Institut für Klima und Energie
Tim Crome / Chris Frey
2017-11-18 de Globale Temperaturen - Erfindung von Daten mit Erwärmung dort, wo es gar keine gibt
-
Watts UP With That? (Antony Watts) / Tim Crome
2017-11-10 en Meshing issues on global temperatures - warming data where there isn't any
⇧ 3 Wood For Trees
Mit folgendem Link wird von anderen Webseiten auf diese Seite verwiesen.
▶Wood For Trees:
▶Temperaturen,
▶CO₂,
▶Sonnenflecken,
▶Kurzzeitzyklen der Temperatur im Vergleich zu CO₂
de Allgemein en General fr Générale
-
Wood For Trees
en Home
de Verzeichnis en Contents fr Sommaire
- a de Temperaturen / en Temperatures / fr Températures
- b de CO₂ / en CO₂ / fr CO₂
- c
de
Sonnenfleckenzahl (Anzahl Sonnenflecken pro Monat)
en Sunspot Number (SSN, Monthly sunspot numbers)
fr Taches solaires (Nombre de taches par mois) - d
de
Kurzzeitzyklen der Temperatur im Vergleich zu CO₂
en Short-term cycles in temperature compared with CO₂
fr cycles de température à court terme par rapport au CO₂
de Text en Text fr Texte
↑
a Temperaturen
en Temperatures
fr Températures
- Wikipedia en HadCRUT
-
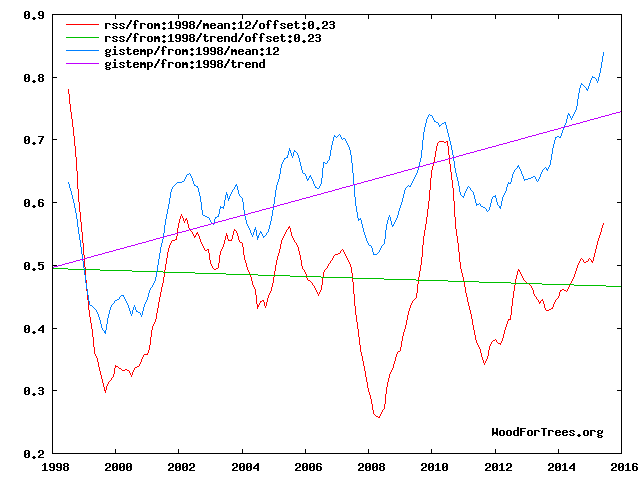
en HADCRUT4 variance-adjusted global mean:
The global temperature data from 1850 which most people start with.
-
WoodForTrees Temperature Index (WTI)
Created from the mean of HADCRUT4GL, GISTEMP, RSS and UAH
![]()
![]() HADCRUT 4 global mean <hadcrut4gl>
HADCRUT 4 global mean <hadcrut4gl>
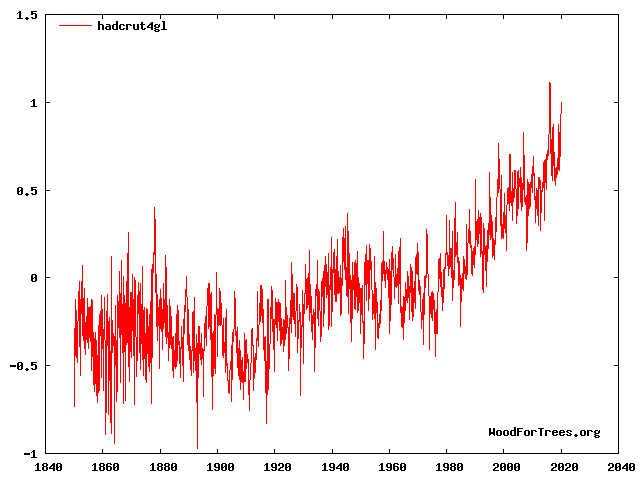
![]()
![]() WoodForTrees Temperature Index (WTI)
WoodForTrees Temperature Index (WTI)
(Created from the mean of HADCRUT4GL, GISTEMP, RSS and UAH)

![]()
![]() HADCRUT3 variance-adjusted global mean
HADCRUT3 variance-adjusted global mean
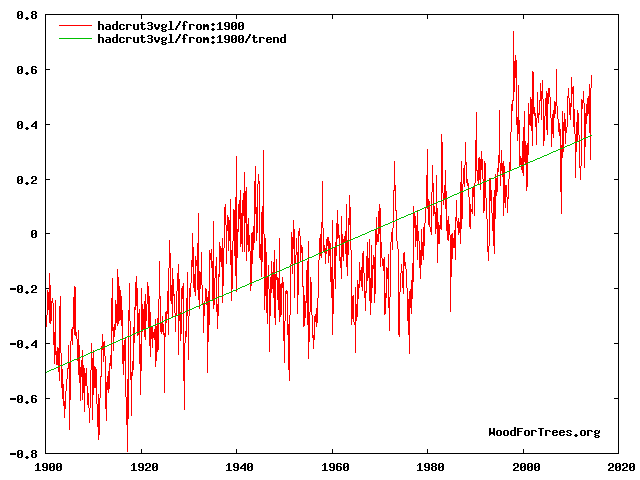
![]()
![]() HADCRUT 4 global mean - 1980-2020
HADCRUT 4 global mean - 1980-2020

![]()
![]() HADCRUT3 variance-adjusted global mean
HADCRUT3 variance-adjusted global mean

![]()
![]() HADCRUT 4 global mean - 2002-2015
HADCRUT 4 global mean - 2002-2015
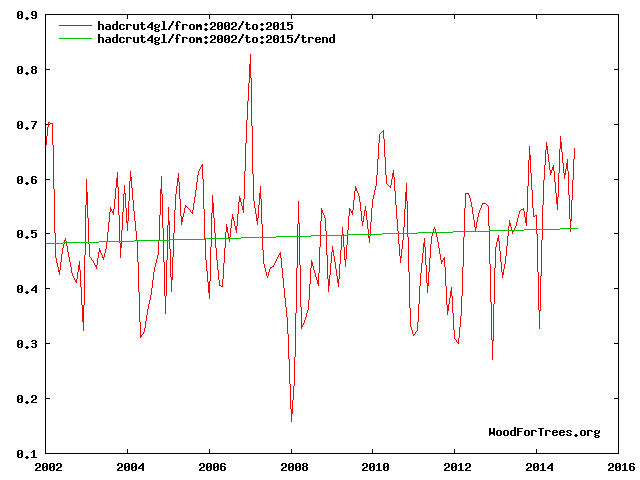
![]()
![]() HADCRUT 4 global mean - 2015-2020
HADCRUT 4 global mean - 2015-2020
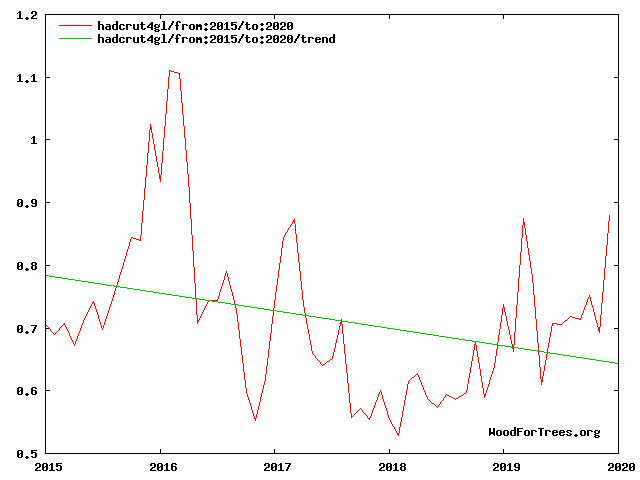
↑
b CO₂
en
CO₂
fr
CO₂
-
en ESRL CO₂:
Mauna Loa CO₂ monthly average readings since 1958. -
CO₂ Earth en Neueste Täglich CO₂
![]()
![]() ESRL CO2 (Mauna Loa) interpolated mean - 1950
ESRL CO2 (Mauna Loa) interpolated mean - 1950
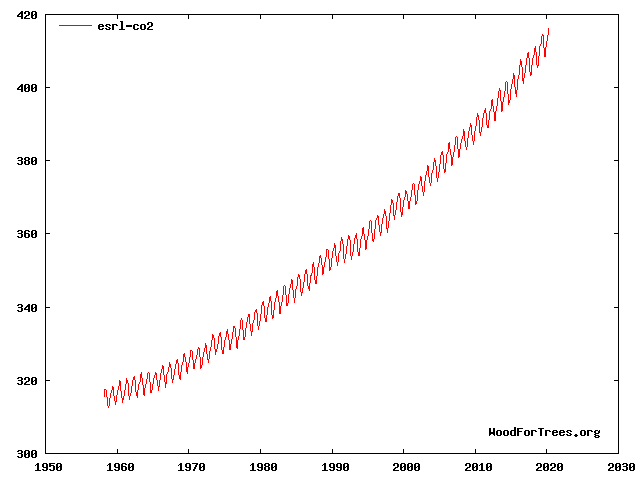
![]()
![]() ESRL CO2 (Mauna Loa) interpolated mean - 2010-2021
ESRL CO2 (Mauna Loa) interpolated mean - 2010-2021

![]()
![]() ESRL CO2 (Mauna Loa) interpolated mean - 2017-2021
ESRL CO2 (Mauna Loa) interpolated mean - 2017-2021

↑
c Sonnenfleckenzahl (Anzahl Sonnenflecken pro Monat)
en
Sunspot Number (SSN, Monthly sunspot numbers)
fr
Taches solaires (Nombre de taches par mois)
-
en SIDC Sunspot Number (SSN):
Monthly sunspot numbers since 1750. -
SIDC en Solar Influences Data Analyses Center INFO
The SIDC is part of the Royal Observatory of Belgium
and a partner in the Solar Terrestrial Center of Excellence (STCE).
↑
d Kurzzeitzyklen der Temperatur im Vergleich zu CO₂
en
Short-term cycles in temperature compared with CO₂
fr
Cycles de température à court terme par rapport au CO₂
![]()
![]() ESRL CO2 (Mauna Loa) interpolated mean
ESRL CO2 (Mauna Loa) interpolated mean

⇧ 4 UAH - University of Alabama in Huntsville
- a UAH Globally Averaged Satellite-Based Temperatur of Lower Atmosphere Jan 1979-September 2008
- b John R. Christy : U.S. House Committee on Resources, 13 May 2003
- c en Skeptical Science
- d KlimaNotizen
- e fr Pensée unique
↑ a UAH Globally Averaged Satellite-Based Temperatur of Lower Atmosphere Jan 1979-September 2008
-
Weatherquestions Com / Roy-Spencer
2008-10-08 en UAH Globally Averaged Satellite-Based Temperatur of Lower Atmosphere Jan 1979-September 2008
| Roy W. Spencer |
Ph.D. is a principal research scientist for the University of Alabama
in Huntsville and the U.S. Science Team Leader for the Advanced
Microwave Scanning Radiometer (AMSR-E) on NASA's Aqua satellite.
▶Roy W. Spencer: Who is who (Skeptiker) ▶Roy W. Spencer: Video (Präsentationen) ▶Roy W. Spencer: Websites (English) ▶Ausschluss und Maulkorb für Kritiker (The mission of NASA) |
↑ b John R. Christy : U.S. House Committee on Resources, 13 May 2003
de Aussagen:
-
de Angesichts der derzeitigen heftigen Kontroverse über die Frage aus Satellitendaten abgeleiteter Troposphärentemperaturen geben wir an dieser Stelle im Interesse der Öffentlichkeit und mit Dr. Christys Erlaubnis die schriftliche Stellungnahme wieder, die er zu diesem Thema gegenüber dem Ressourcenausschuss des US-Repräsentantenhauses abgab.
Die beobachteten Erwärmungsmuster, durch den Vergleich der Temperatur am Boden und in der Atmosphäre, zeigen nicht die typischen Merkmale eines Treibhauseffekts. Man kann nicht die Tatsache leugnen, der Einfluss des Menschen ist nicht entscheidend und die Zunahme des CO2 ist ein vernachlässigbarer Faktor bei der Klimaerwärmung.
en Statements:
-
The observed pattern of warming, comparing surface and atmospheric temperature trends, does not show the characteristic fingerprint associated with greenhouse warming.
The inescapable conclusion is that the human contribution is not significant and that observed increases in carbon dioxide and other greenhouse gases make only a negligible contribution to climate warming.
-
The concentration of carbon dioxide (CO2) is increasing in the atmosphere due primarily to the combustion of fossil fuels. Fortunately (because we produce so much of it) CO2 is not a pollutant.
As an aside, it is clear that other emissions may be called pollutants, e.g. sulfur oxides, nitrogen oxides and mercury. Controlling these is a completely separate issue from controlling emissions of CO2 and so will not be discussed here.
The conclusion in IPCC 2001 that human induced global warming was clearly evident was partly based on a depiction of the Northern Hemisphere temperature since 1000 A.D. This depiction showed little change until about 1850, then contains a sharp upward rise, suggesting that recent warming was dramatic and linked to human effects.
Since IPCC 2001, two important papers have shown something else.
Using a wider range of information from new sources these studies now indicate large temperature swings have been common in the past 1000 years and that temperatures warmer than today's were common in 50-year periods about 1000 years ago.These studies suggest that the climate we see today is not unusual at all.
John R. Christy : U.S. House Committee on Resources, 13 May 2003
en Written Testimony
| John R. Christy |
He is the Distinguished Professor of Atmospheric Science and
Director of the Earth System Science Center at the University
of Alabama in Huntsville. He was appointed Alabama's State Climatologist in 2000. For his development of a global temperature data set from satellites he was awarded NASA's Medal for Exceptional Scientific Achievement, and the American Meteorological Society's "Special Award." In 2002. Christy was elected Fellow of the American Meteorological Society. ▶John R. Christy: Who is who (Skeptiker) ▶John R. Christy: Video (Präsentationen) |
↑ c en Skeptical Science
de Satellite zeigen seit 1979 nur eine kleine bis gar keine Erwärmung in der Troposphäre
en Satellite show since 1979 little to no warming in the troposphere
-
Satellite measurements indicate an absence of significant global warming since 1979, the very period that human carbon dioxide emissions have been increasing rapidly.
The satellite data signal not only the absence of substantial human-induced warming but also provide an empirical test of the greenhouse hypothesis - a test that the hypothesis fails.
fr Les satellites montrent depuis 1979 une faible ou pas de réchauffement dans la troposphère
- Skeptical Science en Satellite show little to no warming in the troposphere
↑ d KlimaNotizen
Dr. John Christy und Dr. Roy Spencer von der University of Alabama liefern seit 25 Jahren der weltweiten Forschergemeinde die Ergebnisse ihrer Satellitenbeobachtungen. Beide Forscher sind anerkannt und haben viele wissenschaftliche Arbeiten veröffentlicht.
-
Seit 1979 wird die Temperatur auf der Erde flächendeckend durch Satelliten gemessen.
Die dadurch ermittelten Temperaturtrends sind brisant.
Sie zeigen lediglich eine weltweite schwache Erwärmung.Als Grundlage für eine Warnung vor der Klimakatastrophe werden sie daher nicht verwendet.
Denn sie widersprechen den Temperaturtrends, die weltweit durch Messstationen auf der Erdoberflächer ermittelt werden und die deutlich höher sind.Die Satellitenmessungen werden auch in kaum einem Medium in der Öffentlichkeit erwähnt.
Bei einer eigenen Meinungsbildung sollten sie jedoch mit einbezogen werden.
↑ e fr Pensée unique
-
Pensée unique fr
Les grands indicateurs du climat
1 Les relevés de température
⇧ 5 CRU - Climate Research Unit at the University of East Anglia (UEA)
- a CRU - Combined global land and marine surface temperature
- b The Climate Research Unit (CRU) at the University of East Anglia (UEA)
↑ a CRU - Combined global land and marine surface temperature
Erklärung zu den Datensätzen:
Einer der wichtigsten globalen Temperaturdatensätze stammt vom Hadley Centre des britischen meteorologischen Dienstes in Zusammenarbeit mit der Climate Research Unit (CRU) der University of East Anglia.
- Während das Hadley Centre für die Meeresoberflächentemperaturen zuständig ist,
- kümmert sich die CRU um die Temperaturen auf den Kontinenten.
-
Zusammen geben sie den sogenannten
HadCRUT-Datensatz heraus.
-
Wood for Trees
en Interactive Graphs
-
Wood for Trees
↑ b The Climate Research Unit (CRU) at the University of East Anglia (UEA)
-
CRU - Climate Research Unit
UEA - School of Environmental Sciences University of East Anglia
en Home
en Temperature
en Global Temperature Record
⇧ 6 GISS - Goddard Institute for Space Studies (NASA)
- a GISS: Weather Station Data: raw or adjusted?
- b GISS 1999 vs 2008 Data interpretation
- c USHCN raw data vs GISS homogenized
- d Questions on GISS Ocean Surface temperatures
- e GISS Releases September 2008 Data
- f The NASA Goddard Institute for Space Studies (GISS
- g Why Does NASA Oppose Satellites?
↑ a GISS: Weather Station Data: raw or adjusted?
-
Klimaskeptiker Info
2008-06-05 en Malen nach Zahlen: Das eigenartige Thermometer der NASA 2008-11-14 en Fragwürdige "Evolution" der GISS-Daten 2009-06-28 en GISS-Manipulationen: Temperaturtrend um 25% zu hoch 2009-07-20 en GISS "korrigiert" mit wenigen Meßstationen den großen Rest 2009-07-22 en Beeinflußt schon der erste Verarbeitungsschritt den Temperaturtrend beim GISS?
-
Watts Up With That? (Antony Watts)
2008-11-14 en Questions on GISS temperature product 2009-01-25 en "The hardest part is trying to influence the nature of the measurements obtained ... 2009-03-22 en Weather Station Data: raw or adjusted? 2009-07-20 en And now, the most influential station in the GISS record is ... 2009-12-11 en GISS "raw" station data - before and after 2010-01-14 en Newly released FOIA'd emails from Hansen and GISS staffers show disagreement over 1998-1934 U.S. temperature ranking
↑ b GISS 1999 vs 2008 Data interpretation
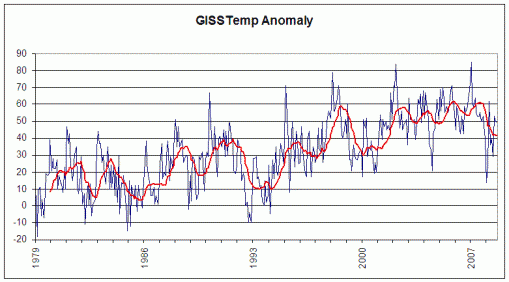
GISS: "The hardest part is trying to influence the nature of the measurements obtained ..."
-
de Es ist nicht neu, daß bei James Hansens GISS die Temperaturdatenreihe dahin "angepaßt" wurde, daß das offenbar gewünschte Ergebnis eines Temperaturanstiegs im späten 20. Jahrhundert damit unterstützt wird.
Bob Tisdale hat jetzt untersucht, wie der Temperaturtrend für die zusammenhängenden 48 US-Bundesstaaten sich durch die "Anpassung" verändert.
Das Ergebnis seiner Berechnungen: Der Temperaturtrend von 1880 bis 1999 vor den Anpassungen lag bei 0,035°C Temperaturanstieg pro Dekade (also 0,35°C pro Jahrhundert), nach den Anpassungen errechnet sich der Wert zu 0,044°C pro Dekade (0,44°C pro Jahrhundert).
Der Trend wird also durch den GISS-Eingriff in die Daten um 25% verstärkt.
Klimaskeptiker Info
2009-06-28 de GISS-Manipulationen: Temperaturtrend um 25% zu hoch
-
en Before the post-1999 GISS adjustments to the Contiguous U.S. GISTEMP data, the linear trend for the period of 1880 to 1999 was 0.035 deg C/decade. After the adjustments, the linear trend rose to 0.044 deg C/decade.
2009-06-28 en NASA GISS: adjustments galore, rewriting U.S. climate history"
-
Watts Up With That? (Antony Watts)
2008-11-14 en Questions on GISS temperature product
2009-01-25 en "The hardest part is trying to influence the nature of the measurements obtained ..."
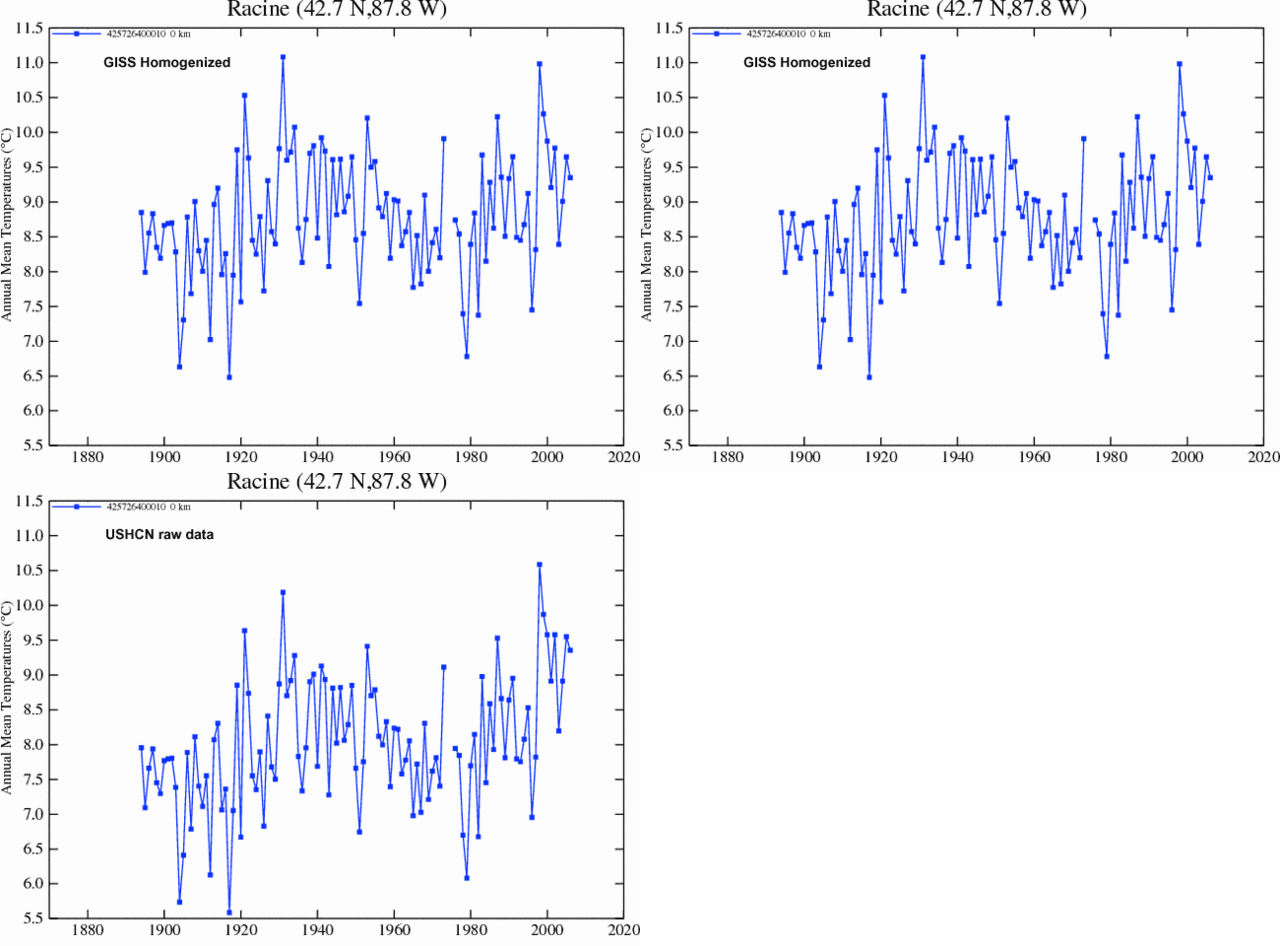
↑ c USHCN raw data vs GISS homogenized
- Surfacestations Org en Racine USHCN raw data/GISS homogenized
-
Watts Up With That? (Antony Watts)
2009-01-25 en James Hansen's 1988 Forecast
| James (Jim) E. Hansen |
Dr., Former Head of NASA Goddard Institute for Space Studies
in New York City
He also serves as Al Gore's science advisor
▶James (Jim) E. Hansen: Who is who (Aktivisten der anthropogenen Globalen Erwärmung) ▶Ausschluss und Maulkorb für Kritiker (Das renommierte amerikanische Museum für nationale Geschichte (AMNH) in New York Opfer des Klimakriegs) |
↑ d Questions on GISS Ocean Surface temperatures
| de | en | fr |
|---|---|---|
| GISS - Goddard Institute for Space Studies (NASA) | GISS - Goddard Institute for Space Studies (NASA) | GISS - Goddard Institute for Space Studies (NASA) |
| GISS-Oberflächentemperaturen | GISS-Surface temperatures | GISS-Températures des surfaces |
↑ e GISS Releases September 2008 Data
-
Watts Up With That? (Antony Watts)
2008-10-08 en GISS Releases September 2008 Data
↑ f The NASA Goddard Institute for Space Studies (GISS)
-
The NASA Goddard Institute for Space Studies (GISS),
at Columbia University in New York City,
is a laboratory of the Earth Sciences Division of NASA's Goddard Space Flight Center
and a unit of the Columbia University Earth Institute.
en Home
en GISS Surface Temperature Analysis
↑ g Why Does NASA Oppose Satellites?
-
en One of the ironies of climate science is that perhaps the most prominent opponent of satellite measurement of global temperature is James Hansen, head of ... wait for it ... the Goddard Institute for Space Studies at NASA!
As odd as it may seem, while we have updated our technology for measuring atmospheric components like CO2, and have switched from surface measurement to satellites to monitor sea ice, Hansen and his crew at the space agency are fighting a rearguard action to defend surface temperature measurement against the intrusion of space technology.
For those new to the topic, the ability to measure global temperatures by satellite has only existed since about 1979, and is admittedly still being refined and made more accurate.
However, satellite measurement has a number of substantial advantages over surface temperature measurement:
-
It is immune to biases related to the positioning of surface temperature stations, particularly the temperature creep over time for stations in growing urban areas.
-
It is relatively immune to the problems of discontinuities as surface temperature locations are moved.
-
It is much better geographic coverage, lacking the immense holes that exist in the surface temperature network.
Anthony Watts has done a fabulous job of documenting the issues with the surface temperature measurement network in the US, which one must remember is the best in the world.
-
-
Climate Skeptic
2008-07-19 en Why Does NASA Oppose Satellites? A Modest Proposal For A Better Data Set
-
Real Science (Steven Goddard)
2016-02-07 en The Wrong StufflFour years ago, the people with The Right Stuff sent this letter to NASA satellite deniers James Hansen and Gavin Schmidt, who are completely destroying the agency's reputation with their junk science.
March 28, 2012
Letter to The Honorable Charles Bolden, Jr. NASA Administrator NASA Headquarters Washington, D.C. 20546-0001We, the undersigned, respectfully request that NASA and the Goddard Institute for Space Studies (GISS) refrain from including unproven remarks in public releases and websites.
We believe the claims by NASA and GISS, that man-made carbon dioxide is having a catastrophic impact on global climate change are not substantiated, especially when considering thousands of years of empirical data.
With hundreds of well-known climate scientists and tens of thousands of other scientists publicly declaring their disbelief in the catastrophic forecasts, coming particularly from the GISS leadership, it is clear that the science is NOT settled.
The unbridled advocacy of CO2 being the major cause of climate change is unbecoming of NASA's history of making an objective assessment of all available scientific data prior to making decisions or public statements.
As former NASA employees, we feel that NASA's advocacy of an extreme position, prior to a thorough study of the possible overwhelming impact of natural climate drivers is inappropriate.
We request that NASA refrain from including unproven and unsupported remarks in its future releases and websites on this subject.
At risk is damage to the exemplary reputation of NASA, NASA's current or former scientists and employees, and even the reputation of science itself.
For additional information regarding the science behind our concern, we recommend that you contact Harrison Schmitt or Walter Cunningham, or others they can recommend to you.
⇧ 7 BEST - Berkeley Earth Surface Temperature
↑
S. Fred Singer: Warum BEST die Klimadebatte nicht lösen wird
en Why BEST Will Not Settle the Climate Debate
-
EIKE Europäisches Institut für Klima und Energie / S. Fred Singer
2011-12-01 de Warum BEST die Klimadebatte nicht lösen wirdDie globale Erwärmung ist wieder einmal in das öffentliche Bewusstsein gerückt, teils auch wegen des Aufruhrs um die Veröffentlichung der Erwärmung zeigenden Resultate des Berkeley Earth Surface Temperature (BEST) Projektes.
Die "Warmisten" jubelten und lagen doch völlig falsch.
Werden sie es jemals lernen?
-
Watts UP With That? (Antony Watts) / S. Fred Singer
2011-11-17 en Why BEST Will Not Settle the Climate Debate
Quelle/ Source
-
American Thinker / S. Fred Singer
2011-11-17 en Why BEST Will Not Settle the Climate DebateGlobal warming has re-entered public consciousness in recent days, partly because of the buzz surrounding the release of warming results from the Berkeley Earth Surface Temperature (BEST) project.
The reaction of the "warmistas" has been jubilant, yet hilariously wrong. Will they ever learn?
⇧ 8 USHCN - United States Historical Climatology Network
↑
a Über die Suche nach Erwärmung in den USHCN-Daten
en Searching for Warming in USHCN Data
-
EIKE Europäisches Institut für Klima und Energie
2016-03-22 de Über die Suche nach Erwärmung in den USHCN-Daten
-
Watts Up With That? (Antony Watts)
2016-03-16 en Searching for Warming in USHCN Data
⇧
9 Fehler in den Oberflächentemperaturen durch NCDC,
GISS und CRU
en
Significant error in the global surface
temperature trend analyses of NCDC, GISS & CRU
fr
Erreurs dans les analyses de températures par
NCDC, GISS et CRU
-
Klimaskeptiker Info
2009-08-13 de Oberflächentemperaturen durch Verarbeitungsfehler verzerrt - neue BelegeSeit Beginn der Satellitenaufzeichnungen 1979 zeigen die Satellitendaten (untere Troposphäre), wie sie von RSS und UAH veröffentlicht werden, einen erheblich geringeren Temperaturanstieg als die von NCDC, GISS und Hadley/CRU veröffentlichten Temperaturdaten von der Erdoberfläche.
In einer Studie zu diesem Thema weisen die Autoren P. J. Klotzbach, R. A. Pielke sen., R. A. Pielke jun., J. R. Christy und R. T. McNider massive Fehler in der Analyse des globalen Oberflächentemperaturtrends durch das NCDC, GISS und Hadley/CRU nach.
Es handele sich dabei nur um einen von mehreren Fehlern in den Temperaturdatenreihen von NCDC, GISS und Hadley/CRU.
Die Temperaturreihen von Hadley/CRU basieren auf "geheimen" Daten und Methoden, deren Herausgabe verweigert wird, die GISS-Daten wurden schon mehrfach (öffentlich) manipuliert.
Zusammen mit den Ergebnissen dieser neuen Untersuchung bleibt nur eine Schlußfolgerung: GISTEMP und HadCRUT sind komplett wertlos und können zur Bewertung der Klimaentwicklung nicht herangezogen werden.
-
Watts Up With That? (Antony Watts)
2009-08-13 en Pielke Sr. on warm bias in the surface temperature trend - "provides evidence of the significant error in the global surface temperature trend analyses of NCDC"Our new paper Klotzbach et al (2009) provides evidence of the significant error in the global surface temperature trend analyses of NCDC, and well of other centers such as GISS and CRU, due to the sampling of temperatures at just one level near the surface.
It is also important to recognize that this is just one error of a number that are in the NCDC, GISS and CRU data sets, as we have summarized in our paper
-
Philip J. Klotzbach, Roger A. Pielke Sr., Roger A. Pielke Jr.,
John R. Christy, Richard T. McNider
2009-05-27 en An Alternative Explanation for Differential Temperature Trends at
the Surface and in the Lower Troposphere
⇧
10 Variationen der Erdoberflächentemperatur
in den letzten 140 Jahren
en
Variations of the Earth's surface temperature
for the past 140 years
fr
Variations de la température de surface de la Terre
au cours des 140 dernières années
en
The Recovery from the Little Ice Age
(A Possible Cause of Global Warming)
-
Syun Akasofu
2007-12 en (59,4 MB)
The Recovery from the Little Ice Age (A Possible Cause of Global Warming)
and The Recent Halting of the Warming (The Multi-decadal Oscillation)
-
Pensée unique
fr Les deux composantes du récent réchauffement climatique
⇧
11 Dr. Syun Akasofu über die Prognosegenauigkeit des
IPCC
en
Dr. Syun Akasofu on IPCC's forecast accuracy
fr
Dr. Syun Akasofu sur l'exactitude des prévisions du GIEC
![]()
![]()
→ The green arrow/red dot shows our current position

-
Watts UP With That? (Antony Watts)
2009-03-20 en Dr. Syun Akasofu on IPCC's forecast accuracy
| Syun-Ichi Akasofu |
Founding Director International Arctic Research Center Fairbanks, Alaska ▶Syun-Ichi Akasofu: Who is who (Skeptiker) |
⇧
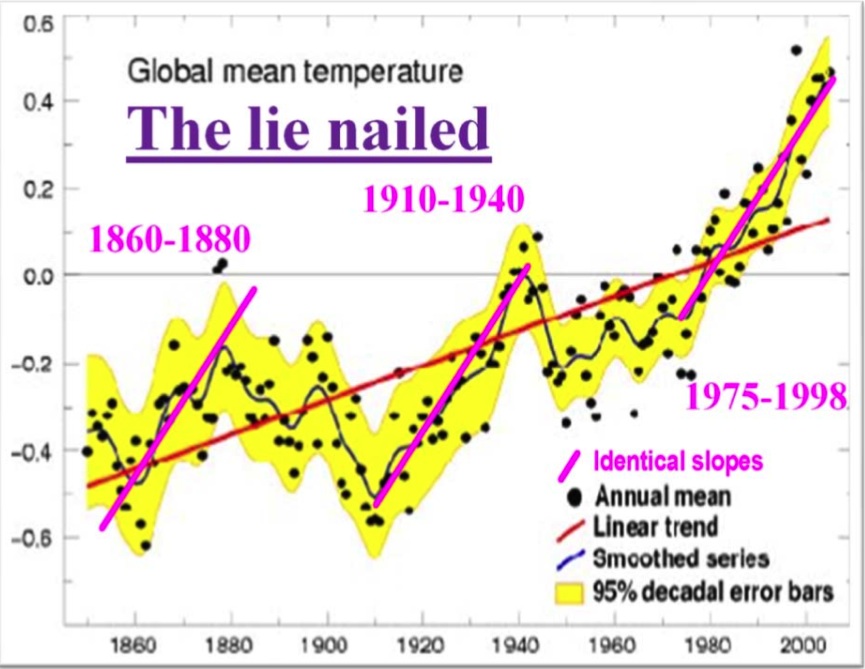
12 Der Temperaturanstieg - Die Lüge festgenagelt
en
The rise in temperature - The lie nailed
fr
La montée en température - Le mensonge cloué
en Is the global temperature increase 1981-2005 unique compared to the general temperature rise since the end of the Little Ice Age ?
Figure A. Figure text reproduced from IPCC 2007, chapter 3, page 253: Annual global mean observed temperatures
de Die Lüge festgenagelt en The Lie nailed fr Le mensonge cloué
Detrended for linear fit 1908-2008
de
Achtung: Temperatursteigung 1908-2008 kommt noch dazu!
en
Attention: detrended for linear fit 1908-2008
en
Attention: La montée de température entre 1908-2008 est à ajouter!
Figure E. Monthly global surface air temperature since 1908,
according to HadCRUT3
Detrended for linear fit 1908-2008
-
Climat4you en
Home
en Figures A et E
⇧
13 Korrelation zwischen globaler Temperatur und
atmosphärischem CO₂
en
Correlation between global temperature and
atmospheric CO₂
fr
Corrélation entre la température globale et
le CO₂ atmosphérique
-
Climat4you en
Home
en Worldwide historical surface air temperatures
en Reflections on the correlation between global temperature and atmospheric CO2
⇧
14 Temperaturmessung und -Auswertung
en
Temperature measurement and evaluation
fr
Mesure et évaluation de la température
-
EIKE Europäisches Institut für Klima und Energie
Prof. em. Dr. Friedrich-Karl Ewert
2011-05-23 de Weltweite Temperaturmessungen beweisen: Kein anthropogen verursachter KlimawandelAuf der ersten UN-Umweltkonferenz in Stockholm 1972 ging es um Maßnahmen zum Schutze unserer Umwelt.
Zwanzig Jahre später, 1992 in Rio de Janeiro wurde der Grundstein für die UN- Klimaverhandlungen gelegt.
Es war ein Beginn und man beschloss, solche Konferenzen fortzusetzen, um Maßnahmen zum Schutze des Klimas zu verabreden, denn inzwischen stand der Klimaschutz im Vordergrund:
Man glaubte eine globale Erwärmung diagnostiziert zu haben, die vor allem durch das Treibhausgas CO2 verursacht würde, und dass es "...um den Planeten zu retten..." vor allem darauf ankam, die CO2-Emissionen der Industrieländer zu senken.
Auf der Konferenz in Kyoto 1997 verabschiedete die Staatengemeinschaft eine Klima-Rahmenkonvention, welche die völkerrechtliche Grundlage für den internationalen Klimaschutz bilden sollte.
Weitere 20 Jahre später wird von den offiziellen Klimainstituten die angeblich vom Menschen verursachte globale Erwärmung immer noch als die Hauptaufgabe der Menschheit angesehen, denn diese Erwärmung gefährdet angeblich ihre Existenz. Tatsächlich wurde bis heute nie bewiesen, dass das vom Menschen direkt oder indirekt produzierte CO2 die ihm zugedachte Wirkung hat.
Diese Annahme beruht lediglich auf Modellrechnungen für die künftige Entwicklung der Temperatur.
Im Gegenteil: Nach den Grundgesetzen der Physik ist die vom Weltklimarat (IPCC) befürchtete Wirkung des CO2gar nicht möglich.
Der "Klimawandel" ist dank massiver Unterstützung der Medien und der Politik zum Zeitgeist geworden.
Dies wurde möglich, weil die aus den mittels Modellrechnungen generierten Szenarien in der öffentlichen Wahrnehmung zu Prognosen wurden, die für die Zukunft lebensfeindliche Zustände voraussagen und Angst erzeugen.
Angst fördert bekanntlich die Regierbarkeit.
-
EIKE Europäisches Institut für Klima und Energie
Prof. Ewert
2016-03-28 de EIKE 9. IKEK: Prof. Ewert - Erderwärmung- Was wurde gemessen und wie
wurde ausgewertet?
| de | en | fr |
|---|---|---|
|
Klima: Wandel Klima-Beobachtungen Korrelationen mit der Sonne |
Climate: Change Climate Observations Correlations with the Sun |
Climat: Changement Observations sur le climat Corrélations avec le soleil |
| de | en | fr |
|---|---|---|
|
Klima: Wandel Temperatur der Erde |
Climate: Change Earth Temperature |
Climat: Changement Température de la terre |
⇧
15 Vier Schlüsseldiagramme für einen
Klimaskeptiker
en
Four Key Charts for a Climate Change Skeptic
fr
Quatre graphiques clés pour un sceptique
du changement climatique
-
Watts Up With That? (Antony Watts)
2017-01-28 en Four Key Charts for a Climate Change SkepticSkeptics often get asked to show why they thinks climate change isn't a crisis, and why we should not be alarmed about it.
These four graphs from Michael David White are handy to use for such a purpose.
⇧
16 Prinzip der Temperatur-Manipulationen
en
Principle of temperature manipulations
fr
Principe des manipulations de température
Links zur Klimaschau
|
|
Temperatur‑Manipulationen:
▶Probleme,
▶Wissenschaft
Wissenschaft: ▶Gefälschte Temperaturdaten Wissenschaft: ▶Nachträgliche Temperatur‑Manipulationen Wissenschaft: ▶Temperaturmessungen durch Satelliten Manifestationen: ▶Temperaturen Klima-Skandal: ▶Manipulationen |
- a de
Die GISS-Daten werden nachträglich verändert
en USHCN and GISS decided to "adjust" the temperature record - b de
Gitterpunktsabstand
en Smoothing Radius - c de
NOAA hat alle ausser 1,500 von 6,000 Thermometern gelöscht
en NOAA had deleted all but 1,500 of the 6,000 thermometers - d en Black Swan Climate Theory
- e de
NOAA in Not: Erwärmungspause der letzten 15 Jahre lässt sich nicht
so einfach wegtricksen
en NOAA erases 'pause' in warming - f de
NASA/GISS Hansen: Drei Jahrzente Temperaturdaten-Anpassung
en NASA/GISS Hansen: Three decades of Temperature Adjustments - g de
1940 wärmer als 1998? - Ja!
en 1940 warmer than 1998? - Yes!
fr 1940 plus chaud que 1998? - Oui! - h en UK Met Office Hadley Centre / Professor Phil Jones
- i de
Das Hockeyschläger Diagramm
en The Hockey stick curve
fr La courbe en crosse de hockey - j de
Als das IPCC das Mittelalterliche Klimaoptimum verschwinden ließ
en IPCC changed viewpoint on the MWP in 2001
fr Comme le GIEC avait disparu le Optimum médiéval climatique
de Verzeichnis en Contents fr Sommaire
- de Allgemein en General fr Générale
- 2018
- de
NOAA-Datenmanipulation um 1,4°C:
"Schlimmer kann Wissenschaft nicht degenerieren"
en NOAA 2.5 Degrees F Data Tampering - 'Science Doesn't Get Any Worse Than This' - 2017
- de Temperaturdatenmanipulation von GISS (NASA) erneut nachgewiesen
- en Robust Evidence NOAA Temperature Data Hopelessly Corrupted By Warming Bias, Manipulation
- 2015
- de
NOAA in Not: Erwärmungspause der letzten 15 Jahre lässt sich nicht
so einfach wegtricksen
en NOAA erases 'pause' in warming - en Black Swan Climate Theory
- de
NOAA versteckt die Rohdaten hinter einem Viertel-Millionen-Dollar
Schutzwall
en NOAA demands $262,000 fee for looking at their 'public' data - 2011
- de
Wärmegehalt der Ozeane ist geringer als bisher gedacht
en Ocean Heat Content Adjustments: Follow-up and More Missing Heat
de Text en Text fr Texte
⇧ de Allgemein en General fr Générale
| de | en | fr |
|---|---|---|
|
Klimawandel: Probleme Temperatur-Manipulationen Skandal Manipulationen Teil I, II, III Climategate Institute, Who's who, Mails |
Climate change: Problems Temperature Manipulations Scandal Manipulations Part I, II, III Climategate Institutes, Who's who, Mails |
Climat: Problèmes Manipulation des températures Scandale Manipulations partie I, II, III Climategate Instituts, Qui est qui, Méls |
| NOAA |
National Oceanic and Atmospheric Administration
▶NOAA: Who is who (Institute & Organisationen der Globalen Erwärmung)
Manipulationen |
| NASA/GISS |
NASA National Aeronautics and Space Administration GISS Goddard Institute for Space Studies ▶NASA/GISS: Who is who (Institute & Organisationen der Globalen Erwärmung)
Manipulationen |
↑
a Die GISS-Daten werden nachträglich verändert
en
USHCN and GISS decided to "adjust" the temperature record
-
Real Science
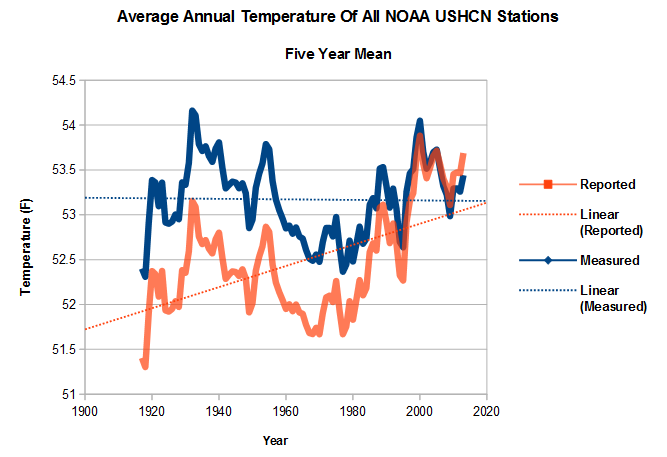
2016-01-15 en "If the facts don't fit the theory, change the facts."
 NASA US temperature data is based on NOAA USHCN data, which is
massively altered to create the appearance of warming.


 The graph below shows how the NOAA data is altered.
The blue line shows the averaged measured temperature at all USHCN stations, and the red line shows the average adjusted temperature.The warming trend over the last century is entirely due to "adjustments" by NOAA.
Note how the "1940s blip" has been largely removed.
|
|
|
|
|
de
(a) = Ursprüngliche Angabe
en
(a) = Original indication |
|
|
en
GISS 1999 vs 2008 Data interpretation |
↑
b Gitterpunktsabstand
en
Smoothing Radius
|
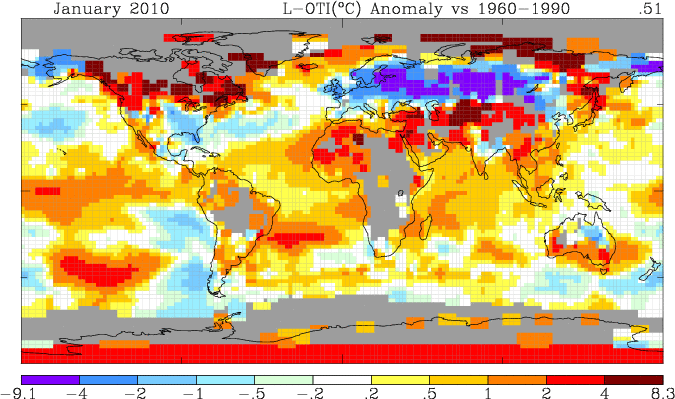
de Die erste Graphik zeigt die Anomalien im Juni 2010, vom GISS interpoliert aus einem Gitterpunktsabstand von 1200 km Die grüne Linie markiert den 80. Breitengrad Nord. Man erkennt, dass die Darstellung von GISS im Wesentlichen in der Region nördlich von 80° eine Temperaturabweichung bis +4 K zeigt. en GISS June 2010 anomalies smoothed to 1200 km. The green line marks 80N latitude. Note that GISS shows essentially the entire region north of 80N up to four degrees above normal. |
de Diese Graphik zeigt das Gleiche, jedoch mit einem Abstand der Gitterpunkte von 250 km. Wie man sieht, hat das GISS nur sehr wenige oder gar keine Daten nördlich von 80° N. en This map is the same, but with 250 km smoothing. As you can see, GISS has little or no data north of 80N. |
|
|
|
|
de James Hansen (NASA/GISS): ... die über 12 Monate gleitende mittlere globale Temperatur hat in den Analysen des GISS im Jahre 2010 einen neuen Rekord erreicht... Die GISS-Analysen weisen das Jahr 2005 als das wärmste Kalenderjahr aus, während die Analyse vom HadCRUT 1998 als das wärmste Jahr zeigen. Hauptursache [für diese Diskrepanz] ist, dass wir die geschätzte Temperatur der Arktis mit einbezogen haben. Mit anderen Worten die Daten vom GISS basieren auf inkorrekten, konstruierten Daten. Warum hat es Hansen offensichtlich gefallen, die gemessenen Daten des DMI zu ignorieren und stattdessen auf "geschätzte" Daten aus der Arktis zurückzugreifen? Die Temperaturanomalien in der Arktis sind nach GISS bis zu 4 K zu hoch, und doch behauptet er, einen gemessenen Rekord um ein paar Hundertstel Grad zu haben. |
en James Hansen (NASA/GISS): ... the 12-month running mean global temperature in the GISS analysis has reached a new record in 2010... GISS analysis yields 2005 as the warmest calendar year, while the HadCRUT analysis has 1998 as the warmest year. The main factor is our inclusion of estimated temperature change for the Arctic region. In other words the GISS record high is based on incorrect, fabricated data. Why did Hansen apparently choose to ignore the DMI data when "estimating" Arctic temperatures? GISS Arctic anomalies are high by as much as 4 degrees, and yet he claims a global record measured in hundredths of a degree. |
↑
c NOAA hat alle ausser 1,500 von 6,000 Thermometern gelöscht
en
NOAA had deleted all but 1,500 of the 6,000 thermometers
|
|
|
|
|
|
↑ d en Black Swan Climate Theory
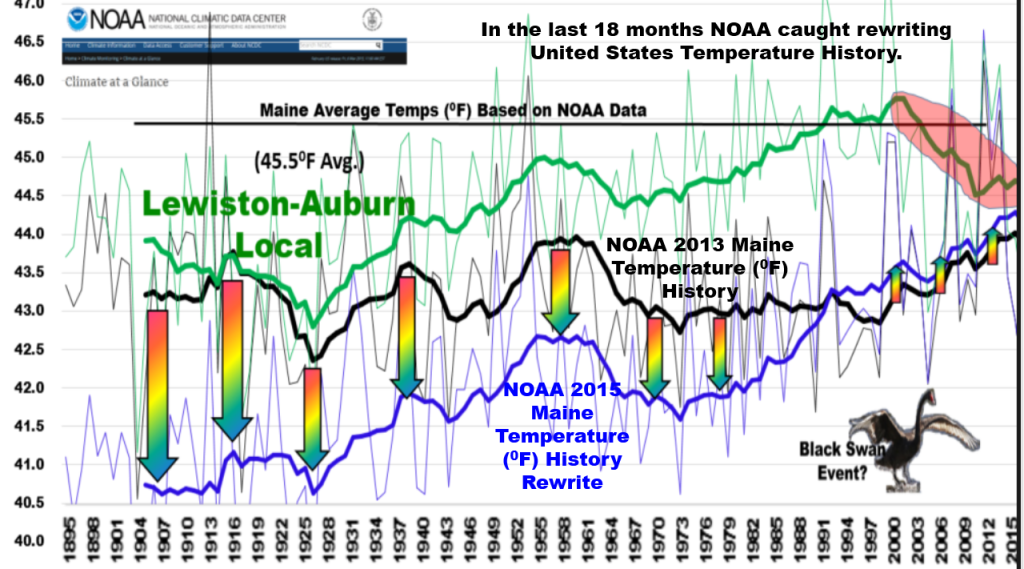
In this five part video series, Engineering Physicist Michael W. Brakey discusses the corrupt data being provided by the National Oceanic and Atmospheric Association in order to promote the theory of Global Warming.
![]()
![]() "Get Out Of Adjusting Business !
"Get Out Of Adjusting Business !
Grün/Green (local source): Lewiston-Auburn area of Maine
Schwarz/Black (NOAA 2013): Maine's overall state
Blau/Blue (NOAA 2014)
(3° Fahrenheit ≅ 1,5° Celsius)
-
EIKE Europäisches Institut fü Klima und Energie
2015-05-12 de Black Swan Climate Theory
-
NoTricksZone (Pierre L. Gosselin)
2015-05-09 en Energy Physicist Implores NOAA To Return To Credibility "Get Out Of Adjusting Business !
-
NoTricksZone (Pierre L. Gosselin)
2015-06-01 en Bombshell: Comprehensive Analysis Reveals NOAA Wrongfully Applying "Master Algorithm" To Whitewash Temperature History
-
NoTricksZone (Pierre L. Gosselin)
2015-07-07 en NOAA's Data Debacle ... Alterations Ruin 120 Years Of Painstakingly Collected Weather Data (Part 2/2)
↑
e NOAA in Not: Erwärmungspause der letzten 15 Jahre lässt sich nicht
so einfach wegtricksen
en NOAA erases 'pause' in warming
2015: NOAA Data Tampering Since Last Year
|
-
Die kalte Sonne (Fritz Vahrenholt & Sebastian Lüning)
2015-12-09 de IPCC-Autor Gerald Meehl verurteilt fragwürdige Rettungsaktionen von Klimaaktivisten zur Erwärmungspause: Der Hiatus ist real und ist erklärungsbedürftig2015-07-02 de NOAA in Not: Erwärmungspause der letzten 15 Jahre lässt sich nicht so einfach wegtricksen
2015-06-15 de Max Planck Gesellschaft: "Die Temperaturen stagnieren ungefähr seit 1998, wenn auch auf hohem Niveau"
-
Watts Up With That? (Antony Watts)
2015-06-09 en Climate scientists criticize government paper (Karl et al. 2015) that erases 'pause' in warmingUntil last week, government data on climate change indicated that the Earth has warmed over the last century, but that the warming slowed dramatically and even stopped at points over the last 17 years.
National Oceanic and Atmospheric Administration has readjusted the data
But a paper released May 28 by researchers at the National Oceanic and Atmospheric Administration has readjusted the data in a way that makes the reduction in warming disappear, indicating a steady increase in temperature instead.
But the study's readjusted data conflict with many other climate measurements, including data taken by satellites, and some climate scientists aren't buying the new claim.
"While I'm sure this latest analysis from NOAA will be regarded as politically useful for the Obama administration, I don't regard it as a particularly useful contribution to our scientific understanding of what is going on," Judith Curry, a climate science professor at Georgia Tech, wrote in a response to the study.
"The new NOAA dataset disagrees with a UK dataset, which is generally regarded as the gold standard for global sea surface temperature datasets," she said.
"The new dataset also disagrees with ARGO buoys and satellite analyses."
-
EIKE Europäisches Institut für Klima und Energie
2016-01-24 de Die "Karlisierung" der Temperatur der Erde
-
Watts Up With That? (Antony Watts)
2016-01-21 en The 'Karlization' of Earth's Temperature
-
Gerald A. Meehl, National Center for Atmospheric Research
2015 en Decadal climate variability and the early-2000s hiatus
-
Die kalte Sonne (Fritz Vahrenholt & Sebastian Lüning)
Frank Bosse und Fritz Vahrenholt
2016-02-09 de Die Sonne im Januar 2016, Rekorde und Ozeanströmungen: Der Golfstrom bleibt stabil!Das Rekordjahr 2015 und was dazu beitrug
Das Jahr 2015 endete mit einem Rekordwert: Die Temperaturreihe GISS verzeichnete +0,87 °C Anomalie gegenüber dem Referenzzeitraum 1951-1981.
Dies waren nochmals 0,13°C mehr als im Vorjahr 2014 global festgestellt wurde. Besonders stark stiegen die Ozeantemperaturen an.
Ein Blick zurück auf einen nur wenige Monate älteren Datensatz GISS vom Mai 2015 zeigt, dass die globalen Mitteltemperaturen 2014 damals noch um 0,06°C geringer angezeigt wurden als im Januar 2016.
Wie kann das sein? Im Sommer 2015 wurde eine Korrektur der Meerestemperaturen eingeführt, wir hatten u.a. hier darüber berichtet.
Der Auslöser:
Die Messmethoden zur Erfassung der Oberflächentemperaturen der Meere (SST- Sea Surface Temperature) änderten sich ab 1998.Wurden früher die SST von Schiffen aus bestimmt, oft indem die Wassertemperatur in Eimern oder über das angesaugte Kühlwasser gemessen wurde, ging man später zu präziseren Bojenmessungen über.
Dieser Übergang trug, so die Wissenschaftler um T. Karl von der NOAA, eine negative Verfälschung ein, die man mit Korrekturen (für die offensichtlich zu warmen Messungen der Vergangenheit nach unten, für die präzisen Messungen der Gegenwart nach oben) minimierte.
Diese Maßnahme wurde sehr schnell für die globalen Bodentemperatur-Reihen übernommen.
Es gibt hierfür nicht nur Beifall in der Fachwelt, wie unser Artikel "IPCC-Autor Gerald Meehl verurteilt fragwürdige Rettungsaktionen von Klimaaktivisten zur Erwärmungspause: Der Hiatus ist real und ist erklärungsbedürftig" zeigte.
Es erscheint recht fragwürdig, gute neuere Bojenmessungen nach oben zu verändern, um sie an die schlechten alten Eimermessungen anzupassen.
...
 NOAA in Not: Erwärmungspause der letzten 15 Jahre lässt sich nicht so
einfach wegtricksen
Update: University of Alabama in Huntsville (UAH) lehnt fragwürdige Veränderungen am RSS-Satelliten-Temperaturdatensatz abEinfluss des El Nino
Einen deutlich höheren Einfluss auf die weltweiten Temperaturen sehen Sie in Abb. 4 im äquatorialen Pazifik: den bereits im November 2015 voll entwickelten ElNino.
Über die Entstehung und den Verlauf dieser internen Variabilität unseres Klimas hatten wir hier berichtet.
Bereits im Jahre 2014 kündigte er sich an, zumindest bis zum Mai.
Ab Anfang August 2014 war er abgesagt, wie wir hier meldeten.
Nun also kam er mit einiger Wucht in 2015 und bescherte den globalen Temperaturen im Jahr 2015 im Mittel einen Anstieg von ca. 0,09 °C.
Das viele rot in Abb. 4 hinterließ seine Spuren in den Troposphären-und Bodentemperaturen.
Alle genannten Beiträge zum Rekord in Summe belaufen sich auf ca. 0,16°C. Nach GISS hätten wir dann etwa die globalen Temperaturen des Vorjahres.
Der Rekord in 2015 ist also zu ganz großen Teilen auf natürliche Variabilität
und eine umstrittene Korrektur von Messdaten größtenteils der Vergangenheit zurückzuführen,
die die Trends ansteigen ließ, gewissermaßen "on top" auf die klimatische Entwicklung.
Im Übrigen zeigen die Satellitenmessungen der Troposphäre keinen Rekordanstieg : beide Messreihen, sowohl UAH als auch RSS, geben 2015 nur als drittwärmstes Jahr seit 1979 an.
Dass die Troposphärentemperaturen langsamer steigen als die Bodentemperaturen ist ein Sachverhalt, den die Klimamodelle nicht reproduzieren. Sie erwarten es genau anders herum.
...
Was erwarten wir von 2016?
Zunächst werden die Temperaturen weiter hoch bleiben.
Die Wärme des ElNino ist noch vorhanden: Sie schlägt sich in verstärkter Wolkenbildung im Ostpazifik nieder. Diese latente Wärme wird erst später in den Weltraum abgestrahlt.
Der ganze Vorgang sollte noch etwa 4-5 Monate dauern,
dann werden die globalen Temperaturen sinken.
Es kündigt sich dann nämlich eine LaNina an. Dies ist nicht etwa das Gegenteil eines ElNino mit seiner Strömungsumkehr.
Vielmehr sind es "verstärkte Normalbedingungen".
Die Passatwinde wehen heftiger als normal und fördern sehr viel kühles Tiefenwasser vor Südamerika an die Oberfläche.
Dadurch wird ein Teil des erwärmten Wassers eines ElNino wieder in die Tiefe vor Indonesien verfrachtet und in die Oberflächentemperaturen geht eine große Kaltwasserfläche im äquatorialen Teil des Pazifiks ein.
In die globalen Temperaturen wird dieser doch recht heftige Umschwung sehr wahrscheinlich erst in 2017 voll durchschlagen.
Für klimatische Einschätzungen wird es so auch in 2017 noch zu früh sein, denn erst nach der zu erwartenden LaNina wird sich ein "neutrales Niveau" einstellen.
Wo das liegt ist noch unbestimmt.
Entwarnung im Atlantik
Erinnern Sie sich noch an die medial so "ausführlich" ausgeschlachteten Meldungen vom Frühjahr 2015, dass sich der Golfstrom dramatisch abgeschwächt hat durch das Schmelzen des Grönlandeises?
Wir hatten uns hier sehr kritisch mit einer Arbeit (Rahmstorf 2015) von Stefan Rahmstorf vom PIK und Kollegen auseinandergesetzt, die den neuerlichen Hype auslöste.
Die Süddeutsche Zeitung beispielsweise vermied das Wort "Katastrophe", zitierte jedoch die Autoren, die ihrer Besorgnis Ausdruck verliehen, dass stark reduzierte Atlantikströme "massive Folgen" für Mensch und Umwelt haben, ergänzten die Forscher.
Die Ökosysteme in den Meeren könnten gestört werden, was die Fischerei und die Lebensgrundlage vieler Menschen entlang der Küsten treffe.
Auch trügen Veränderungen zu einem regionalen Meeresspiegelanstieg etwa in den US-Städten New York und Boston bei.
Zudem seien auch Wetterveränderungen sowohl in Nordamerika als auch in Europa denkbar."
Im Januar 2015 erschien nun eine Arbeit von Parker & Ollier, die die Schlüsse von Rahmstorf2015 entschieden zurückweist.
Wie wir in unserem Artikel damals schon zeigten hatte Rahmstorf 2015 einen Stellvertreter ("Proxy") für die Stärke der AMOC (Atlantic Meridional Overturning Circulation, der Wärmetransport nach Norden) verwendet, der bei näherer Betrachtung offensichtlich Schwierigkeiten mit der Kausalität hatte: er reagierte auf AMOC- Veränderungen bevor diese eintraten.
Die Autoren der widerlegenden Arbeit um Albert Parker von der James Cook- Universität in Townsville, Australien verwendeten einen vertrauenserweckenden Parameter, der auch kürzere Schwankungen der AMOC gut abbildet.
-
EIKE Europäisches Institut für Klima und Energie
Klaus-Eckart Puls
2016-02-17 de Klima-Fakten 2015/16Das Jahr 2015 wurde von den Klima-Alarmisten in bewährtem engen Schulterschluß mit den deutschen(!) Medien zum "wärmsten Jahr aller Zeiten" und zum "endgültigen Klimasignal" hoch gejubelt. Jedoch - die Nachprüfung zeigt:
Es war ein so genannter "Super-El-Nino",
der die Temperatur trieb - wie zuletzt 1998. Eine nahezu verzweifelte Aktion, um nach 18 Jahren der Temperatur-Stagnation eine angeblich anthropogen verursachte Klima-Katastrophen-Hypothese zu retten, anhand eines einzigen Jahres.
Alle anderen Parameter machen auch nicht mit:
Weder die Stürme, noch die Sturmfluten, noch der Meeres-Anstieg!
EIKE Europäisches Institut für Klima und Energie
Quang M. Nguyen, P.E.
2016-02-16 de Wärmer, noch wärmer, am wärmsten - NOAA und NASA erwischt mit der Manipulation der AufzeichnungenFAZIT
Wie so häufig von den Mainstream-Medien seit April 2015 wiederholt, erklärten NOAA und NASA offiziell, dass 2015 heißer als 2014 war, das alte wärmste Jahr der Aufzeichnungen und "versprechen", dass 2016 heißer als 2015 sein könnte!
Jedoch, unleugbare Beweise zeigen, dass die von NOAA und der NASA berechneten durchschnittlichen globalen Temperaturen ungenau, unzuverlässig und nicht mit den Satellitendaten konsistent erscheinen.
1997 war das heißeste Jahr
Laut Daten der NOAA Website, war 1997 wirklich das heißeste Jahr der Aufzeichnung mit 16,9°C (62.45°F).
Die globale Durchschnittstemperatur im Jahr 2015 betrug 14,8°C (58.62°F) oder 2,12K (3.83F) von unter der Temperatur 1997. [... und unter der "Normal" Temperatur von 15°C gemäß PIK u.ä., der Übersetzer]
Nach den Daten der NOAA Website, haben die Parameter wie beispielsweise die Durchschnittstemperatur des 20. Jahrhunderts und der jährlichen Temperaturanomalien, die konstant sein müssten, unterschiedliche Werte in den jährlichen globalen Analysen.
Korrigierte historische Temperaturdaten
NOAA und NASA korrigierten historische Temperaturdaten und stellten Temperaturdaten in Gebieten ohne Temperaturaufzeichnung systematisch her, weit verbreitet und unidirektional zum "kühlen" der Vergangenheit, in dem Versuch, einen steigenden Temperaturtrend zu beweisen.
NOAA und NASAm diskreditieren ihre eigenen Satellitendaten.
NOAA und der NASA haben Anstrengungen unternommen, um ihre eigenen Satellitendaten zu diskreditieren - die im Einklang mit dem Ballon Daten sind - weil eine globale Erwärmung Pause seit 1998 im Widerspruch mit der von NOAA und der NASA bevorzugten Behauptung steht.
NOAA und NASA weigern sich die angeforderten Daten heraus zugeben
NOAA und NASA haben sich geweigert, die durch das US-Repräsentantenhaus für Wissenschaft, Weltraum und Technologie angeforderten Daten und Informationen heraus zugeben.
Es gibt keinen Grund für sie die Daten und Informationen, die öffentlich zugänglich sind, zurückzuhalten, es sei denn, sie haben etwas zu verbergen.
↑
f NASA/GISS Hansen: Drei Jahrzente Datenanpassung
en
NASA/GISS Hansen: Three decades of Temperature Adjustments
|
|
|
with 2010 almost 0.1°C warmer than the actual warmest year of 1998. |
and 2010 about 0.1°C cooler than the warmest year 1998. |
|
|
|
↑
g Wie wird die Abkühlung versteckt: 1940 Spitze löschen!
1940 wärmer als 1998 ? - Ja !
en
How To Hide Global Cooling: Delete The "1940's Blip"
1940 warmer than 1998 ? - Yes !
fr
Comment cacher le refroidissement: Effacer la pointe 1940!
1940 plus chaud que 1998 ? - Oui !
Mit folgenden Links wird von anderen Webseiten auf diese Seite verwiesen:
| de | en | fr |
|---|---|---|
|
Klima Probleme: Fehler I Temperatur-Manipulationen 1940 wärmer als 1998? - Ja ! |
Climate problems: Errors I Temperatur-Manipulationen 1940 warmer than 1998? - Yes ! |
Problèmes: Erreurs I Temperatur-Manipulationen 1940 plus chaud que 1998? - Oui ! |
- en How To Hide Global Cooling: Delete The "1940's Blip"
- de
Steigen die Arktis-Temperaturen wirklich auf ein Rekordhoch?
en Comments on "Arctic air temperatures climb to record levels - en ETH Zurich: Swiss Glaciers melted in the 1940's faster than today"
↑ en How To Hide Global Cooling: Delete The "1940's Blip"
|
A: Delete The "1940's Blip" |
B: Warming Contradicted by Satellite Records |
|
Look at the 1940's blip here, it is nothing. Was it really this low, or did the CRU con men use statistics to cool it way down, only to have to put the 'raw' data back into the later decades to make the temperature appear higher now than in the 1940's and 1950's? |
|
|
en Well, thanks to the CRU data dump we have some of their temp runs from 2008 and 2005. Let's look at the CRU Land Temp Data from some selected countries around the globe (and yes, I cherry picked them, but it was not hard since all countries nearby these saw similar patterns). |
|
-
The Strata-Sphere
2009-11-24 en How To Hide Global Cooling: Delete The "1940's Blip"
As I and others dive into the CRU data dump we learn more and more about how the Global Warming conspiracy was pulled off. We now know all you need to do to pull this off is statistically cover up true data that tells the wrong story with 'bad' data that tells the story you want to have told.
2009-12-03 en Climategate Escalating, Smoking Gun Could Be 1940's 'Blip'
-
E-mail
2009-09-27 en From: Tom Wigley To: Phil Jonesen If you look at the attached plot you will see that the land also shows the 1940s blip (as I'm sure you know).
So, if we could reduce the ocean blip by, say, 0.15 degC, then this would be significant for the global mean -- but we'd still have to explain the land blip.
I've chosen 0.15 here deliberately.This still leaves an ocean blip, and i think one needs to have some form of ocean blip to explain the land blip (via either some common forcing, or ocean forcing land, or vice versa, or all of these). When you look at other blips, the land blips are 1.5 to 2 times (roughly) the ocean blips -- higher sensitivity plus thermal inertia effects. My 0.15 adjustment leaves things consistent with this, so you can see where I am coming from.
Removing ENSO does not affect this.It would be good to remove at least part of the 1940s blip, but we are still left with "why the blip".
fr Quelques spéculations sur comment corriger les mesures des températures de surface des océans (SST) afin d'expliquer en partie la petite hausse des températures dans les années 1940.
Si tu regardes le graphique joint, tu remarqueras que les continents ont également connu cette petite anomalie des années 1940 (comme tu le sais sûrement).
Donc, si nous pouvions réduire l'anomalie océanique par, disons, 0,15° C, cela aurait alors un impact important sur la moyenne planétaire -- mais il faudrait toujours expliquer la petite anomalie continentale.
J'ai choisi 0,15 à dessein.Il restera toujours une petite hausse océanique, et je crois qu'il faut avoir un type de petite pointe océanique pour expliquer la petite anomalie continentale (via soit un type de forçage commun, soit l'océan qui force les continents, ou vice versa, ou tous à la fois). Si tu regardes les autres petites anomalies, les anomalies continentales sont 1,5 à 2 fois (approximativement) plus fortes que les anomalies océaniques -- plus grande sensibilité et effets de l'inertie thermique.
Mon ajustement de 0,15 rentre dans ces paramètres, tu vois donc ce que je veux dire.
Éliminer ENSO n'a pas d'effet sur ceci.Il serait bon d'éliminer au moins une partie de l'anomalie des années quarante, mais la question demeure «pourquoi cette petite anomalie».
| de | en | fr |
|---|---|---|
| Temperatur | Temperature | Température |
| Offizielle, weltweite, amtliche Temperaturbestimmungen | Official worldwide temperature measurement | Mesurages officielles des températures mondiales |
↑
Steigen die Arktis-Temperaturen wirklich auf ein Rekordhoch?
enComments on "Arctic air temperatures climb to record levels"
|
| de | en | fr |
|---|---|---|
|
Auswirkungen des Klimas Arktis (Nordpol) |
Effects of Climate Change Arctic (North Pole) |
Conséquences climatiques Arctique (Pôle Nord) |
| Temperaturen in der Arktis | Arctic Temperatures | Températures dans l'arctique |
| Meereis in der Arktis | Arctic Sea Ice | Banquise arctique |
↑ en ETH Zurich: Swiss Glaciers melted in the 1940's faster than today
|
| de | en | fr |
|---|---|---|
|
Auswirkungen des Klimas Gletscher |
Impacts of Climate Change Glaciers |
Impacts du changement climatique Glaciers |
↑ h UK Met Office Hadley Centre / Professor Phil Jones
UK Met Office Hadley Centre
|
|
|
Source: 2010-02-13 en BBC News |
| Phil Jones |
Director of the Climatic Research Unit (CRU) and a Professor in the
School of Environmental Sciences at the University of East Anglia in
Norwich
▶Phil Jones: Who is who (Aktivisten der anthropogenen Globalen Erwärmung) |
| de | en | fr |
|---|---|---|
|
Klimawandel: Probleme Temperatur-Manipulationen Skandal Manipulationen Teil I, II, III Climategate Institute, Who's who, Mails |
Climate change: Problems Temperature Manipulations Scandal Manipulations Part I, II, III Climategate Institutes, Who's who, Mails |
Climat: Problèmes Manipulation des températures Scandale Manipulations partie I, II, III Climategate Instituts, Qui est qui, Méls |
↑
i Das Hockeyschläger Diagramm
en The Hockey stick curve
fr La courbe en crosse de hockey
-
de Diese Annahmen für das Kyoto-Protokoll sind falsch
-
en These data used as basis for the Kyoto-protocol are wrong
-
fr Ces valeurs pris comme base du protocole de Kyoto sont fausses
|
de Aus der Panik-Küche en From the panic laboratory fr De la marmite des alarmistes
|
de Das Holozän en The Holocene fr Le holocène
|
|
||||||
|
![]() Die unterschlagene historische COMNISPA-Temperaturkurve
Die unterschlagene historische COMNISPA-Temperaturkurve
![]()
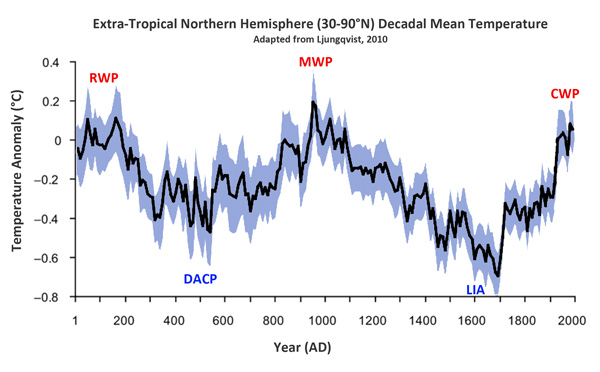
![]() Temperaturentwicklung der letzten 2000 Jahre auf der außertropischen
Nordhemisphäre
Temperaturentwicklung der letzten 2000 Jahre auf der außertropischen
Nordhemisphäre
RWP = Roman Warm Period
DACP = Dark Ages Cold Period
MWP = Medieval Warm Period
LIA = Little Ice Age
CWP = Modern Warm Period
![]()
![]() Wassertemperaturen der vergangenen 2000 Jahre
Wassertemperaturen der vergangenen 2000 Jahre

↑
j Als das IPCC das Mittelalterliche Klimaoptimum verschwinden ließ
en IPCC changed viewpoint on the MWP in 2001
fr Comme le GIEC avait disparu le Optimum médiéval climatique
MWP = Medieval Warm Period (Mittelalterliche Warmzeit)
LIA = Little Ice Age (Kleine Eiszeit)
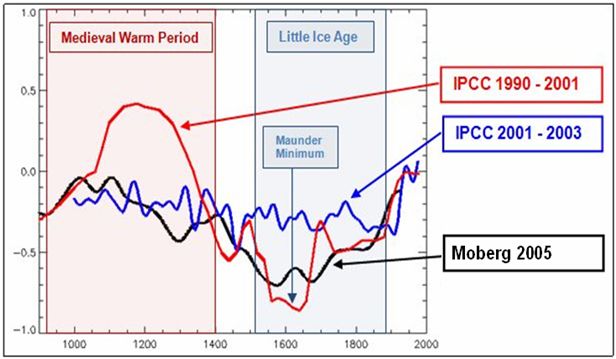
Ab 2001 verschwindet dieses geschichtlich belegte Phänomen.
-
Klimaskeptiker Info
2010-03-10 de Als das IPCC das Mittelalterliche Klimaoptimum verschwinden ließ...In älteren Veröffentlichungen des IPCC war das Mittelalterliche Klimaoptimum (Medieval Warm Period, MWP) enthalten.
Ab 2001 verschwindet dieses geschichtlich belegte Phänomen.
Es paßte nicht zu der Behauptung, die Erwärmung des 20. Jahrhunderts sei beispiellos gewesen.
Im Jahr 2001 reflektierte die Darstellung einer MWP die Mehrheitsmeinung innerhalb der Paläoklimatologie.
Das IPCC aber verbreitete ab 2001 einen neuen Standpunkt.
In der Folge erschienen mehrere Studien, die die Nichtexistenz des Mittelalterlichen Klimaoptimums bestätigte.Nach ClimateGate gibt es den Verdacht, daß bestimmte IPCC-verbundene Wissenschaftler wie Phil Jones das Erscheinen bzw. Nicht-Erscheinen von Studien manipuliert haben, um ihren Standpunkt der beispiellosen anthropogenen Erwärmung zu untermauern.
IPCC oder ihm nahestehende Personen haben also die wissenschaftliche Arbeit kontrolliert oder manipuliert.
Fazit: Die IPCC-Berichte haben mit seriöser Wissenschaft nichts zu tun.
Diese Veröffentlichungen sind nichts als bloße politische Propaganda.
-
Hide the decline
2010-03-08 en IPCC changed viewpoint on the MWP in 2001 - did this have effect on scientific results?
-
2006-12-06 en
 "We have to get rid of the Medieval Warm Period!"
Video of Dr David Deming's statement to the U.S. Senate Committee on Environment & Public Works on December 6, 2006.
Dr Deming reveals that in 1995 a leading scientist emailed him saying "We have to get rid of the Medieval Warm Period".
A few years later, Michael Mann and the IPCC did just that by publishing the now throughly discredited hockey stick graph.
⇧ 2018
↑
NOAA-Datenmanipulation um 1,4°C:
"Schlimmer kann Wissenschaft nicht degenerieren"
en
NOAA 2.5 Degrees F Data Tampering -
'Science Doesn't Get Any Worse Than This'
![]()
![]() Man beachte die blauen tatsächlichen Messungen: Kaum Erwärmung.
Man beachte die blauen tatsächlichen Messungen: Kaum Erwärmung.
Dann betrachte man die in rot dargestellten adjustierten Daten:
so sollte ein globaler Erwärmungstrend aussehen.
Ein globaler Fake-Erwärmungstrend, heißt das.
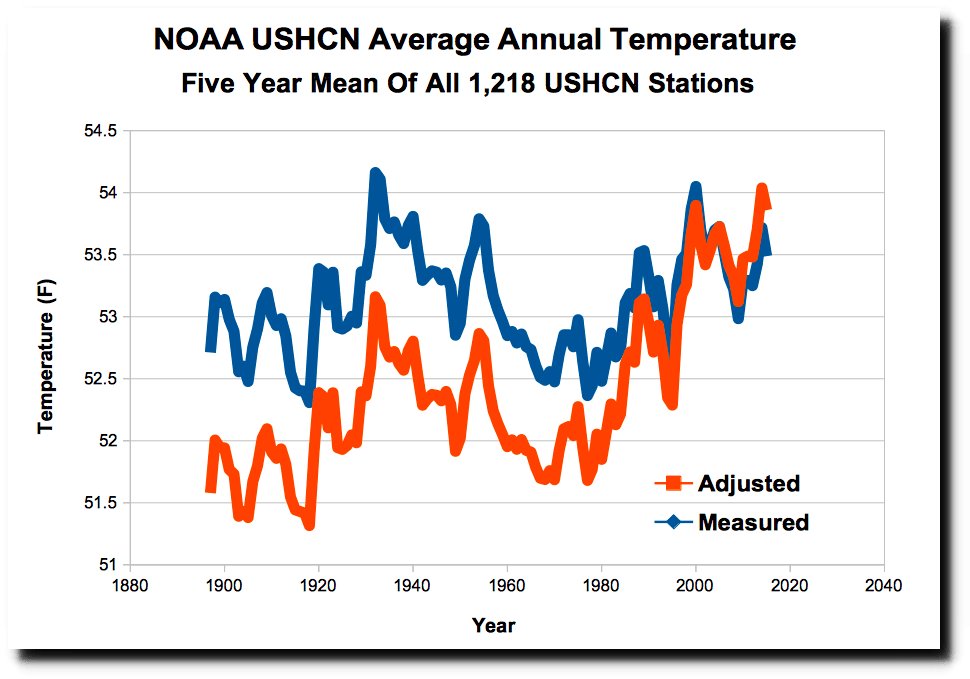
-
EIKE Europäisches Institut für Klima und Energie
James Delingpole / Chris Frey
2018-03-28 de NOAA-Datenmanipulation um 1,4°C: "Schlimmer kann Wissenschaft nicht degenerieren"Die Datenmanipulationen bei der NOAA sind sogar noch viel schlimmer als wir bisher dachten:
Während des vorigen Jahrhunderts wurde die "globale Erwärmung" in den USA um bis zu 1,4°C* übertrieben!Mit anderen Worten, so gut wie die gesamte, von den Torwächtern der weltweit führenden Temperaturaufzeichnungen "gemessene" Erwärmung könnte ein Fake sein.
-
Breitbart James Delingpole
2018-03-21 en Delingpole: NOAA 2.5 Degrees F Data Tampering - 'Science Doesn't Get Any Worse Than This'The data tampering at National Oceanic and Atmospheric Administration (NOAA) is even worse than we thought:
over the last century it has exaggerated "global warming" in the U.S. by as much as 2.5 degrees F.In other words, pretty much the entirety of the 20th century warming in the U.S. "measured" by the world's primary temperature record gatekeeper may be fake.
Quelle / Source:
-
The Deplorable Climate Science Blog / Tony Heller
2018-03-20 en NOAA Data Tampering Approaching 2.5 Degrees FNOAA's US temperature record shows that US was warmest in the 1930's and has generally cooled as CO2 has increased.
This wrecks greenhouse gas theory, so they "adjust" the data to make it look like the US is warming.

 Science doesn't get any worse than how NOAA handles US
temperature data.
NASA uses the NOAA data as the basis for their temperature graphs, which have also been massively altered to turn cooling into warming.
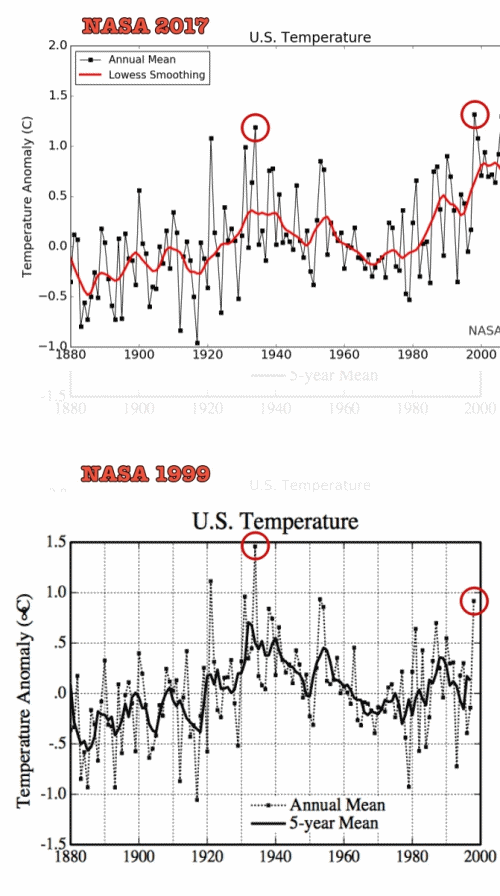
⇧ 2017
↑ Temperaturdatenmanipulation von GISS (NASA) erneut nachgewiesen
-
2017-06-09 en
 NASA manipuliert Klima-Daten !
-
EIKE Europäisches Institut für Klima und Energie
2017-06-12 de Temperaturdatenmanipulation von GISS (NASA) erneut nachgewiesenManipulation der Temperaturdaten
Seit langem ist bekannt, dass das das zur NASA gehörende Goddard Institute for Space Sciences (GISS) die weltweiten Temperaturdaten manipuliert.
Und zwar fast ausschließlich so, dass heute eine stärkerer Erwärmung erkennbar sein soll.
Zugleich wird auch kein nachvollziehbarer Grund für diese ständige Manipulation angegeben.
Damit sind diese Daten für die Klimawissenschaft wertlos.
Doch selten konnten diese Manipulationen so eindeutig und vor allem so einprägsam und daher auch für Laien überzeugend gezeigt werden, wie in diesem Ausschnitt aus dem Recherche-Video "Schulbuch belegt Schwindel mit Globaler Erwärmung".
↑ en Robust Evidence NOAA Temperature Data Hopelessly Corrupted By Warming Bias, Manipulation
-
NoTricksZone (Pierre L. Gosselin)
Kenneth Richard
2017-01-30 en Robust Evidence NOAA Temperature Data Hopelessly Corrupted By Warming Bias, ManipulationDr. Thomas Karl recently retired as Director of the National Oceanic and Atmospheric Administration (NOAA).
In 1989, Karl's stated position was that global temperatures cooled between 1921 and 1979.
"Analysis of warming since 1881 shows most of the increase in global temperature happened before 1919 - before the more recent sharp rise in the amount of carbon dioxide in the atmosphere, said Thomas Karl of the National Oceanic and Atmospheric Administration's National Climatic Data Center in Asheville, N.C.
While global climate warmed overall since 1881, it actually cooled from 1921 to 1979, Karl said."
Today, not only has the 1921-1979 cooling disappeared from NOAA's official temperature record,
it has been replaced by a +0.45°C warming trend during that nearly 60-year period.
Conclusion
The global temperature dataset available from NOAA suffers from massive and uncorrected warm biases (as preferred by its purveyors), woefully inadequate contemporary measurement coverage, and even worse historical coverage (with inherently non-uniform data collection methodologies).
Consequently, a substantial portion of the temperature data available from NOAA should be regarded as artificial and untrustworthy.
Those who faithfully uphold NOAA's global temperature dataset as "truth" will need to address its demonstrable speciousness - and why they are inclined to believe in it anyway.
⇧ 2015
↑
NOAA in Not: Erwärmungspause der letzten 15 Jahre lässt sich nicht
so einfach wegtricksen
en NOAA erases 'pause' in warming
2015: NOAA Data Tampering Since Last Year
|
-
Die kalte Sonne (Fritz Vahrenholt & Sebastian Lüning)
2015-12-09 de IPCC-Autor Gerald Meehl verurteilt fragwürdige Rettungsaktionen von Klimaaktivisten zur Erwärmungspause: Der Hiatus ist real und ist erklärungsbedürftig2015-07-02 de NOAA in Not: Erwärmungspause der letzten 15 Jahre lässt sich nicht so einfach wegtricksen
2015-06-15 de Max Planck Gesellschaft: "Die Temperaturen stagnieren ungefähr seit 1998, wenn auch auf hohem Niveau"
-
Watts Up With That? (Antony Watts)
2015-06-09 en Climate scientists criticize government paper (Karl et al. 2015) that erases 'pause' in warmingUntil last week, government data on climate change indicated that the Earth has warmed over the last century, but that the warming slowed dramatically and even stopped at points over the last 17 years.
National Oceanic and Atmospheric Administration has readjusted the data
But a paper released May 28 by researchers at the National Oceanic and Atmospheric Administration has readjusted the data in a way that makes the reduction in warming disappear, indicating a steady increase in temperature instead.
But the study's readjusted data conflict with many other climate measurements, including data taken by satellites, and some climate scientists aren't buying the new claim.
"While I'm sure this latest analysis from NOAA will be regarded as politically useful for the Obama administration, I don't regard it as a particularly useful contribution to our scientific understanding of what is going on," Judith Curry, a climate science professor at Georgia Tech, wrote in a response to the study.
"The new NOAA dataset disagrees with a UK dataset, which is generally regarded as the gold standard for global sea surface temperature datasets," she said.
"The new dataset also disagrees with ARGO buoys and satellite analyses."
-
EIKE Europäisches Institut für Klima und Energie
2016-01-24 de Die "Karlisierung" der Temperatur der Erde
-
Watts Up With That? (Antony Watts)
2016-01-21 en The 'Karlization' of Earth's Temperature
-
Gerald A. Meehl, National Center for Atmospheric Research
2015 en Decadal climate variability and the early-2000s hiatus
-
Die kalte Sonne (Fritz Vahrenholt & Sebastian Lüning)
Frank Bosse und Fritz Vahrenholt
2016-02-09 de Die Sonne im Januar 2016, Rekorde und Ozeanströmungen: Der Golfstrom bleibt stabil!Das Rekordjahr 2015 und was dazu beitrug
Das Jahr 2015 endete mit einem Rekordwert: Die Temperaturreihe GISS verzeichnete +0,87 °C Anomalie gegenüber dem Referenzzeitraum 1951-1981.
Dies waren nochmals 0,13°C mehr als im Vorjahr 2014 global festgestellt wurde. Besonders stark stiegen die Ozeantemperaturen an.
Ein Blick zurück auf einen nur wenige Monate älteren Datensatz GISS vom Mai 2015 zeigt, dass die globalen Mitteltemperaturen 2014 damals noch um 0,06°C geringer angezeigt wurden als im Januar 2016.
Wie kann das sein? Im Sommer 2015 wurde eine Korrektur der Meerestemperaturen eingeführt, wir hatten u.a. hier darüber berichtet.
Der Auslöser:
Die Messmethoden zur Erfassung der Oberflächentemperaturen der Meere (SST- Sea Surface Temperature) änderten sich ab 1998.Wurden früher die SST von Schiffen aus bestimmt, oft indem die Wassertemperatur in Eimern oder über das angesaugte Kühlwasser gemessen wurde, ging man später zu präziseren Bojenmessungen über.
Dieser Übergang trug, so die Wissenschaftler um T. Karl von der NOAA, eine negative Verfälschung ein, die man mit Korrekturen (für die offensichtlich zu warmen Messungen der Vergangenheit nach unten, für die präzisen Messungen der Gegenwart nach oben) minimierte.
Diese Maßnahme wurde sehr schnell für die globalen Bodentemperatur-Reihen übernommen.
Es gibt hierfür nicht nur Beifall in der Fachwelt, wie unser Artikel "IPCC-Autor Gerald Meehl verurteilt fragwürdige Rettungsaktionen von Klimaaktivisten zur Erwärmungspause: Der Hiatus ist real und ist erklärungsbedürftig" zeigte.
Es erscheint recht fragwürdig, gute neuere Bojenmessungen nach oben zu verändern, um sie an die schlechten alten Eimermessungen anzupassen.
...
 NOAA in Not: Erwärmungspause der letzten 15 Jahre lässt sich nicht so
einfach wegtricksen
Update: University of Alabama in Huntsville (UAH) lehnt fragwürdige Veränderungen am RSS-Satelliten-Temperaturdatensatz abEinfluss des El Nino
Einen deutlich höheren Einfluss auf die weltweiten Temperaturen sehen Sie in Abb. 4 im äquatorialen Pazifik: den bereits im November 2015 voll entwickelten ElNino.
Über die Entstehung und den Verlauf dieser internen Variabilität unseres Klimas hatten wir hier berichtet.
Bereits im Jahre 2014 kündigte er sich an, zumindest bis zum Mai.
Ab Anfang August 2014 war er abgesagt, wie wir hier meldeten.
Nun also kam er mit einiger Wucht in 2015 und bescherte den globalen Temperaturen im Jahr 2015 im Mittel einen Anstieg von ca. 0,09 °C.
Das viele rot in Abb. 4 hinterließ seine Spuren in den Troposphären-und Bodentemperaturen.
Alle genannten Beiträge zum Rekord in Summe belaufen sich auf ca. 0,16°C. Nach GISS hätten wir dann etwa die globalen Temperaturen des Vorjahres.
Der Rekord in 2015 ist also zu ganz großen Teilen auf natürliche Variabilität
und eine umstrittene Korrektur von Messdaten größtenteils der Vergangenheit zurückzuführen,
die die Trends ansteigen ließ, gewissermaßen "on top" auf die klimatische Entwicklung.
Im Übrigen zeigen die Satellitenmessungen der Troposphäre keinen Rekordanstieg : beide Messreihen, sowohl UAH als auch RSS, geben 2015 nur als drittwärmstes Jahr seit 1979 an.
Dass die Troposphärentemperaturen langsamer steigen als die Bodentemperaturen ist ein Sachverhalt, den die Klimamodelle nicht reproduzieren. Sie erwarten es genau anders herum.
...
Was erwarten wir von 2016?
Zunächst werden die Temperaturen weiter hoch bleiben.
Die Wärme des ElNino ist noch vorhanden: Sie schlägt sich in verstärkter Wolkenbildung im Ostpazifik nieder. Diese latente Wärme wird erst später in den Weltraum abgestrahlt.
Der ganze Vorgang sollte noch etwa 4-5 Monate dauern,
dann werden die globalen Temperaturen sinken.
Es kündigt sich dann nämlich eine LaNina an. Dies ist nicht etwa das Gegenteil eines ElNino mit seiner Strömungsumkehr.
Vielmehr sind es "verstärkte Normalbedingungen".
Die Passatwinde wehen heftiger als normal und fördern sehr viel kühles Tiefenwasser vor Südamerika an die Oberfläche.
Dadurch wird ein Teil des erwärmten Wassers eines ElNino wieder in die Tiefe vor Indonesien verfrachtet und in die Oberflächentemperaturen geht eine große Kaltwasserfläche im äquatorialen Teil des Pazifiks ein.
In die globalen Temperaturen wird dieser doch recht heftige Umschwung sehr wahrscheinlich erst in 2017 voll durchschlagen.
Für klimatische Einschätzungen wird es so auch in 2017 noch zu früh sein, denn erst nach der zu erwartenden LaNina wird sich ein "neutrales Niveau" einstellen.
Wo das liegt ist noch unbestimmt.
Entwarnung im Atlantik
Erinnern Sie sich noch an die medial so "ausführlich" ausgeschlachteten Meldungen vom Frühjahr 2015, dass sich der Golfstrom dramatisch abgeschwächt hat durch das Schmelzen des Grönlandeises?
Wir hatten uns hier sehr kritisch mit einer Arbeit (Rahmstorf 2015) von Stefan Rahmstorf vom PIK und Kollegen auseinandergesetzt, die den neuerlichen Hype auslöste.
Die Süddeutsche Zeitung beispielsweise vermied das Wort "Katastrophe", zitierte jedoch die Autoren, die ihrer Besorgnis Ausdruck verliehen, dass stark reduzierte Atlantikströme "massive Folgen" für Mensch und Umwelt haben, ergänzten die Forscher.
Die Ökosysteme in den Meeren könnten gestört werden, was die Fischerei und die Lebensgrundlage vieler Menschen entlang der Küsten treffe.
Auch trügen Veränderungen zu einem regionalen Meeresspiegelanstieg etwa in den US-Städten New York und Boston bei.
Zudem seien auch Wetterveränderungen sowohl in Nordamerika als auch in Europa denkbar."
Im Januar 2015 erschien nun eine Arbeit von Parker & Ollier, die die Schlüsse von Rahmstorf2015 entschieden zurückweist.
Wie wir in unserem Artikel damals schon zeigten hatte Rahmstorf 2015 einen Stellvertreter ("Proxy") für die Stärke der AMOC (Atlantic Meridional Overturning Circulation, der Wärmetransport nach Norden) verwendet, der bei näherer Betrachtung offensichtlich Schwierigkeiten mit der Kausalität hatte: er reagierte auf AMOC- Veränderungen bevor diese eintraten.
Die Autoren der widerlegenden Arbeit um Albert Parker von der James Cook- Universität in Townsville, Australien verwendeten einen vertrauenserweckenden Parameter, der auch kürzere Schwankungen der AMOC gut abbildet.
-
EIKE Europäisches Institut für Klima und Energie
Klaus-Eckart Puls
2016-02-17 de Klima-Fakten 2015/16Das Jahr 2015 wurde von den Klima-Alarmisten in bewährtem engen Schulterschluß mit den deutschen(!) Medien zum "wärmsten Jahr aller Zeiten" und zum "endgültigen Klimasignal" hoch gejubelt. Jedoch - die Nachprüfung zeigt:
Es war ein so genannter "Super-El-Nino",
der die Temperatur trieb - wie zuletzt 1998. Eine nahezu verzweifelte Aktion, um nach 18 Jahren der Temperatur-Stagnation eine angeblich anthropogen verursachte Klima-Katastrophen-Hypothese zu retten, anhand eines einzigen Jahres.
Alle anderen Parameter machen auch nicht mit:
Weder die Stürme, noch die Sturmfluten, noch der Meeres-Anstieg!
EIKE Europäisches Institut für Klima und Energie
Quang M. Nguyen, P.E.
2016-02-16 de Wärmer, noch wärmer, am wärmsten - NOAA und NASA erwischt mit der Manipulation der AufzeichnungenFAZIT
Wie so häufig von den Mainstream-Medien seit April 2015 wiederholt, erklärten NOAA und NASA offiziell, dass 2015 heißer als 2014 war, das alte wärmste Jahr der Aufzeichnungen und "versprechen", dass 2016 heißer als 2015 sein könnte!
Jedoch, unleugbare Beweise zeigen, dass die von NOAA und der NASA berechneten durchschnittlichen globalen Temperaturen ungenau, unzuverlässig und nicht mit den Satellitendaten konsistent erscheinen.
1997 war das heißeste Jahr
Laut Daten der NOAA Website, war 1997 wirklich das heißeste Jahr der Aufzeichnung mit 16,9°C (62.45°F).
Die globale Durchschnittstemperatur im Jahr 2015 betrug 14,8°C (58.62°F) oder 2,12K (3.83F) von unter der Temperatur 1997. [... und unter der "Normal" Temperatur von 15°C gemäß PIK u.ä., der Übersetzer]
Nach den Daten der NOAA Website, haben die Parameter wie beispielsweise die Durchschnittstemperatur des 20. Jahrhunderts und der jährlichen Temperaturanomalien, die konstant sein müssten, unterschiedliche Werte in den jährlichen globalen Analysen.
Korrigierte historische Temperaturdaten
NOAA und NASA korrigierten historische Temperaturdaten und stellten Temperaturdaten in Gebieten ohne Temperaturaufzeichnung systematisch her, weit verbreitet und unidirektional zum "kühlen" der Vergangenheit, in dem Versuch, einen steigenden Temperaturtrend zu beweisen.
NOAA und NASAm diskreditieren ihre eigenen Satellitendaten.
NOAA und der NASA haben Anstrengungen unternommen, um ihre eigenen Satellitendaten zu diskreditieren - die im Einklang mit dem Ballon Daten sind - weil eine globale Erwärmung Pause seit 1998 im Widerspruch mit der von NOAA und der NASA bevorzugten Behauptung steht.
NOAA und NASA weigern sich die angeforderten Daten heraus zugeben
NOAA und NASA haben sich geweigert, die durch das US-Repräsentantenhaus für Wissenschaft, Weltraum und Technologie angeforderten Daten und Informationen heraus zugeben.
Es gibt keinen Grund für sie die Daten und Informationen, die öffentlich zugänglich sind, zurückzuhalten, es sei denn, sie haben etwas zu verbergen.
↑ en Black Swan Climate Theory
In this five part video series, Engineering Physicist Michael W. Brakey discusses the corrupt data being provided by the National Oceanic and Atmospheric Association in order to promote the theory of Global Warming.
![]()
![]() "Get Out Of Adjusting Business !
"Get Out Of Adjusting Business !
Grün/Green (local source): Lewiston-Auburn area of Maine
Schwarz/Black (NOAA 2013): Maine's overall state
Blau/Blue (NOAA 2014)
(3° Fahrenheit ≅ 1,5° Celsius)

-
EIKE Europäisches Institut fü Klima und Energie
2015-05-12 de Black Swan Climate Theory
-
NoTricksZone (Pierre L. Gosselin)
2015-05-09 en Energy Physicist Implores NOAA To Return To Credibility "Get Out Of Adjusting Business !
-
NoTricksZone (Pierre L. Gosselin)
2015-06-01 en Bombshell: Comprehensive Analysis Reveals NOAA Wrongfully Applying "Master Algorithm" To Whitewash Temperature History
-
NoTricksZone (Pierre L. Gosselin)
2015-07-07 en NOAA's Data Debacle ... Alterations Ruin 120 Years Of Painstakingly Collected Weather Data (Part 2/2)
↑
NOAA versteckt die Rohdaten hinter einem Viertel-Millionen-Dollar
Schutzwall
en
NOAA demands $262,000 fee for looking at their 'public' data
-
Die kalte Sonne (Fritz Vahrenholt & Sebastian Lüning)
2015-04-17 de Verdacht auf Temperaturdatenmanipulation: NOAA versteckt die Rohdaten hinter einem antklimatischen Viertel-Millionen-Dollar Schutzwall
-
Watts Up With That? (Antony Watts)
2015-03-27 en Outrageous: NOAA demands $262,000 fee for looking at their 'public' data
⇧ 2011
↑
Wärmegehalt der Ozeane ist geringer als bisher gedacht
en
Ocean Heat Content Adjustments: Follow-up and More Missing Heat
-
Klimaskeptiker Info
2011-03-20 de Wärmegehalt der Ozeane ist geringer als bisher gedacht
-
Watts Up With That? (Antony Watts)
2011-03-20 en Ocean Heat Content Adjustments: Follow-up and More Missing Heat
Update
-
Watts Up With That? (Antony Watts)
2011-09-18 en Trenberth's missing heat? Look to the deep
⇧
17 Gefälschte Temperaturdaten
en Temperature Data Fraud
fr Manipulation de températures
Links zur Klimaschau
|
|
Temperatur‑Manipulationen:
▶Probleme,
▶Wissenschaft
Wissenschaft: ▶Gefälschte Temperaturdaten Wissenschaft: ▶Nachträgliche Temperatur‑Manipulationen Wissenschaft: ▶Temperaturmessungen durch Satelliten Manifestationen: ▶Temperaturen Klima-Skandal: ▶Manipulationen |
- a de
Die wunderbare Welt der Temperaturdaten-Korrekturen:
Und plötzlich hatte sich der Trend ins Gegenteil verkehrt
en New paper blames about half of global warming
on weather station data homogenization - b de
Neue Studie enthüllt: US Wetterbehörde NOAA setzt
die Erwärmung der letzten 30 Jahre doppelt so hoch an wie gemessen!
en New study shows half of the global warming in the USA is artificial - c de
Globale Temperaturen -
Erfindung von Daten mit Erwärmung dort, wo es gar keine gibt
en Meshing issues on global temperatures - warming data where there isn't any
↑
a Die wunderbare Welt der Temperaturdaten-Korrekturen: Und plötzlich
hatte sich der Trend ins Gegenteil verkehrt
en New paper blames about half of global
warming on weather station data homogenization
|
|
↑
b Neue Studie enthüllt: US Wetterbehörde NOAA setzt die Erwärmung der
letzten 30 Jahre doppelt so hoch an wie gemessen!
en New study shows half of the global
warming in the USA is artificial
|
|
|
|
⇧
18 Nachträgliche Temperatur-Manipulationen
en
Subsequent temperature manipulations by NASA-GISS
fr
Manipulations de température ultérieures
par NASA-GISS
Links zur Klimaschau
|
|
Temperatur‑Manipulationen:
▶Probleme,
▶Wissenschaft
Wissenschaft: ▶Gefälschte Temperaturdaten Wissenschaft: ▶Nachträgliche Temperatur‑Manipulationen Wissenschaft: ▶Temperaturmessungen durch Satelliten Manifestationen: ▶Temperaturen Klima-Skandal: ▶Manipulationen |
-
EIKE Europäisches Institut für Klima und Energie
Prof. Ewert
2016-03-28 de EIKE 9. IKEK: Prof. Ewert - Erderwärmung- Was wurde gemessen und wie
wurde ausgewertet?
NASA-GISS-Temperaturdaten wurden geändert
-
EIKE Europäisches Institut für Klima und Energie
2015-11-24 de Manipulierte Temperatur-Daten? Erderwärmung - was wurde gemessen und wie wurde ausgewertet ?
Reykjavik
|
Bis vor ein paar Wochen sah beim GISS die Temperaturgraphik für Reykjavik auf Island so aus: |
Jetzt stellt sich die Graphik so dar: |
|
In den 1930er und 1940er Jahren war es dort wärmer als in der Gegenwart. |
mit 1930er und 1940er Jahren, die viel kälter waren als die Gegenwart. |
|
|
|
Godthab Nuuk
Arhangel
-
EIKE Europäisches Institut für Klima und Energie
2013-03-17 de Aus Erwärmung wird Abkühlung und wieder Erwärmung- Temperaturdaten von Mallorca: Original vs. NASA-GISS?
Palma de Mallorca
-
Friedrich-Karl Ewert
de NASA-GISS-Temperaturdaten wurden geändert - warum ?
Harare und Moosonee
Alice Springs und Dublin
Darwin
Prag
Wien
Hohenpeißenberg
USA insgesamt
-
Real Science
2016-01-15 en "If the facts don't fit the theory, change the facts."
 NASA US temperature data is based on NOAA USHCN data, which is
massively altered to create the appearance of warming.


 The graph below shows how the NOAA data is altered.
The blue line shows the averaged measured temperature at all USHCN stations, and the red line shows the average adjusted temperature.The warming trend over the last century is entirely due to "adjustments" by NOAA.
Note how the "1940s blip" has been largely removed.

|
|
|
|
|
de
(a) = Ursprüngliche Angabe
en
(a) = Original indication |
|
|
en
GISS 1999 vs 2008 Data interpretation |
⇧
19 Manifestationen (Temperaturen)
en Manifestations
fr Manifestations
Links zur Klimaschau
|
|
Temperatur‑Manipulationen:
▶Probleme,
▶Wissenschaft
Wissenschaft: ▶Gefälschte Temperaturdaten Wissenschaft: ▶Nachträgliche Temperatur‑Manipulationen Wissenschaft: ▶Temperaturmessungen durch Satelliten Manifestationen: ▶Temperaturen Klima-Skandal: ▶Manipulationen |
- a de
49 ehemalige NASA-Wissenschaftler und Astronauten wenden sich gegen
die einseitige Öffentlichkeitsarbeit der NASA zum Klima
en 49 Former NASA Scientists Send A Letter Disputing Climate Change - b de
300 Wissenschaftler wollen, dass die NASA endlich aufhört, Wahrheit zu
verstecken
en 300 Scientists Tell Chairman of the House Science Committee: 'we want NOAA to adhere to law of the Data Quality Act'
↑
49 ehemalige NASA-Wissenschaftler und Astronauten wenden sich gegen
die einseitige Öffentlichkeitsarbeit der NASA zum Klima
en 49 Former NASA Scientists Send A Letter Disputing Climate Change
-
Klimaskeptiker Info
2012-04-10 de 49 ehemalige NASA-Wissenschaftler und Astronauten wenden sich gegen die einseitige Öffentlichkeitsarbeit der NASA zum Klima
-
Science Skeptical Blog
2012-04-11 de GISS: Sind die Tage der Fälscherwerkstatt unter dem Schirm der NASA gezählt?Jetzt haben ehemalige NASA-Wissenschaftler und Astronauten die Nase voll von den Machenschaften des Goddard Institute For Space Studies (GISS), von J. Hansen und Gavin Schmidt und ihrem Klima-Unfug.
In einem gemeinsamen, beissenden Brief an die NASA-Administration rügen sie die Agentur für ihre Haltung, anthropogene CO2-Emissionen mit grosser Sicherheit als Hauptgrund für den Klimawandel hinzustellen, während empirische Beweise vernachlässigt werden, welche die Theorie infrage stellen.
Die Gruppe, welche sieben Apollo-Astronauten und zwei ehemalige Direktoren des Johnson Space Centers der NASA in Houston umfasst, sind erschrocken über die Unfähigkeit der NASA, insbesondere des GISS, eine objektive Bewertung aller verfügbaren wissenschaftlichen Daten zum Klimawandel erbringen zu können.
Sie klagen, die NASA vertraue zu sehr komplexen Klimamodellen, welche doch ihre wissenschaftlichen Unzulänglichkeiten bei der Vorhersage von Klima über ein oder zwei Jahrzehnte im voraus offenbart haben.
GISS hat sich bekanntermassen durch wiederholte, manipulative Modifikationen der GISS Temperatur-Datenreihen und durch unseriöse Filterung der Temperaturdaten von Meßstationen "verdient" gemacht.
-
Real Science (Steven Goddard)
2016-02-07 en The Wrong StufflFour years ago, the people with The Right Stuff sent this letter to NASA satellite deniers James Hansen and Gavin Schmidt, who are completely destroying the agency's reputation with their junk science.
March 28, 2012
Letter to The Honorable Charles Bolden, Jr. NASA Administrator NASA Headquarters Washington, D.C. 20546-0001We, the undersigned, respectfully request that NASA and the Goddard Institute for Space Studies (GISS) refrain from including unproven remarks in public releases and websites.
We believe the claims by NASA and GISS, that man-made carbon dioxide is having a catastrophic impact on global climate change are not substantiated, especially when considering thousands of years of empirical data.
With hundreds of well-known climate scientists and tens of thousands of other scientists publicly declaring their disbelief in the catastrophic forecasts, coming particularly from the GISS leadership, it is clear that the science is NOT settled.
The unbridled advocacy of CO2 being the major cause of climate change is unbecoming of NASA's history of making an objective assessment of all available scientific data prior to making decisions or public statements.
As former NASA employees, we feel that NASA's advocacy of an extreme position, prior to a thorough study of the possible overwhelming impact of natural climate drivers is inappropriate.
We request that NASA refrain from including unproven and unsupported remarks in its future releases and websites on this subject.
At risk is damage to the exemplary reputation of NASA, NASA's current or former scientists and employees, and even the reputation of science itself.
For additional information regarding the science behind our concern, we recommend that you contact Harrison Schmitt or Walter Cunningham, or others they can recommend to you.
-
Die kalte Sonne (Fritz Vahrenholt, Sebastian Lüning)
2012-04-19 de 50 ehemalige NASA Astronauten und Wissenschaftler fordern die NASA zu mehr Realismus in der Klimadebatte aufDie US-amerikanische Weltraumbehörde NASA ist eine vielverzweigte Organisation mit einer großen Meinungsvielfalt, auch in der Klimadebatte.
Allerdings gibt es ein NASA-Institut, das sich seit Jahren mit wilden Katastrophenszenarien in der Öffentlichkeit hervortut und das Klimabild der NASA nach außen hin dominiert.
Hierbei handelt es sich um das Goddard Institute for Space Studies (GISS).
Treibende Kräfte sind die Wissenschaftsaktivisten James Hansen und Gavin Schmidt, die schon seit längerem die Meinungsführerschaft in der NASA in der Klimadiskussion an sich gerrissen haben.
Hansens extreme Denkweise wurde kürzlich von Dirk Maxeiner in einem Artikel für die Basler Zeitung in Erinnerung gerufen. Maxeiner: "Für den bekannten amerikanischen Klimaforscher James Hansen stellt sich mit Blick auf kalbende Gletscher die Frage:
'Können diese krachenden Eismassen als eine Kristallnacht dienen, die uns aufweckt?'
Angesichts eines mit Kohle beladenen Güterzuges fühlte [Hansen] sich zu der Bemerkung veranlasst:
'Wenn wir es nicht schaffen den Bau neuer Kohlekraftwerke zu verhindern, dann sind dies Todeszüge - nicht weniger grausam als die Waggons, die ins Krematorium fuhren.'
Gavin Schmidt ist Mitbegründer und Mitautor des IPCC-nahen Blogs RealClimate.
Eine Gruppe von 50 ehemaligen NASA-Wissenschaftlern, Ingenieuren und Astronauten hat nun einen öffentlichen Brief an den aktuellen NASA-Chef Charles Bolden, Jr. geschrieben, in dem sie von der Organisation eine weniger alarmistische und dafür wissenschaftlich ausgewogenere Sichtweise fordern.
Zu den Unterzeichnern gehören unter anderem sieben Apollo-Astronauten und zwei ehemalige Direktoren von NASA's Johnson Space Center in Houston, darunter Christopher Kraft, der maßgeblich an vielen wichtigen NASA-Flugmissionen wie Apollo und Space Shuttle beteiligt war.
Die NASA-Gruppe bemängelt zu recht, dass natürliche Klimafaktoren in den aktuellen Klimamodellen des Weltklimarats stark unterschätzt werden.
Dazu muss man wissen, dass es in der vorindustriellen Zeit der letzten 10.000 Jahre charakteristische Klimaveränderungen gegeben hat, die synchron zur Sonnenaktivität verlaufen sind, was jedoch vom IPCC weitgehend ignoriert wird und als Rauschen abgetan wird.
↑
300 Wissenschaftler wollen, dass die NASA endlich aufhört, Wahrheit zu
verstecken
en
300 Scientists Tell Chairman of the House Science Committee:
'we want NOAA to adhere to law of the Data Quality Act'
-
EIKE Europäisches Institut für Klima und Energie
2016-02-04 de 300 Wissenschaftler wollen, dass die NASA endlich aufhört, Wahrheit zu versteckenHunderte Wissenschaftler haben den Gesetzgebern kürzlich einen Brief gesandt, in dem sie davor warnten, dass Wissenschaftler der National Oceanic and Atmospheric Administration (NOAA) Gesetze gebrochen haben könnten, als sie im vorigen Jahr eine Studie veröffentlichten, in der der seit 15 Jahren andauernde 'Stillstand' der globalen Erwärmung aus den Temperaturaufzeichnungen eliminiert werden sollte.
-
Watts Up With That? (Antony Watts)
2016-01-28 en 300 Scientists Tell Chairman of the House Science Committee: 'we want NOAA to adhere to law of the Data Quality Act'The issue is with bad data, as Dr. Pat Michaels Dr. Richard Lindzen, and Dr. Chip Knappenberger observed related to the switch from buckets on a rope to engine water inlets for measuring sea surface temperature:
"As has been acknowledged by numerous scientists, the engine intake data are clearly contaminated by heat conduction from the structure, and as such, never intended for scientific use,"
"Adjusting good data upward to match bad data seems questionable."
"If we subtract the ERSST.v3b (old) data from the new ERSST.v4 data, Figure 11, we can see that that is exactly what NOAA did."
"It's the same story all over again; the adjustments go towards cooling the past and thus increasing the slope of temperature rise.
Their intent and methods are so obvious they're laughable."
"We, the undersigned, scientists, engineers, economists and others, who have looked carefully into the effects of carbon dioxide released by human activities, wish to record our support for the efforts of the Committee on Science, Space and Technology to ensure that federal agencies complied with federal guidelines that implemented the Data Quality Act," some 300 scientists, engineers and other experts wrote to Chairman of the House Science Committee, Texas Republican Rep. Lamar Smith.
"In our opinion... NOAA has failed to observe the OMB [Office of Management and Budget] (and its own) guidelines, established in relation to the Data Quality Act."
| de | en | fr |
|---|---|---|
|
Klimawandel: Beurteilung Manifeste, Petitionen und Koalitionen gegen die offizielle Klimapolitik |
Climate change: Evaluation Manifestos, Petitions and Coalitions against the official climate policy |
Climat: Évaluation Manifestations, pétitions et coalitions contre la politique officielle sur le climat |
⇧
20 Qualität der Temperaturdaten
en
Station Site Quality Rating
fr
Qualité des mesures de températures
- a de
SurfaceStations.org: Sind die USA Temperaturmessungen zuverlässig?
en Is the U.S. Surface Temperature Record Reliable? - b de
Wie schlecht sind die globalen Temperaturdaten?
en How bad is the global temperature data? - c de
Temperaturvariationen in Ostafrika - nicht genügend Meßstationen
en Out of Africa: A new paper by Christy on surface temperature issues - d de
GISS "korrigiert" mit wenigen Meßstationen den großen Rest
en And now, the most influential station in the GISS record is ...
↑
a SurfaceStations.org: Sind die USA Temperaturmessungen zuverlässig?
en Is the U.S. Surface Temperature Record Reliable?
-
SurfaceStations.org / Antony Watts
en Is the U.S. Surface Temperature Record Reliable?
↑
b Wie schlecht sind die globalen Temperaturdaten?
en How bad is the global temperature data?
-
Klimaskeptiker Info
2009-10-13 de Wie schlecht sind die globalen Temperaturdaten?Die Alarmisten wollen der Welt einreden, die 1990er Jahre seien das wärmste Jahrzehnt des 20. Jahrhunderts gewesen.
Zwischen 1978 und 2008 ist die Zahl der in der GISS-Temperaturreihe verwendeten Meßstationen von über 6000 auf gerade einmal 1079 gefallen.
Die meisten Stationen wurden um 1990 aussortiert.
Die vom GISS verarbeiteten Temperaturdaten sind lückenhaft und verfälscht.
Die Filterung der Stationen und die Ersetzung fehlender Daten sind in einer Weise erfolgt, daß sie einen Erwärmungstrend gegen Ende des 20. Jahrhunderts unterstützen oder erst hervorrufen.
Die vom GISS und seinem Chef James Hansen, einem der Miterfinder der vermeintlich drohenden Klimakatastrophe, präsentierten Temperaturdaten sind wertlos. Damit ist die behauptete Erwärmung des ausgehenden 20. Jahrhunderts im Ganzen zweifelhaft.
-
Watts Up With That? (Antony Watts)
2009-10-13 en How bad is the global temperature data?
↑
c Temperaturvariationen in Ostafrika - nicht genügend Meßstationen
en Out of Africa: A new paper by Christy on surface temperature issues
-
Klimaskeptiker Info
2009-07-18 de Temperaturvariationen in Ostafrika - nicht genügend MeßstationenNach der Analyse von Temperaturdaten aus dem Zeitraum 1905 bis 2004 aus Ostafrika kommen eine Studie von John R. Christy, William B. Noris und Richard T. McNider vom Earth System Science Center, University of Alabama in Huntsville u. a. zu folgenden Schlüssen:
-
Wärend die Tageshöchsttemperaturen keinen Trend aufweisen, der sich signifkant von 0 unterscheidet, scheinen die Tagestiefsttemperaturen einen sich beschleunigenden Anstieg aufzuweisen.
-
Die Differenz der Veränderungen von Tageshöchst- und Tagestiefsttemperaturen könnte die Reaktion auf komplexe Entwicklungen in der Grenzschicht sein.
Gerade die Tagestiefsstemperaturen werden besonders durch die Bodennutzung und lokal erzeugte Aerosole (z.B. Staub) beeinflußt.
-
Der Anstieg der Tagestiefststemperaturen könnte mit der wirtschaftlichen Entwicklung Ostafrikas sowie mit dem Bevölkerungszuwachs der betrachteten 100 Jahre zu tun haben.
-
Die untersuchten Daten beruhen auf einem in der zweiten Hälfte des 20. Jahrhunderts dichter werdenden Netz von Meßstationen.
Das Netz der von den globalen Temperaturreihen GISS und Hadley herangezogenen Stationen wurde dagegen in den letzten Jahrzehnten immer dünner.
Besonders in Ostafrika zeichnen sich die Datensamllungen, die einen globalen Trend ermitteln wollen, drch riesige rämliche Lücken aus.
-
Oberflächentemperaturreihen wie GISS und Hadley weisen global einen weit höheren Steigerungstrend aus, als er in Ostafrika regional gefunden wird.
Gleichzeitig geht Ostafrika aber nur mit wenigen Meßstationen in die Datensammlung ein.
Wenn weltweit noch andere Gebiete, die für sich genommen einen von der bisher errechneten globaeln Entwicklung abweichenden Trend aufweisen, durch den Mangel an Temperaturdaten in die Berechnung der globalen Trends nur unterrepräsentiert eingehen oder die fehlenden Daten interpoliert (sprich geschätzt) werden, kann dies zu einer signifikanten Verfälschung des globalen Temperaturtrends führen.
-
-
Statt die neu hinzugekommenen Wetterstationen zu nutzen, ziehen die Oberflächendatensammler wie GISS, Hadley, NOAA es vor, riesige Gebiete ohne Daten zu lassen und dennoch eine globale Durchschnittstemperatur zu berechnen.
Eigenartigerweise bestätigen die Daten dieser (und nur dieser!) Temperaturreihen die globale Erwärmung und damit die vermeintliche Existenzberechtigung solcher "Klimainstitute".
Die Satellitendaten von UAH und RSS zeigen einen weit schwächeren Erwärmungstrend, falls überhaupt.
-
Watts Up With That? (Antony Watts)
2009-07-18 en Out of Africa: A new paper by Christy on surface temperature issues
↑
d GISS "korrigiert" mit wenigen Meßstationen den großen Rest
en And now, the most influential station in
the GISS record is ...
-
Klimaskeptiker Info
2009-07-20 de GISS "korrigiert" mit wenigen Meßstationen den großen RestGISS "korrigiert" mit wenigen Meßstationen den großen Rest.
Daß sehr viele der noch bestehenden und vom GISS und dem NCDC der NOAA in ihre Temperaturdatenreihen eingearbeiten Wetterstationen an Standorten stehen, die für genaue Messungen bestenfalls ungünstig sind, wurde an dieser Stelle bereits berichtet.
Beim GISS werden die Stationen, die als von urbanen Wärmeproblemen betroffen gelten, mit Hilfe der Daten anderer nahegelgener Stationen "korrigiert".
Als "nahegelegen" zählen dabei Stationen, die weniger als 1000 Kilometer entfernt sind.
John Goetz hat sich die Mühe gemacht, anhand der veröffentlichten Daten zu ermitteln, wie viele "schlechte" Stationen mit den Daten der "guten" korrigiert wurden, und ist dabei auf interessante Tatsachen gestoßen:
-
Jede der guten Stationen wird vielfach verwendet.
Der Spitzenreiter ist eine Station in Bradfort (selbst auf einem Flugplatz gelegen, also potentiell problematisch), die 251mal benutzt wurde.
-
Keine der guten Stationen hat nach 2007 noch Daten geliefert.
-
Etliche der vermeintlich guten Stationen wurden von Freiwilligen des Projektes surfacestations.org überprüft und stellten sich ihrerseits als problematisch heraus.
-
Es spielt für die Klassifizierung als "gute" Station offenbar keine Rolle, welchen Standort die Station in der Vergangenheit hatte.
Die aktuelle Einstufung als "ländlich" genügt.
Die GISS-Korrekturen sind den kritischen Beobachtern schon immer suspekt.
Diese Untersuchung liefert einen weiteren Beleg dafür, daß die GISS-Daten annähernd wertlos sind.
-
-
Watts Up With That? (Antony Watts)
2009-07-20 en And now, the most influential station in the GISS record is ...
⇧
21 Wärmeinseln
en Urban Heat Islands
fr Îlots de chaleur urbain
Links zur Klimaschau
|
|
▶Wämeinseleffekt ▶DWD Deutscher Wetterdienst ▶Nicola Scafetta |
- a de
Urbane Hitze beeinflußt globale Temperaturreihen
en UHI - Urban Heat Islands - b en Spencer: Global Urban Heat Island Effect Study - An Update
- c de
Wie der Wärmeinsel-Effekt zur Aufrechterhaltung der Großen Lüge benutzt wird
en Using UHI To Create The Big Lie
fr Utilisation des îots de chaleur urbain pour tricher - d en A UHI Tale of Two Cities
- e de
Zusammenhang zwischen UHI bzw. Energieverbrauch und langzeitlichen
Temperaturänderungen in China
en A new paper showing how UHI and energy consumption are linked
to long-term temperature change in China - f en Urban Heat May Warm Faraway Places
- g de Neues vom städtischen Wärmeinseleffekt aus den USA
- h de Beispiele en Examples fr Exemples
↑
a Urbane Hitze beeinflußt globale Temperaturreihen
en UHI - Urban Heat Islands
de
-
Klimaskeptiker Info
2010-01-05 de Urbane Hitze beeinflußt globale Temperaturreihen
Wenn man die gesammelten Temperaturdaten der Stationen in städtischen Umgebungen und derer in ländlichen Umgebungen getrennt auswertet, ergibt sich ein deutlicher Unterschied.
Während die städtischen GHCN-Stationen bei der Auswertung der Daten seit 1978 einen linearen Erwärmungstrend von 0,32°C pro Jahrzehnt gezeigt haben, ist dieser Wert bei den ländlichen GHCN-Stationen lediglich 0,20°C pro Jahrzehnt.
-
EIKE Europäisches Institut für Klima und Energie
2010-10-04 de Der Wärmeinseleffekt (WI) als Antrieb der Temperaturen - eine Wertung der DWD-TemperaturmessstationenAlle sozio-ökonomischen Aktivitäten der Menschen ändern sowohl die unmittelbare Umgebung, als auch deren Energiebilanz.
In Bezug auf das lokale Klima wirkt sich diese Aktivität u.a in einer schleichenden aber deutlichen Temperaturerhöhung aus.
Dieser Effekt verfälscht also klimatologische Messungen um den Beitrag der durch Urbanisierung, andere Landchaftsnutzung oder Bewuchs entsteht.
Fast immer sind diese Veränderungen nicht dokumentiert, und können bestenfalls - und auch nur für wenige Orte auf der Erde - grob geschätzt werden.
Deswegen sind diese Veränderungen aus den Klima-Messwerten auch nicht herausrechenbar.
Jede Temperaturmessung die für klimatologische Zwecke eingesetzt werden soll, sollte daher einem rigorosen WI-Test unterzogen werden.
Zumindest sollte versucht werden die Größenordnung des daraus resultierenden Fehlerbandes abzuschätzen. Sonst ist das Ergebnis in aller Regel zu hoch. Das geschieht aber selten bis nie. Auch nicht in Deutschland, wie der folgende Beitrag Teil I und der in Kürze erscheinende Teil II zeigen.
Fast täglich werden wir Zuschauer von den Fernsehmedien mit der Botschaft beworfen: Deutschland würde wärmer, die Katastrophe zeichne sich bereits ab, Umkehr tue dringend not.
Das Energiekonzeot der schwarz-gelben Regierung greift diese Angstbotschaften auf und setzt sie in verheerende Energiepolitik um.
Dabei beruhen die Angstszenarien und verkündeten Temperaturanstiege häufig auf einer selektiven Auswahl von wärmer werdenden Messstationen.
Oft an Flughäfen gelegen (ca. 40 %), werden diese durch den rapide gestiegenen Flugbetrieb kräftig beeinflusst.
Sie messen also deren Erwärmung - ausgelöst durch den weltweit angestiegenen Flugverkehr - untrennbar mit.
Das dies auch in Deutschland so ist zeigt der untenstehende Bericht.
Die Meteorologen Frau Niedek und Herr Dr. Tiersch vom ZDF werden stellvertretend für den DWD gebeten zu erklären, warum sie uns solche Daten auftischen.
-
Watts UP With That? (Antony Watts)
2009-03-18 en Finally - an honest quantification of urban warming by a major climate scientist
-
Wahrheiten Org
2011-01-27 en Wärmeinseleffekt täuscht Klimaerwärmung vor
en
-
the Air Vent
2010-01-05 en CRU 3b - Urban Warm Bias in GHCN
So the Rural stations show about 0.7C of warming since 1978. Visibly less warming than the urban stations by themselves.
Also note the slight downtrend in recent years.
Since the industrial revolution occurred a hundred years ago, it's hard to imagine this curve is created by CO2.
Still I'm not denying the heat capturing ability of CO2, just that the curves here don't show a continuous warming but rather a short term recent spike.
↑ b en Spencer: Global Urban Heat Island Effect Study - An Update
-
Watts Up With That? (Antony Watts)
2010-03-10 en Spencer: Global Urban Heat Island Effect Study - An Update
↑
c Wie der Wärmeinsel-Effekt zur Aufrechterhaltung der Großen Lüge benutzt wird
en Using UHI To Create The Big Lie
fr Utilisation des îots de chaleur urbain pour tricher
|
|
|
-
Klimaskeptiker Info (Andreas Kreuzmann)
2012-02-17 de Wie der Wärmeinsel-Effekt zur Aufrechterhaltung der Großen Lüge benutzt wirdIn der wirklichen Welt gibt es seit etwa 15 Jahren keine Erwärmung mehr, gleichzeitig steigt die Konzentration des CO2 in der Atmosphäre weiter ungebremst an.
Dies ist der stärkste empirische Hinweis darauf, daß die Behauptung, die globalen Temperaturen kaum von den vielgescholtenen "Treibhausgasen" beeinflußt werden.
In alarmistischen Blogs liest man freilich das geneua Gegenteil.
↑ d en A UHI Tale of Two Cities
-
Watts Up With That? (Antony Watts)
2010-03-11 en A UHI Tale of Two Cities
| de | en | fr |
|---|---|---|
| Fehler der "Klimamacher", Teil I | Errors of the "Climatemakers", Part I | Erreurs des "faiseurs du climat", partie I |
| Fehlerhafte Temperatur-Messungen | Not reliable temperature measurements | Faux mesurages de températures |
| Links auf dieser Website | Links on this Website | Liens sur ce site web |
↑
e Zusammenhang zwischen UHI bzw. Energieverbrauch und langzeitlichen
Temperaturänderungen in China
en A new paper showing how UHI and energy
consumption are linked to long-term temperature change in China
-
EIKE Europäisches Institut für Klima und Energie
2012-10-09 de Neue Studie: Zusammenhang zwischen UHI bzw. Energieverbrauch und langzeitlichen Temperaturänderungen in China
-
Watts UP With That? (Antony Watts)
2012-10-02 en A new paper showing how UHI and energy consumption are linked to long-term temperature change in China
↑ f en Urban Heat May Warm Faraway Places
-
National Geographic
2013-01-28 en Urban Heat May Warm Faraway PlacesNew research shows that a hot city can heat up distant locales by almost 2ºF.
↑ g Neues vom städtischen Wärmeinseleffekt aus den USA
-
Die kalte Sonne (Fritz Vahrenholt, Sebastian Lüning)
2017-02-08 de Neues vom städtischen Wärmeinseleffekt aus den USA
↑
h Beispiele
en Examples
fr Exemples
Berlin 2015-10-01
-
NoTricksZone (Pierre L. Gosselin)
2015-10-02 en This Morning's Temperature Readings From Berlin's 7 Stations Profoundly Illustrate Urban Heat Island Effec
Datenquelle:
-
WetterKontor
2015-10-02 de Berlin
⇧
22 Wie man Temperaturen nicht misst
en
How not to measure temperature
fr
Comment on ne mesure pas les températures
de Allgemein en General fr Générale
| de | en | fr |
|---|---|---|
| Fehler der "Klimamacher", Teil I | Errors of the "Climatemakers", Part I | Erreurs des "faiseurs du climat", partie I |
| Fehlerhafte Temperatur-Messungen | Not reliable temperature measurements | Faux mesurages de températures |
| Links auf dieser Website | Links on this Website | Liens sur ce site web |
de Verzeichnis en Contents fr Sommaire
- 2018
- de
Alarmisten werfen das Handtuch bzgl. der schlechten Qualität
von Temperaturdaten
- und stimmen für ein neues globales Klima-Referenz-Netzwerk
en Alarmists throw in the towel on poor quality surface temperature data - pitch for a new global climate reference network
en Towards a global land surface climate fiducial reference measurements network - 2015
- en Press Release - Watts at #AGU15 The quality of temperature station siting matters for temperature trends
- 2014
- en Report from the Office of the Inspector General: Global Climate Change Program Data May Be Unreliable
- 2009
- en Report 2009: Is the U.S. Surface Temperature Record Reliable?
- en An old friend put out to pasture: Marysville is no longer a USHCN climate station of record
- en Revisiting Detroit Lakes
- en How not to measure temperature, part 85: what Katrina did for temperature measurement
- 2007
- fr Performance des capteurs terrestres
de Text en Text fr Texte
⇧ 2018
↑
Alarmisten werfen das Handtuch bzgl. der schlechten Qualität
von Temperaturdaten
- und stimmen für ein neues globales Klima-Referenz-Netzwerk
en
Alarmists throw in the towel on poor quality surface temperature data -
pitch for a new global climate reference network
en
Towards a global land surface climate fiducial reference measurements
network
-
EIKE Europäisches Institut für Klima und Energie
Anthony Watts / Chris Frey
2018-03-07 de Alarmisten werfen das Handtuch bzgl. der schlechten Qualität von TemperaturdatenFür mich fühlt sich das wie eine Rechtfertigung an.
Seit Jahren weise ich darauf hin, wie schlecht das globale Klima-Monitoring-System in den USA und global ist.
Es gibt Stationen auf gepflasterten Flächen, an Flughäfen, wo sie dem Ausstoß der Triebwerke ausgesetzt sind oder Thermometer direkt neben der Abluft aus Air Conditioning-Anlagen.
Man sagte uns, dass dies "keine Rolle spielt" und dass "das Monitoring-Netzwerk gute Daten liefert".
Hinter den Kulissen jedoch erfuhren wir, dass NOAA/NCDC einknickten, als wir davon berichteten, und klammheimlich einige der schlimmsten Stationen still legten, während sie gleichzeitig fieberhaft und verzweifelt PR-Initiativen lostraten, um das Narrativ der "guten Daten" aufrecht zu erhalten.
Für ein globales treuhänderisches Netzwerk von Referenz-Messungen der globalen Temperatur
P. W. Thorne, H. J. Diamond, B. Goodison, S. Harrigan, Z. Hausfather, N. B. Ingleby, P. D. Jones, J. H. Lawrimore, D. H. Lister, A. Merlone, T. Oakley, M. Palecki, T. C. Peterson, M. de Podesta, C. Tassone, V. Venema, K. M. Willett
Abstract
Es gibt sehr starke Beweise dafür, dass sich das Klimasystem seit der Durchführung instrumenteller meteorologischer Beobachtungen erwärmt hat.
Der 5. Zustandsbericht des IPCC kam zu dem Ergebnis, dass die Beweise für eine Erwärmung eindeutig waren.
Allerdings verbleiben aufgrund nicht perfekter Messungen und allgegenwärtiger Änderungen der Messungen und der Messverfahren Unsicherheiten hinsichtlich vieler Details dieser historischen Änderungen.
Diese Unsicherheiten stellen den Trend oder die Größenordnung insgesamt der Änderungen im globalen Klimasystem in Frage.
Aber sie sorgen dafür, dass das Bild unklarer als nötig ist, vor allem im lokalen Maßstab, obwohl dort viele Entscheidungen hinsichtlich von Anpassungs-Maßnahmen getroffen werden müssen, sowohl derzeit als auch in Zukunft.
Ein Satz treuhänderischer Referenz-Messungen grundlegender Klima-Variablen hoher Qualität wird es zukünftigen Generationen ermöglichen, rigorose Abschätzungen zukünftigen Klimawandels und -variabilität vorzunehmen.
Damit kann man die Gesellschaft mit den bestmöglichen Informationen zur Stützung zukünftiger Entscheidungen versorgen.
Hier begründen wir, dass mittels Implementierung und Erhalt eines stabilen und meteorologisch gut abgesicherten Referenz-Netzwerkes die heutige wissenschaftliche Gemeinschaft zukünftigen Generationen einen besseren Satz von Beobachtungen hinterlassen kann.
Dies wird bei Entscheidungen über die zukünftige Anpassung helfen und bei der Überwachung und Quantifizierung der Effektivität international abgestimmter Anpassungs-Maßnahmen.
Dieser Artikel bietet den Hintergrund, nämlich rationale, meteorologische Prinzipien, und umreißt praktische Überlegungen, was in ein solches Netzwerk eingehen müsste, und auch die wahrscheinlich anfallenden Vorteile.
Die Herausforderung besteht natürlich darin, wie man eine solche Vision in eine langfristige nachhaltige Tauglichkeit überführen kann, welche die notwendigen und gut charakterisierten Messreihen ergibt, die der globalen Wissenschaft und zukünftigen Generationen zum Vorteil gereichen.
-
Watts UP With That? (Antony Watts)
2018-03-02 en Alarmists throw in the towel on poor quality surface temperature data - pitch for a new global climate reference networkTo me, this feels like vindication. For years,
I've been pointing out just how bad the U.S. and Global Surface monitoring network has been.
We've seen stations that are on pavement, at airports collecting jet exhaust, and failing instruments reading high, and right next to the heat output of air conditioning systems.
We've been told it "doesn't matter" and that "the surface monitoring network is producing good data".
Behind the scenes though, we learned that NOAA/NCDC scrambled when we reported this, quietly closing some of the worst stations, while making feverish and desperate PR pitches to prop up the narrative of "good data".
Quelle / Source:
-
International Journal of Climatology
2018-03-01 en Towards a global land surface climate fiducial reference measurements networkP. W. Thorne, H. J. Diamond, B. Goodison, S. Harrigan, Z. Hausfather, N. B. Ingleby, P. D. Jones, J. H. Lawrimore, D. H. Lister, A. Merlone, T. Oakley, M. Palecki, T. C. Peterson, M. de Podesta, C. Tassone, V. Venema, K. M. Willett
Abstract
There is overwhelming evidence that the climate system has warmed since the instigation of instrumental meteorological observations.
The Fifth Assessment Report of the Intergovernmental Panel on Climate Change concluded that the evidence for warming was unequivocal.
However, owing to imperfect measurements and ubiquitous changes in measurement networks and techniques, there remain uncertainties in many of the details of these historical changes.
These uncertainties do not call into question the trend or overall magnitude of the changes in the global climate system.
Rather, they act to make the picture less clear than it could be, particularly at the local scale where many decisions regarding adaptation choices will be required, both now and in the future.
A set of high-quality long-term fiducial reference measurements of essential climate variables will enable future generations to make rigorous assessments of future climate change and variability, providing society with the best possible information to support future decisions.
Here we propose that by implementing and maintaining a suitably stable and metrologically well-characterized global land surface climate fiducial reference measurements network, the present-day scientific community can bequeath to future generations a better set of observations.
This will aid future adaptation decisions and help us to monitor and quantify the effectiveness of internationally agreed mitigation steps.
This article provides the background, rationale, metrological principles, and practical considerations regarding what would be involved in such a network, and outlines the benefits which may accrue.
The challenge, of course, is how to convert such a vision to a long-term sustainable capability providing the necessary well-characterized measurement series to the benefit of global science and future generations.
⇧ 2015
↑ en Press Release - Watts at #AGU15 The quality of temperature station siting matters for temperature trends
-
Watts UP With That? (Antony Watts)
2015-12-17 en Press Release - Watts at #AGU15 The quality of temperature station siting matters for temperature trends30 year trends of temperature are shown to be lower, using well-sited high quality NOAA weather stations that do not require adjustments to the data.
⇧ 2014
↑ en Report from the Office of the Inspector General: Global Climate Change Program Data May Be Unreliable
-
Watts UP With That? (Antony Watts)
2014-02-07 en Report from the Office of the Inspector General: Global Climate Change Program Data May Be UnreliableLack of oversight, non-compliance and a lax review process for the State Department's global climate change programs have led the Office of the Inspector General (OIG) to conclude that program data "cannot be consistently relied upon by decision-makers" and it cannot be ensured "that Federal funds were being spent in an appropriate manner."
⇧ 2009
↑ en Report 2009: Is the U.S. Surface Temperature Record Reliable?
-
Report by Anthony Watts / THE HEARTLAND INSTITUTE
2009 en Report: Is the U.S. Surface Temperature Record Reliable?
| Anthony Watts |
Anthony Watts is a 25-year broadcast meteorology veteran
chief meteorologist for KPAY-AM radio. He got his start as on-air meteorologist for WLFI-TV in Lafayette, Indiana and at KHSL-TV in Chico, California. In 1987, he founded ItWorks, which supplies broadcast graphics systems. In 2007, Watts founded SurfaceStations.org, a Web site devoted to photographing and documenting the quality of weather stations across the U.S. ▶Anthony Watts: Who is who (Skeptiker) ▶Anthony Watts: Wikipedia (Opfer) |
↑ en An old friend put out to pasture: Marysville is no longer a USHCN climate station of record
-
Watts Up With That? (Antony Watts)
2009-06-10 en An old friend put out to pasture: Marysville is no longer a USHCN climate station of record
↑ en Revisiting Detroit Lakes
-
Watts Up With That? (Antony Watts)
2009-06-09 en Revisiting Detroit Lakes
↑ en How not to measure temperature, part 85: what Katrina did for temperature measurement
-
Watts Up With That? (Antony Watts)
2009-03-23 en How not to measure temperature, part 85: what Katrina did for temperature measurement
⇧ 2007
↑ fr Performance des capteurs terrestres
-
Skyfall / Changement Climatique
2007-06-02 fr Performance des capteurs terrestres
⇧
23 Temperatur-Zyklen
en Temperature cycles
fr Cycles de température
de
![]() Sonne und Treibhausgase - Ursachen des Klimawandels
Sonne und Treibhausgase - Ursachen des Klimawandels
(
Quelle 1,
Quelle 2)
en
![]() Global Warming: Second Thoughts of an Environmentalist
Global Warming: Second Thoughts of an Environmentalist
A) Total Solar Irradiance (TSI)
B) Temperature Development

Two things are noteworthy:
-
Every time when solar activity was low, there were periods of cold weather.
Whenever the sun was strong (like in the current warm period, the Roman Warm Period and the Medieval Warm Period), there were warm periods.
-
Secondly, there is obviously a 1,000-year cycle with alternating hot and cold periods.
-
Die kalte Sonne (Fritz Vahrenholt, Sebastian Lüning)
2016-04-01 de Wonne-Monat überrascht: Kein Langfristiger Anstieg der Mai-Temperaturen in Deutschland während der vergangenen 100 Jahre
|
Südpazifischen Oszillation und kosmischen Strahlung
Eine Gegenüberstellung der um 30 Monate zeitverzögerten gleitenden 3 Jahresmittel der Südpazifischen Oszillation und der durch die Sonnenaktivität modulierten kosmischen Strahlung zeigt in Abb. 4d eine gute Übereinstimmung im periodischen Verlauf von 1980 bis 2008 und weist auf die extraterrestrische Beeinflussung der La Nina - El Nino Perioden hin.
|
de Kurzfassung
Vergleichbar mit den Untersuchungsergebnissen der Nordatlantischen Oszillation (NAO) wird auch die Südpazifische Oszillation (SO) durch Sonnenaktivität beeinflusst:
Während der Wärmeperiode ab 1980 wird eine Resonanz zwischen den Periodizitäten der Sonnenfleckenhäufigkeit in der 22. und 23. Sonnenfleckenperiode und des Sonnenwindindex "aa" mit der zeitverzögerten Südpazifischen Oszillation beobachtet.
Auch die durch die Magnetfelder der Sonnenwinde ausgelösten Periodizitäten der Kosmischen Strahlung sind in diesem Zeitraum mit der zeitverzögerten Südpazifische Oszillation (SO) in Resonanz (K=0,8).
Das führt zu solar gesteuerter Bewölkungsreduktion durch den Svensmark-Effekt und dadurch zu verstärkter Sonneneinstrahlung.
Es erfolgt so ein zusätzlicher Temperaturanstieg und eine zusätzliche Erwärmung des Ozeans in der südlichen Hemisphäre.
Diese solar bewirkte Meereserwärmung führt zur Emission von gelöstem CO2, was als Zusatzdüngung der Weltflora dient.
Eine Temperaturerhöhung durch CO2 lässt sich aus den Messwerten nicht ableiten.
Mit Beendigung der Sonnenaktivität im Dezember 2006 hat auch in der südlichen Hemisphäre eine kalte Wetterperiode begonnen.
en Abstract
It was found that the South Pacific Oscillation (SO) is influenced by Sun activity similar to the North Atlantic Oscillation (NAO).
Especially during the warming period from 1980 to 2009 the oscillation of Sunwind - Index "aa" was in good resonance with the delayed South Pacific Oscillation.
The same observation was found between the Oscillation of Cosmic Radiation, which is controlled by the Forbush - Reduction by the magnetic fields of the sun protons of the Sunwind and the delayed SO (K=0,8).
The consequence of this observations is the postulation, that the increase of global temperature in the Southern Hemisphere was caused by sun activity with strong emissions of Proton-rays in Earth's direction during the 22. and 23. Sunspot-Periods reducing Cosmic Rays with the consequence of reduction of cloudiness, increasing global rays and warming up the lower atmosphere (Svensmark - Effect).
As a consequence resolved CO2 was continuously emitted from the slowly warming up Ocean giving a good fertilizer of the flora of the world.
A relevance of CO2 concerning Climate Change could not be found.
With the end of Sun activity in 2006 a cold weather period has started in the Southern Hemisphere too.
| de | en | fr |
|---|---|---|
|
Klimawandel: Wissenschaft Ozeanzyklen & Ozeanische Oszillationen |
Climate change: Science Ocean Cycles & Ocean Oscillations |
Changement climatique: Science Cycles et oscillations océaniques |
| Ozeanzyklen steuern das Klima / El Niño (der Knabe/warm) & La Niña (das Mädchen/kalt) / ENSO: El Niño-Southern Oscillation / AMO: Atlantic Multidecadal Oscillation / NAO: North Atlantic Oscillation / AO: Arctic Oscillation / IOD: Indischer Ozean Dipol / PDO: Pacific decada oscillation | ||
| de | en | fr |
|---|---|---|
|
Die Sonne Sonnenzyklen |
The Sun Sunspot cycles |
Le soleil Cycles solaires |
⇧
24 Temperatur und Wärmeinhalt der Ozeane
en
Temperatures and Heat content of the oceans
fr
Températures et contenu thermique des océans
Links zur Klimaschau
|
|
▶Klima heute ▶Klima-Auswirkungen / Wetterphänomene: Temperaturen ▶Temperatur und Wärmeinhalt der Ozeane ▶WMO World Meteorological Organization ▶UK Met Office ▶Deutschland: Klimawandel in Deutschland │ ▶Wetterphänomene/Temperaturen: Klimawandel in Deutschland |
|
|
▶Temperatur und Wärmeinhalt der Ozeane |
Allgemein
Trends der Meerestemperaturen
en Trends in sea temperatures
fr Tendances des températures de la mer
|
Oberflächentemperaturen der Meere |
|
|
|
|
Wärmeinhalt Nord-Atlantik
|
Climate4you |
|
|
Ozeane / Oceans / Océans | ||
| ▷Die Kalte Sonne Blog‑Themen Vahrenholt/Lüning ▶Die kalte Sonne |
de
▷Ozeanzyklen
▷El Nino El Niño (warm) & La Niña (kalt) Perioden ▷AMO Atlantische Multidekaden-Oszillation / Atlantic Multidecadal Oscillation ▷NAO Nordatlantische Oszillation / North Atlantic Oscillation ▷PDO Pazifische Dekaden-Oszillation / Pacific Decadal Oscillation ▷Golfstrom / Gulf Stream ▷Ozeanische Wärme |
||
| EIKE | de Ozean | ||
| ►Der Wasserplanet (Ernst-Georg Beck) | de ▷Der hydrologische Zyklus (Wayback‑Archiv) | ||
| WUWT |
en
Ocean Page Oceanic Oscillation Page ENSO (El Nino/La Nina Southern Oscillation) Page Atmospheric Oscillation Page Potential Climatic Variables Page Geomagnetism Page |
||
| NoTricksZone |
en
Oceans
Sea Levels 100+ Papers - Sun Drives Climate |
||
| Popular Technology |
en
1350+ Peer-Reviewed Papers Supporting Skeptic Arguments Sea Level Gulf Stream Ocean Acidification Coral Reefs 1,500-Year Climate Cycle Satellite Temperatures Historic |
||
| Wikipedia |
|
||
| Vademecum |
▶Ozeanzyklen/Ozeanische Oszillationen
▶Welt-Info |
||
| Begriffe |
de
Begriffe und Definitionen en Terms and Definitions fr Termes et définitions |
||
| Siehe auch: |
▶El Niño (der Knabe/warm) & La Niña (das Mädchen/kalt)
▶ENSO: El Niño‑Southern Oscillation |
Verzeichnis
- 2017
- de
Überraschung: Oberfläche des Schwarzen Meeres hat sich in den
vergangenen 50 Jahren nicht erwärmt
en Black Sea water temperatures may buck global trend - de
Wie unbequem: Ozeane kühlen sich weiter ab
en Inconvenient: oceans continue to cool - de
Tropen führend bei Abkühlung der Ozeane
en Inconvenient: oceans continue to cool - de Obere Atlantikschichten widersetzen sich hartnäckig dem Aufwärmbefehl
- de
Ozeanischer Wärmeinhalt im letzten Jahr stark zurückgegangen:
Kurzfristeffekt oder Trendwende?
en New estimate of ocean heat finds more warming - 2016
- de NASA: Tiefe Ozeanschichten haben sich in den vergangenen 10 Jahren nicht erwärmt. Ursache der globalen atmosphärischen Erwärmungspause bleibt weiter offen
- de
Sind Festlands- und Ozean-Temperaturmittel von Bedeutung?
en Are land + sea averages meaningful ? - en On the Monumental Differences in Warming Rates between Global Sea Surface Temperature Datasets during the NOAA-Picked Global-Warming Hiatus Period of 2000 to 2014
- 2015
- de
Können wir eine Aussage darüber machen, ob sich die Ozeane
erwärmen?
en Can We Tell If The Oceans Are Warming? - 2014
- de
ARGO und der ozeanische Wärmegehalt
en Argo And Ocean Heat Content - de
ARGO: Große Bandbreite von Erwärmungs- (und Abkühlungs-)Raten
der Ozeane bis zu einer Tiefe von 2000 Metern
en With ARGO, There is a Wide Range Warming (and Cooling) Rates of the Oceans to Depths of 2000 Meters - de
Suche nach der angeblich im Ozean versunkenen Wärme endet mit Fehlschlag:
Tiefe Meeresschichten kühlten sich in den letzten 20 Jahren ab
en The "heat went to the oceans" excuse and Trenberth's missing heat is AWOL - deep ocean has not warmed since 2005 - en Cooling of North Atlantic Sea Surface Temperatures
- de Meeres-Temperaturen: kein Erwärmungstrend
- de
Die Tiefsee kühlt sich ab inmitten eines Meeres von Modell-Unsicherheit:
Neue Forschungen zum ozeanischen Wärmegehalt
en Deep Oceans Are Cooling Amidst A Sea of Modeling Uncertainty: New Research on Ocean Heat Content - de
Der Ozean hat meine globale Erwärmung gefressen
en The ocean ate my global warming - de
Vulkanische Eruptionen und ozeanischer Wärmegehalt
en Eruptions and Ocean Heat Content - de Ex- IPCC-Leit-Autor Trenberth räumt jetzt ein: Pazifischer PDO-Ozeanzyklus hat zur Erwärmungsphase 1976-1998 beigetragen
- 2013
- de
Falls anthropogene Treibhausgase für die Erwärmung der globalen
Ozeane verantwortlich sind...
en If Manmade Greenhouse Gases Are Responsible for the Warming of the Global Oceans... - de
Das Ozean-Thermometer enthüllt die Lüge um die globale Erwärmung
en The Ocean Thermometer reveals Global Warming Lies - 2012
- de
Erwärmung der Ozeane: nicht sehr stark und zur falschen Zeit
en The Ocean Warms: Not Very Much And At The Wrong Time - de Solare Zyklen beeinflussen die Wassermassen der Tiefsee
- de
Meerestemperatur auf tausendstel Grad bestimmt?
Ein Ozean übermäßigen Vertrauens!
en An Ocean of Overconfidence - 2011
- de Messungen der Ozeantemperatur seit 2003 mit dem ARGO-System
- de
Wärmegehalt der Ozeane ist geringer als bisher gedacht
en Ocean Heat Content Adjustments: Follow-up and More Missing Heat - de
Wärmegehalt der Ozeane bleibt gleich - Klimamodelle hatten Zunahme
vorhergesagt
en October to December 2011 NODC Ocean Heat Content Anomalies (0-700Meters) - de
Meeresoberflächen kühlen sich weiter ab
en Global Sea Surface Temperature continues to drop - 2010
- de
GISS streicht Temperaturdaten aus der Arktis und Daten der
Wassertemperatur in den südlichen Ozeanen um die Antarktis
en GISS Deletes Arctic And Southern Ocean Sea Surface Temperature Data - de Rätsel gelöst - Globale Erwärmung versteckt sich in den Ozeanen!
- de Über sich abkühlende Ozeane und abflachende Meeresspiegel
- 2009
- en Global Oceanic Climate Updates
- en Ocean Temperatures: The New Bluff in Climate Alarmism
- de
Wärmehaushalt der Ozeane ist mit Klimaänderungen verbunden - keine
Korrelation mit CO2
en Changes in Net Flow of Ocean Heat Correlate with Past Climate Anomalies - fr Le contenu thermique des océans
- fr Les relevés de température des océans (Notamment PDO, ENSO)
- 2008
- de
In der Vergangenheit: Wie zuverlässig sind die Temperaturdaten von den
Ozeanen?
en From the past: Reliability of ocean temperature measurements
fr Le passé: Fiabilité de la mesure des températures des océans
Text
⇧ 2017
↑
Überraschung: Oberfläche des Schwarzen Meeres hat sich in den
vergangenen 50 Jahren nicht erwärmt
en
Black Sea water temperatures may buck global trend
-
Die kalte Sonne (Fritz Vahrenholt, Sebastian Lüning)
2017-11-09 de Überraschung: Oberfläche des Schwarzen Meeres hat sich in den vergangenen 50 Jahren nicht erwärmtAm 15. September 2017 überraschte die Europäische Kommission mit einer erfreulichen Nachricht zum Schwarzen Meer:
Sein Oberflächenwasser hat sich in den letzten 50 Jahren nicht erwärmt.
Eine Studie konnte jetzt keinen Trend in der Temperaturentwicklung feststellen:
Quelle / Source:
-
Europäische Kommission
2017-09-15 en Black Sea water temperatures may buck global trendAverage surface temperatures of the Black Sea may not have risen, according to the surprising results of a new study from the JRC.
↑
Wie unbequem: Ozeane kühlen sich weiter ab
en
Inconvenient: oceans continue to cool
-
EIKE Europäisches Institut für Klima und Energie
Antony Watts / Chris Frey
2017-11-02 de Wie unbequem: Ozeane kühlen sich weiter ab
-
Watts UP With That? (Antony Watts)
2017-10-28 en Inconvenient: oceans continue to cool
↑
Tropen führend bei Abkühlung der Ozeane
en
Inconvenient: oceans continue to cool
-
EIKE Europäisches Institut für Klima und Energie
Ron Clutz / Chris Frey
2017-08-30 de Tropen führend bei Abkühlung der Ozeane
-
Science Matters / Ron Clutz
2017-08-10 en Tropics Lead Ocean Cooling
↑ Obere Atlantikschichten widersetzen sich hartnäckig dem Aufwärmbefehl
-
Die kalte Sonne (Fritz Vahrenholt, Sebastian Lüning)
2017-04-27 de Obere Atlantikschichten widersetzen sich hartnäckig dem AufwärmbefehlWir wollen uns heute die ozeanische Wärme im Atlantik vornehmen.
Aus dem neuesten Climate4You Newsletter
besorgen wir uns die Wärmeinhalts-Kurve für die letzten 60 Jahre, die für die obersten 100 m der atlantischen Wassermassen gilt:

 Atlantische Wärmeinhalts-Kurve für die letzten 60 Jahre
(oberste 100 m der atlantischen Wassermassen).

Schön zu sehen: In den letzten 13 Jahren hat sich der Atlantik nicht weiter aufgeheizt.
Die Graphik zeigt eine große Treppenstufe:
Plateau 1955-1985, dann Anstieg, dann ab 2004 wieder ein Plateau.Die aktuell fehlende Erwärmung der atlantischen Oberflächenwässer war auch Thema einer Arbeit von Somavilla und Kollegen, die im März 2016 in den Geophysical Research Letters erschien.
Sie erklären, die Hitze hätte sich einfach von den oberen Stockwerken des Atlantiks in die Tiefenschichten verlagert:
Wenn man sich dann aber die Temperaturanomaliekarten im Supplement der Arbeit (Fig. S1) anschaut, erkennt man, wie heterogen diese Trends eigentlich wirklich sind.
Müssen wir also weiter im Auge behalten.
Die Wärmeumverteilung war bereits Thema eines Papers von Desbruyères und Kollegen 2014 in den Geophysical Research Letters.
Die erwähnte Abkühlung im Nordatlantik wollen wir uns wieder in einer aktuellen Graphik von Climate4You anschauen:

 Nordatlantische Wärmeinhalts-Kurve für die letzten 60 Jahre
(oberste 700 m der nordatlantischen Wassermassen).
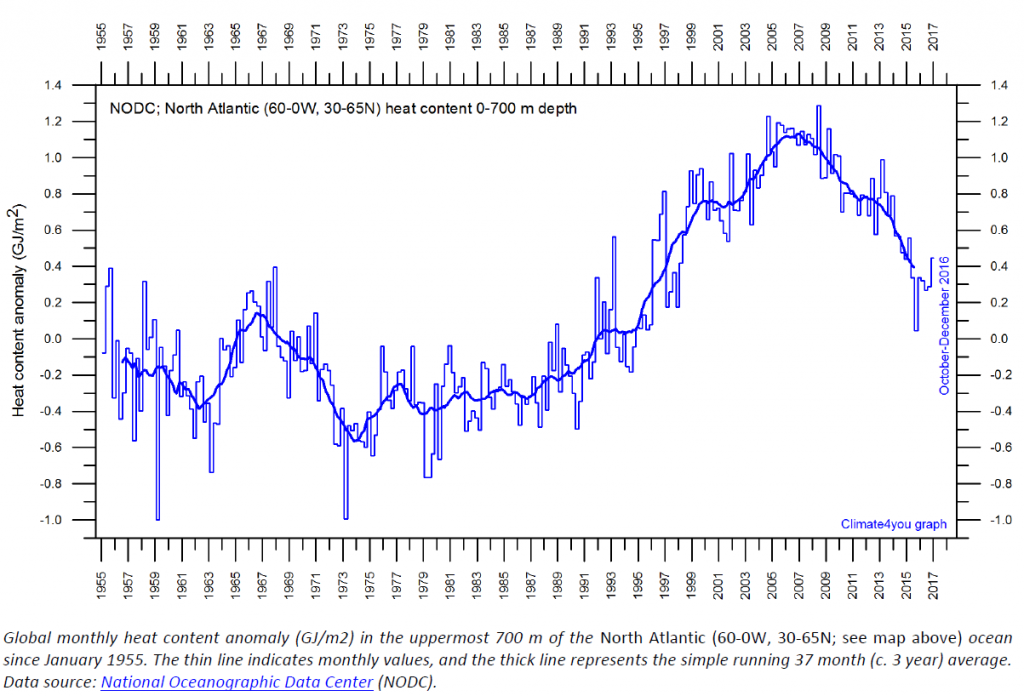
↑
Ozeanischer Wärmeinhalt im letzten Jahr stark zurückgegangen:
Kurzfristeffekt oder Trendwende?
en
New estimate of ocean heat finds more warming
-
Die kalte Sonne (Fritz Vahrenholt, Sebastian Lüning)
2017-04-08 de Ozeanischer Wärmeinhalt im letzten Jahr stark zurückgegangen: Kurzfristeffekt oder Trendwende?
-
NCAR National Center for Atmospheric Research/|UCAR
2017-03-17 de New estimate of ocean heat finds more warming
⇧ 2016
↑ NASA: Tiefe Ozeanschichten haben sich in den vergangenen 10 Jahren nicht erwärmt. Ursache der globalen atmosphärischen Erwärmungspause bleibt weiter offen
-
Die kalte Sonne (Fritz Vahrenholt, Sebastian Lüning)
2016-05-15 de NASA: Tiefe Ozeanschichten haben sich in den vergangenen 10 Jahren nicht erwärmt. Ursache der globalen atmosphärischen Erwärmungspause bleibt weiter offen
↑
Sind Festlands- und Ozean-Temperaturmittel von Bedeutung?
en
Are land + sea averages meaningful ?
-
EIKE Europäisches Institut für Klima und Energie
Climategrog / Chris Frey
2016-02-13 de Sind Festlands- und Ozean-Temperaturmittel von Bedeutung?
-
climategrog
2016-02-09 en Are land + sea averages meaningful ?
↑ en On the Monumental Differences in Warming Rates between Global Sea Surface Temperature Datasets during the NOAA-Picked Global-Warming Hiatus Period of 2000 to 2014
-
Watts Up With That? (Antony Watts)
2016-01-27 en On the Monumental Differences in Warming Rates between Global Sea Surface Temperature Datasets during the NOAA-Picked Global-Warming Hiatus Period of 2000 to 2014
⇧ 2015
↑
Können wir eine Aussage darüber machen, ob sich die Ozeane
erwärmen?
en
Can We Tell If The Oceans Are Warming?
-
EIKE Europäisches Institut für Klima und Energie
Willis Eschenbach / Chris Frey
2015-06-15 de Können wir eine Aussage darüber machen, ob sich die Ozeane erwärmen?
-
Watts UP With That? (Antony Watts)
Willis Eschenbach
2015-06-15 en Can We Tell If The Oceans Are Warming?
⇧ 2014
↑
ARGO und der ozeanische Wärmegehalt
en
Argo And Ocean Heat Content
-
EIKE Europäisches Institut für Klima und Energie
Willis Eschenbach / Chris Frey
2014-12-07 de ARGO und der ozeanische Wärmegehalt
-
Watts UP With That? (Antony Watts)
Willis Eschenbach
2014-12-04 en Argo And Ocean Heat Content
↑
ARGO: Große Bandbreite von Erwärmungs- (und Abkühlungs-)Raten
der Ozeane bis zu einer Tiefe von 2000 Metern
en
With ARGO, There is a Wide Range Warming (and Cooling) Rates of
the Oceans to Depths of 2000 Meters
-
EIKE Europäisches Institut für Klima und Energie
Bob Tisdale / Chris Frey
2014-10-27 de ARGO: Große Bandbreite von Erwärmungs- (und Abkühlungs-)Raten der Ozeane bis zu einer Tiefe von 2000 Metern
-
Watts UP With That? (Antony Watts)
Bob Tisdale
2014-10-17 en With ARGO, There is a Wide Range Warming (and Cooling) Rates of the Oceans to Depths of 2000 Meters
↑
Suche nach der angeblich im Ozean versunkenen Wärme endet mit Fehlschlag:
Tiefe Meeresschichten kühlten sich in den letzten 20 Jahren ab
en
The "heat went to the oceans" excuse and Trenberth's missing heat
is AWOL -
deep ocean has not warmed since 2005
-
Die kalte Sonne (Fritz Vahrenholt & Sebastian Lüning)
2014-08-05 de Suche nach der angeblich im Ozean versunkenen Wärme endet mit Fehlschlag: Tiefe Meeresschichten kühlten sich in den letzten 20 Jahren abEs hat sich mittlerweile herumgesprochen, dass die Erderwärmung seit 16 Jahren pausiert.
Entgegen den IPCC-Prognosen stagnieren die Temperaturen, es wird einfach nicht mehr wärmer.
Händeringend wird jetzt im Lager des Weltklimarats nach Ursachen gesucht.
Wie konnte dies passieren?
Die Forscher ersannen eine Vielzahl von Hypothesen.
Das am weitesten verbreitete Modell besagt dabei, dass die Oberflächentemperaturen der Erde zwar stagnieren, sich aber in aller Stille die Wassermassen der Tiefsee kräftig aufheizen würden.
Und falls sich diese angestaute Wärme irgendwann an die Erdoberfläche vorkämpfen könnte, dann droht uns die Hitzekatastrophe!
Die Behauptung "Die mittleren Tiefenschichten der Meere haben sich in den vergangenen 60 Jahren 15-mal schneller erwärmt als bei jeder natürlichen Schwankung der vergangenen 10.000 Jahre" ist schlichtweg falsch.
Eigentlich müsste Spiegel Online schnellstmöglch eine Korrekturmeldung nachschieben.
Man hat den Lesern einen Bären aufgebunden, vermutlich um die klimaalarmistische Bewegung zu befördern.
-
Watts Up With That? (Antony Watts)
2014-10-06 en The "heat went to the oceans" excuse and Trenberth's missing heat is AWOL - deep ocean has not warmed since 2005
Meeres-Temperaturen: kein Erwärmungstrend
|
|
![]() Argo Floats : How do we measure the ocean?
Argo Floats : How do we measure the ocean?
↑ en Cooling of North Atlantic Sea Surface Temperatures
|
↑ Meeres-Temperaturen: kein Erwärmungstrend
Meeres-Temperaturen: kein Erwärmungstrend
|
↑
Die Tiefsee kühlt sich ab inmitten eines Meeres von Modell-Unsicherheit:
Neue Forschungen zum ozeanischen Wärmegehalt
en
Deep Oceans Are Cooling Amidst A Sea of Modeling Uncertainty:
New Research on Ocean Heat Content
-
EIKE Europäisches Institut für Klima und Energie
Jim Steele / Chris Frey
2014-07-25 de Die Tiefsee kühlt sich ab inmitten eines Meeres von Modell-Unsicherheit: Neue Forschungen zum ozeanischen Wärmegehalt
-
Watts UP With That? (Antony Watts)
Christopher Monckton of Brenchley
2014-07-21 en Deep Oceans Are Cooling Amidst A Sea of Modeling Uncertainty: New Research on Ocean Heat Content
↑
Der Ozean hat meine globale Erwärmung gefressen
en
The ocean ate my global warming
-
EIKE Europäisches Institut für Klima und Energie
Christopher Monckton of Brenchley / Chris Frey
2014-05-11 de Der Ozean hat meine globale Erwärmung gefressen
-
Watts UP With That? (Antony Watts)
Christopher Monckton of Brenchley
2014-05-03 en The ocean ate my global warming
↑
Vulkanische Eruptionen und ozeanischer Wärmegehalt
en
Eruptions and Ocean Heat Content
-
EIKE Europäisches Institut für Klima und Energie
Willis Eschenbach / Chris Frey
2014-04-15 de Vulkanische Eruptionen und ozeanischer Wärmegehalt
-
Watts UP With That? (Antony Watts)
Willis Eschenbach
2014-04-06 en Eruptions and Ocean Heat Content
↑ Ex- IPCC-Leit-Autor Trenberth räumt jetzt ein: Pazifischer PDO-Ozeanzyklus hat zur Erwärmungsphase 1976-1998 beigetragen
-
EIKE Europäisches Institut für Klima und Energie
Sebastian Lüning
2014-01-22 de Ex- IPCC-Leit-Autor Trenberth räumt jetzt ein: Pazifischer PDO-Ozeanzyklus hat zur Erwärmungsphase 1976-1998 beigetragenEs hat ein bisschen gedauert, aber die Ozeanzyklen als wichtige Klimafaktoren sind nun endlich auch auf der IPCC-Seite angekommen.
Kevin Trenberth schreibt jetzt zusammen mit John Fasullo in einem neuen Paper im Fachmagazin Earth's Future, dass die Erwärmungspause seit 1998 wohl mit der Pazifisch Dekadischen Oszillation (PDO) zu tun haben könnte.
⇧ 2013
↑
Falls anthropogene Treibhausgase für die Erwärmung der globalen
Ozeane verantwortlich sind...
en
If Manmade Greenhouse Gases Are Responsible for the Warming
of the Global Oceans...
-
EIKE Europäisches Institut für Klima und Energie
Bob Tisdale / Chris Frey
2013-12-28 de Falls anthropogene Treibhausgase für die Erwärmung der globalen Ozeane verantwortlich sind...
-
Watts UP With That? (Antony Watts)
Bob Tisdale
2013-12-19 en If Manmade Greenhouse Gases Are Responsible for the Warming of the Global Oceans...
↑
Das Ozean-Thermometer enthüllt die Lüge um die globale Erwärmung
en
The Ocean Thermometer reveals Global Warming Lies
-
EIKE Europäisches Institut für Klima und Energie
Iv Forbes & Helpers / Chris Frey
2013-12-10 de Das Ozean-Thermometer enthüllt die Lüge um die globale Erwärmung
-
carbon-sense.com / Iv Forbes & Helpers
2013-12-19 en The Ocean Thermometer reveals Global Warming Lies
⇧ 2012
↑
Erwärmung der Ozeane: nicht sehr stark und zur falschen Zeit
en
The Ocean Warms: Not Very Much And At The Wrong Time
|
|
-
EIKE Europäisches Institut für Klima und Energie
2012-11-21 de Erwärmung der Ozeane: nicht sehr stark und zur falschen ZeitEine der wichtigsten Fragen der Klimawissenschaft ist die nach der Erwärmung der Ozeane, und zwar sowohl an der Oberfläche als auch in tieferen Schichten.
Wann haben sie sich erwärmt?
Wie verhält sich deren Erwärmung zum Antrieb des Klimas durch Treibhausgase?
Sind die Schichten unter der Wasseroberfläche diejenigen, in die die größte Menge der Energie der globalen Erwärmung geht?
Kommentar von U. Langer
Bestätigen sich die Ergebnisse dieser Studie, ist sie ein weiterer Genickschlag für die AGW-These (und dann ist zu erwarten, dass sie von der AGW-Gemeinde (PIK bis IPCC) komplett ignoriert wird).
Es ergeben sich nämlich aus dieser Studie einige Problemchen für AGW:
- Der Großteil der Erwärmung der Ozeane der letzten 100 Jahre fand vor 1950 statt und ist somit natürlichen Ursprungs!
- Der Großteil des Meeresspiegelanstiegs im 20. Jahrhunderts ist natürlichen Ursprungs!
- Selbst wenn die Erwärmung der Atmosphäre seit 1950 zum Großteil vom Menschen verursacht sein sollte (AGW-These), hat sie im Vergleich zu den natürlichen Klimaschwankungen im 20. ahrhundert nur eine geringe Bedeutung für den Wärmehaushalt der Erde!
-
GWPF The Global Warming Policy Forum
2012-11-09 en The Ocean Warms: Not Very Much And At The Wrong TimeSome of the most important questions in climatic science concern the warming of the oceans, both the surface and the sub-surface.
When did it warm?
How does its warming relate to greenhouse gas forcing of the climate?
Is the sub-surface of the oceans the place where most of the energy of global warming is going?
↑ Solare Zyklen beeinflussen die Wassermassen der Tiefsee
-
Die kalte Sonne (Fritz Vahrenholt, Sebastian Lüning)
2012-11-21 de Neue marum-Studie: Solare Zyklen beeinflussen die Wassermassen der Tiefsee
↑
Meerestemperatur auf tausendstel Grad bestimmt?
Ein Ozean übermäßigen Vertrauens!
en
An Ocean of Overconfidence
-
EIKE Europäisches Institut für Klima und Energie
Willis Eschenbach / Chris Frey
2012-05-02 de Meerestemperatur auf tausendstel Grad bestimmt? Ein Ozean übermäßigen Vertrauens!
-
Watts UP With That? (Antony Watts)
Willis Eschenbach
2012-04-23 en An Ocean of Overconfidence
⇧ 2011
↑ Messungen der Ozeantemperatur seit 2003 mit dem ARGO-System
|
|
Die Klimamodelle sage vorher, dass sich die Ozeane erwärmen. Saubere Messungen der Ozeantemperatur gibt es aber erst seit 2003 mit dem ARGO-System. Sie sagen, dass sich die Temperatur der Ozeane seit 2003 praktisch nicht verändert hat. Und wieder sieht die Realität ganz anders aus, als die Klimamodelle vorgeben. |
-
EIKE Europäisches Institut für Klima und Energie
2011-10-21 de Untersuchung der Mechanismen zur Festsetzung der KohlenstoffsteuerSaubere Messungen der Ozeantemperatur gibt es aber erst seit 2003 mit dem ARGO-System.
In diesem System taucht eine Boje rasch bis 2000 m ab, um dann langsam wieder nach oben zu steigen.
Während dieses Aufstiegs misst sie die Temperatur und übermittelt die Daten via Satellit an die Zentrale.
Dreitausend ARGO-Bojen führen diese Messungen weltweit konstant durch.
Sie sagen, dass sich die Temperatur der Ozeane seit 2003 praktisch nicht verändert hat.
Und wieder sieht die Realität ganz anders aus, als die Klimamodelle vorgeben.
↑
Wärmegehalt der Ozeane ist geringer als bisher gedacht
en
Ocean Heat Content Adjustments: Follow-up and More Missing Heat
-
Klimaskeptiker Info
2011-03-20 de Wärmegehalt der Ozeane ist geringer als bisher gedacht
-
Watts Up With That? (Antony Watts)
2011-03-20 en Ocean Heat Content Adjustments: Follow-up and More Missing Heat
Update
-
Watts Up With That? (Antony Watts)
2011-09-18 en Trenberth's missing heat? Look to the deep
↑
Wärmegehalt der Ozeane bleibt gleich - Klimamodelle hatten Zunahme
vorhergesagt
en
October to December 2011 NODC Ocean Heat
Content Anomalies (0-700Meters)
|
de Noch im Jahr 2005 hat der weltbekannte Alarmist James Hansen ein Papier veröffentlicht, in dem er auf die gute Übereinstimmung der gemessenen Werte für den Wärmegehalt der Ozeane mit den Modellvorhersagen hinwies. Seit 2003 aber ist der globale Wärmegehalt der Ozeane im wesentlichen konstant - ganz im Gegensatz zu dem, was Hansens Modelle vorhergesagt haben. en If the observations continue to diverge from the model projection, how many years are required until the model can said to have failed? |
-
Klimaskeptiker Info
2011-06-19 de Wärmegehalt der Ozeane bleibt gleich - Klimamodelle hatten Zunahme
Noch im Jahr 2005 hat der weltbekannte Alarmist James Hansen ein Papier veröffentlicht, in dem er auf die gute Übereinstimmung der gemessenen Werte für den Wärmegehalt der Ozeane mit den Modellvorhersagen hinwies.
Seit 2003 aber ist der globale Wärmegehalt der Ozeane im wesentlichen konstant - ganz im Gegensatz zu dem, was Hansens Modelle vorhergesagt haben.
Bob Tisdale hat sich die verfügbaren Daten vorgenommen und mit den Behauptungen der Alarmisten verglichen.
-
Watts Up With That? (Antony Watts)
2011-06-19 en Tisdale on 2011 ocean heat content and the GISS-Miss
Update and Comments
2012-01-26 en October to December 2011 NODC Ocean Heat Content Anomalies (0-700Meters)
If the observations continue to diverge from the model projection, how many years are required until the model can said to have failed?
↑
Meeresoberflächen kühlen sich weiter ab
en
Global Sea Surface Temperature continues to drop
-
Klimaskeptiker Info
2011-01-04 de Meeresoberflächen kühlen sich weiter ab
-
Watts Up With That? (Antony Watts)
2011-01-03 de Global Sea Surface Temperature continues to drop
⇧ 2010
↑
GISS streicht Temperaturdaten aus der Arktis und Daten der
Wassertemperatur in den südlichen Ozeanen um die Antarktis
en
GISS Deletes Arctic And Southern Ocean Sea Surface Temperature Data
-
EIKE Europäisches Institut für Klima und Energie
Bob Tisdale / Chris Frey
2010-06-22 de GISS streicht Temperaturdaten aus der Arktis und Daten der Wassertemperatur in den südlichen Ozeanen um die Antarktis
-
Watts UP With That? (Antony Watts)
Bob Tisdale
2010-05-313 en GISS Deletes Arctic And Southern Ocean Sea Surface Temperature Data
↑ Rätsel gelöst - Globale Erwärmung versteckt sich in den Ozeanen!
-
Science Skeptical Blog / Rudolf Kipp
2010-04-17 de Über sich abkühlende Ozeane und abflachende Meeresspiegel
Kevin Trenberth zählt zu den weltweit angesehensten Klimaforschern.
Seine Stimme hat also einiges Gewicht in der Diskussion um den Klimawandel, der ja vor allem durch menschlichen Frevel die Erde schon bald in eine unbewohnbare Hölle verwandeln soll.
Sehr zur Unfreude seiner Zunft hat Trenberth mit einer Äußerung in einer durch Climategate öffentlich gewordenen E-Mail das aktuelle Dilemma der Klimaforschung auf den Punkt gebracht.
Es wird in den letzten Jahren einfach nicht wärmer
"Fakt ist, wir können im Moment das Fehlen der Erwärmung nicht erklären, und es ist ein Hohn dass wir es nicht können."
"The fact is that we can't account for the lack of warming at the moment and it is a travesty that we can't."
Und seit 2005 nimmt auch der Wärmeinhalt der Ozeane deutlich weniger zu, als es die Modelle der Forscher und die Satellitenmessungen für diesen Zeitraum eigentlich erwarten lassen.
Aber Trenberth wäre kein Klimaforscher von Weltruf, wenn er nicht auch eine Auflösung für dieses Rätsel parat hätte.
Die Wärme ist da.
Sie muss da sein, schließlich zeigen es die Modelle.
Sie versteckt sich nur geschickt irgendwo in den Ozeanen.
Und zwar offensichtlich an Stellen, wo unsere Messmethoden sie nicht finden können.
Und diese "versteckte Wärme" wird, wenn Sie denn wieder auftaucht, mit voller Wucht zurückschlagen:
"Die Wärme wird wiederkommen und uns heimsuchen, früher oder später."
"The heat will come back to haunt us sooner or later,"
Mit dieser Publikation ist Trenberth nicht der erste Klimawissenschaftler von Weltrang, der sich in einer Erklärung versucht, warum es in den letzten Jahren nicht wärmer wird.
Es sind nicht fehlerhafte Modelle der Klimaforscher, sondern natürliche Phänomene, welche die Stagnation erklären.
Man beachte dabei, dass eine Abkühlung, die wir uns nicht richtig erklären können, fast immer natürliche Ursachen hat.
Eine Erwärmung, für die wir keine andere Erklärung haben, ist in unseren Zeiten hingegen absolut immer ein untrüglicher Hinweis für einen menschlichen Einfluss.
↑ Über sich abkühlende Ozeane und abflachende Meeresspiegel
-
EIKE Europäisches Institut für Klima und Energie
Michael Limburg
2010-04-13 de Über sich abkühlende Ozeane und abflachende Meeresspiegel
Die neuste Studie von Craig Loehle (2009) besagt, dass die Ozeane sich seit 2003 weltweit abkühlen.
⇧ 2009
↑ en Global Oceanic Climate Updates
| AMSR-E | = |
Advamced Microwave Scanning Radiometer for EOS instrument on NASA's Aqua satellite (Aqua was launched in 2002) |
| SST | = | Sea Surface Temperature |
|
GLOBAL OCEANS In the figure below are plotted the 5 ocean products for the global ice free-oceans (56N to 56S) |
TROPICAL OCEANS The figure shows the ocean product anomalies for just the deep tropics (20N to 20S latitude) |
-
Roy W. Spencer, Ph. D.
2009-09-01 en Global Oceanic Climate Update for August 2009
This is the first of what might turn into a series of monthly updates of some maritime climate parameters monitored by the AMSR-E instrument on NASA's Aqua satellite.
-
Watts Up With That? (Antony Watts)
2009-09-08 en Global Oceanic Climate Update for August 2009
↑ en Ocean Temperatures: The New Bluff in Climate Alarmism
Our best data, from satellites and Argo, shows that the air and oceans have not warmed for at least five years.
The world is now cooling slightly, so there is no heat accumulating. Some natural cooling force is currently stronger than the warming due to human emissions.
-
ACSC Australian Climate Science Coalition
en We knew the ocean temperature bluff was coming
-
Dr. David Evans
2009-07-21 en Ocean Temperatures: The New Bluff in Climate Alarmism
• Air temperatures have been falling for years.
Satellites show that 1998 was the warmest recent year and that a cooling trend started in 2002.
Even the land-based thermometer data, which is corrupted by artificial heating sources close to 89% of its thermometers and which is heavily "corrected", now shows a cooling trend developing from 2006.
• The alarmists recently switched to ocean temperature to measure global warming.
• The alarmists claim the world is still warming, that heat is building up in the oceans, and that the ocean temperature is rising and rising fast.
These claims implicitly depend on a time period to say what a "trend" is, because temperatures fluctuate.
The alarmists provide the context by showing trends of 20 to 50 years.
This is a clever trick to reframe the debate, and essential to their case.
• Ocean temperatures have only been measured properly from mid 2003, when the Argo network became operational.
Over 3,000 Argo floats cover all the world's oceans.
They dive down to measure temperatures, then resurface to radio back the information. The previous XBT system did not monitor huge areas of ocean, did not go as deep, and was much less accurate.
• Ocean temperatures are dropping slightly.
The Argo data shows that the oceans have been cooling slightly since mid 2003.
| David Evans |
Dr., Klimawissenschaftler, war von 1999 bis 2005 verantwortlich
für die Erfassung der Australischen CO₂-Emissionen.
▶David Evans: Who is who (Skeptiker) ▶David Evans: Video (Präsentationen) |
↑
Wärmehaushalt der Ozeane ist mit Klimaänderungen verbunden - keine
Korrelation mit CO2
en
Changes in Net Flow of Ocean Heat Correlate with Past Climate
Anomalies
en PDO Pacific Decadal Oscillation
![]()
![]() PDO =
Pacific Decadal Oscillation
PDO =
Pacific Decadal Oscillation

Positive (red) index values indicate a warm phase PDO; negative
(blue) index values indicate a cool phase PDO.
While short-term flips in PDO phases do occur, evaluation of 20th century instrumental records has shown that PDO phases generally persist for 20-30 years, as indicated in this figure.
-
Klimaskeptiker Info
2009-08-17 de Wärmehaushalt der Ozeane ist mit Klimaänderungen verbunden - keine Korrelation mit CO2
Physiker der Universität Rochester, unter ihnen Prof. David Douglass, haben Satelliten- und Bojendaten untersucht und dabei herausgefunden, daß in den letzten 50 Jahren der Netto-Wärmefluß in und aus den Ozeanen drei Mal die Richtung geändert hat.
Alle drei Vorzeichenwechsel trafen mit abrupten Klimaveränderungen auf der Erde zusammen.
Es gebe auch keine verdeckte Erwärmung, deren Energie in Ozeanen während der gegenwärtigen Abkühlung auf der Oberfläche nur zwischengespeichert werde (wie dies die AGW-Anhänger gern behaupten, um die Abkühlung der letzten Jahre als irrelevant darzustellen).
Eine solche Korrelation der beobachteten Klimageschichte mit dem CO2-Niveau in der Atmosphäre besteht nicht.
-
University of Rochester (N.Y.)
2009-08-14 en Changes in Net Flow of Ocean Heat Correlate with Past Climate AnomaliesPhysicists at the University of Rochester have combed through data from satellites and ocean buoys and found evidence that in the last 50 years, the net flow of heat into and out of the oceans has changed direction three times.
These shifts in the balance of heat absorbed from the sun and radiated from the oceans correlate well with past anomalies that have been associated with abrupt shifts in the earth's climate, say the researchers.
These anomalies include changes in normal storm intensities, unusual land temperatures, and a large drop in salmon populations along the western United States.
The physicists also say these changes in ocean heat-flow direction should be taken into account when predicting global climate because the oceans represent 90 percent of the total heat in the earth's climate system.
Douglass says the last oceanic shift occurred about 10 years ago, and that the oceans are currently emitting slightly more radiation than they are receiving.
The team says their data shows the oceans are not continuously warming - a conclusion not consistent with the idea that the oceans may be harboring "warming in the pipeline."
Douglass further notes that the team found no correlation between the shifts and atmospheric carbon dioxide concentration.
"The heat content data we used, gathered by oceanographers, was gleaned from temperature measurements at various ocean depths up to 750 meters."
The team also found that the radiative imbalance was sufficiently small that it was necessary to consider the effect of geothermal heating.
The team notes that it's impossible to predict when another shift might occur, but they suspect future shifts might be similar to the three observed.
-
Watts Up With That? (Antony Watts)
2009-08-17 en Study: Ocean net heat flow is connected with climate shifts - CO2 not correlated - no "warming in the pipeline"
↑ Le contenu thermique des océans
-
Pensée unique
2009-02-12 fr Le contenu thermique des océansL'évolution du contenu thermique des océans contredit formellemlent les modèles du climat (notamment celui de James Hansen 2005)
De nombreux chercheurs comme Roger Pielke Sr (ou Josh Willis du JPL de la NASA) défendent l'idée que les mesures des températures de la couche superficielle des océans sont beaucoup plus révélatrices du refroidissement ou du réchauffement de la planète que les mesures de température terrestre ou atmosphérique le plus souvent évoquées dans les médias.
↑ Les relevés de température des océans (Notamment PDO, ENSO)
PDO =
Pacific Decadal Oscillation
ENSO :
El Niño - Southern Oscillation
El Niño : warm/warm/chaud
La Niña : kalt/cold/froid
WFT :
Wood For Trees Org
JISAO :
Joint Institute for the Study of the Atmosphere and Ocean
-
Pensée unique (Jean Martin)
fr Les relevés de température des océans (Notamment PDO, ENSO)
- woodfortrees.org en JISAO-PDO
⇧ 2008
↑
In der Vergangenheit: Wie zuverlässig sind die Temperaturdaten von den
Ozeanen?
en
From the past: Reliability of ocean temperature measurements
fr
Le passé: Fiabilité de la mesure des températures des océans
-
Globales Klima
2008-06-02 de Wie zuverlässig sind die Temperaturdaten von den Ozeanen?
-
The Independent
2008-05-29 en Case against climate change discredited by study
