3.2.21 Fehler
en Errors
fr Erreurs
Mit folgenden Links wird von anderen Webseiten auf diese Seite verwiesen:
| de | en | fr |
|---|---|---|
|
Klima: Fragen Fehler |
Climate: Questions Errors |
Climat: Questions Erreurs |
|
⇑
Inhalt |
|
Falsche Temperaturen von IPCC und
Das CO₂ steigt und die Temperaturen fallen |
de Allgemein en General fr Générale
| de | en | fr |
|---|---|---|
|
Klima: Probleme Fehler Teil I, Teil II Fehler und Falschaussagen der Panikmacher |
Climat: Problems Errors Part I, Part II Errors and wrong statements of the panic-makers |
Climate: Problèmes Erreurs partie I, partie II Erreurs et faux témoignages des faiseurs de la panique |
| de | en | fr |
|---|---|---|
|
Klima: Probleme Fehler Teil 1, Fehler Teil II Fehler und Falschaussagen der Panikmacher |
Climate: Problems Errors Part I, Errors Part II Errors and wrong statements of the panic-makers |
Climat: Problèmes Erreurs partie I, Erreurs partie II Erreurs et faux témoignages des faiseurs de la panique |
Fehler I
en Errors I
fr Erreurs I
| de | en | fr |
|---|---|---|
|
Klima: Probleme Fehler Teil I, Teil II Fehler und Falschaussagen der Panikmacher |
Climat: Problems Errors Part I, Part II Errors and wrong statements of the panic-makers |
Climate: Problèmes Erreurs partie I, partie II Erreurs et faux témoignages des faiseurs de la panique |
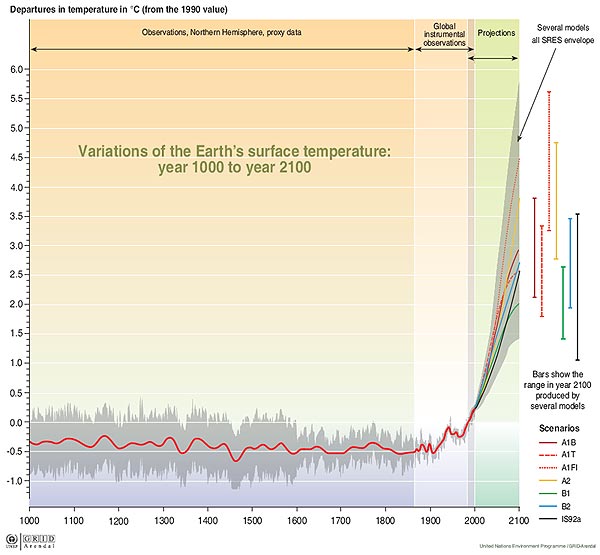
Falsche Temperaturen von IPCC und Kyoto
(Das Hockeyschläger Diagramm)
en Wrong temperatures of IPCC and Kyoto (The Hockey stick curve)
fr Fausses températures du GIEC et de Kyoto (La courbe en crosse de hockey)
-
de Diese Annahmen für das Kyoto-Protokoll sind falsch
-
en These data used as basis for the Kyoto-protocol are wrong
-
fr Ces valeurs pris comme base du protocole de Kyoto sont fausses
|
|
de Aus der Panik-Küche en From the panic laboratory fr De la marmite des alarmistes
|
![]()
![]()

de Das Holozän en The Holocene fr Le holocène
|
|
||||||
|

![]() Die unterschlagene historische COMNISPA-Temperaturkurve
Die unterschlagene historische COMNISPA-Temperaturkurve
![]()
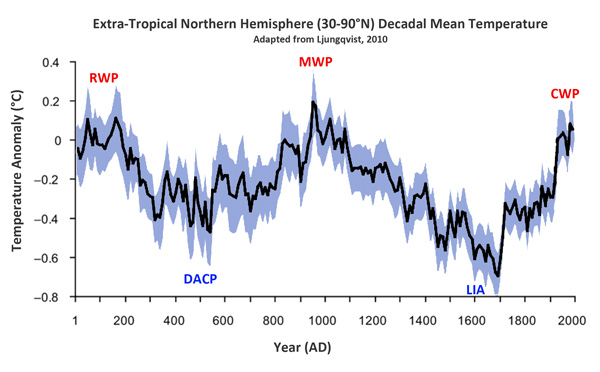
![]() Temperaturentwicklung der letzten 2000 Jahre auf der außertropischen
Nordhemisphäre
Temperaturentwicklung der letzten 2000 Jahre auf der außertropischen
Nordhemisphäre
RWP = Roman Warm Period
DACP = Dark Ages Cold Period
MWP = Medieval Warm Period
LIA = Little Ice Age
CWP = Modern Warm Period
![]()
![]() Wassertemperaturen der vergangenen 2000 Jahre
Wassertemperaturen der vergangenen 2000 Jahre

Fehler II
en Errors II
fr Erreurs II
| de | en | fr |
|---|---|---|
|
Klima: Probleme Fehler Teil 1, Fehler Teil II Fehler und Falschaussagen der Panikmacher |
Climate: Problems Errors Part I, Errors Part II Errors and wrong statements of the panic-makers |
Climat: Problèmes Erreurs partie I, Erreurs partie II Erreurs et faux témoignages des faiseurs de la panique |
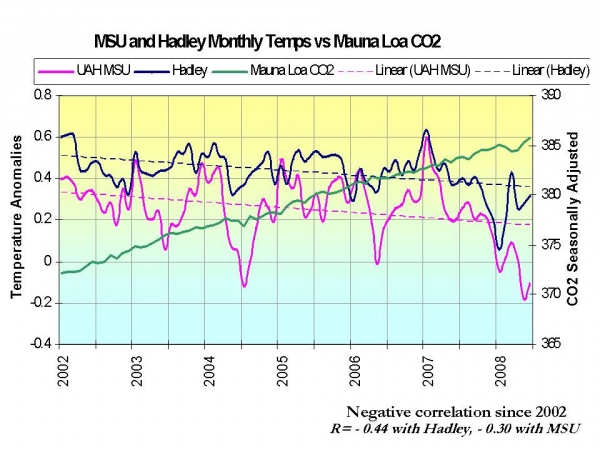
Das CO2 steigt und die Temperaturen fallen
IPCC zeigt die Abkühlung nicht und kann sie nicht erklären
en
CO2 is rising and the temperatures are falling
IPCC doesn't show the cooling and cannot explain it
fr
Le CO2 monte et les températures baissent
Le GIEC ne montre pas le refroidissement et ne peut pas l'expliquer
|
|
|
|
de Das CO₂ steigt und die Temperaturen fallen.
Wenn das CO₂ die Erwärmung erklärt,
muss es auch die Abkühlung erklären ...
oder es muss eine andere Erklärung
gefunden werden, en CO₂ is rising and the temperatures are falling.
If the CO₂ explains the warming,
it must also explain the cooling ...
or another explanation must be found fr Le CO₂ monte et les températures baissent.
Si le CO₂ explique le réchauffement,
il doit aussi expliquer le refroidissement ...
ou bien une autre explication doit être trouvée, |
|
7 years' global cooling at 2°C/century 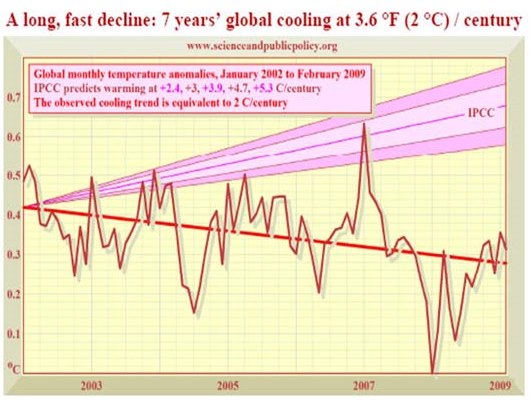
|
Who would like to bet the following outcomes on the models being correct.
|
|
de Zwei Fragen:
en Two questions:
fr Deux questions:
|
| de | en | fr |
|---|---|---|
| Das CO2 steigt und die Temperaturen fallen | CO2 is rising and the temperatures are falling | Le CO2 monte et les températures baissent |
| de | en | fr |
|---|---|---|
| Neuste Informationen über den Klimawandel | News on Climate Change | Nouvelles informations sur le changement climatique |
| Die Erwärmungspause | The Hiatus | La pause du réchauffement climatique |
↑