3.2.9 IPCC Intergovernmental Panel on Climate Change
en IPCC Intergovernmental Panel on Climate Change
fr GIEC Groupe d'experts intergouvernemental
sur l'évolution du climat
Mit folgenden Links wird von anderen Webseiten auf diese Seite verwiesen:
| de | en | fr |
|---|---|---|
|
Klima: Fragen Intergovernmental Panel on Climate Change |
Climate: Questions Intergovernmental Panel on Climate Change |
Climat: Questions Groupe d'experts intergouvernemental sur l'évolution du climat |
|
⇑
Inhalt |
|
de
IPCC-Probleme de Das passiert mit Kritikern des IPCC
de
Sind die IPCC Rapporte korrumpiert? |
de Allgemein en General fr Générale
IPCC-Probleme
en IPCC Problems
fr Problèmes du GIEC
- 1 Was stellen Sie fest?
- 2 Warum kommt das IPCC zu anderen Schlussfolgerungen?
- 3 Kritik am IPCC / Criticism of IPCC / Critiques du GIEC
- 4 IPCC: Falsche Temperaturkurven
- 5 Das Hockeyschläger Diagramm / The Hockey stick curve
- 6 Als das IPCC das Mittelalterliche Klimaoptimum verschwinden ließ
- 7 IPCC: Falsche CO2-Konzentrationen
- 8 IPCC: Falsche Methan-Konzentrationen
- 9 Temperatur kommt vor CO2
- 10 IPCC anerkennt keine Temperaturmessungen von Satelliten
- 11 Warum lehnt die NASA Satellitenmessungen ab?
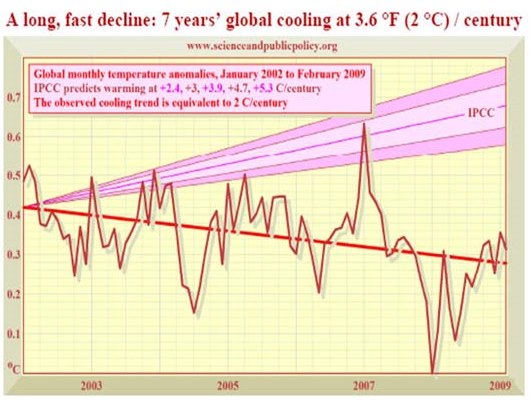
- 12 Die Abkühlung zeigt den IPCC-Irrtum: Es ist nicht das CO2!
- 13 IPCC-Report 2007: Zeigt keine Abkühlung
- 14 de
Vulkane und der Temperatur-Stillstand
en Volcanoes and the Temperature Pause
fr Volcans et la pause de la température - 15 de
Suche nach der angeblich im Ozean versunkenen Wärme endet mit Fehlschlag:
Tiefe Meeresschichten kühlten sich in den letzten 20 Jahren ab
en The "heat went to the oceans" excuse and Trenberth's missing heat is AWOL -
deep ocean has not warmed since 2005 - 16 de
IPCC Wissenschaftler passen ihren Bericht der "Summary for Policy
Makers" an!
en Tail wagging the dog - IPCC to rework AR5 to be 'consistent with the SPM' - 17 de
Je größer die Abweichungen desto sicherer die Hypothese
en IPCC's Confidence Grows as Models Get Worse - 18 Versuch den Temperatur-Stillstand zu vertuschen
- 19 Dreiste Erklärung: Römischen Warmzeit wegen Erdachsverschiebung
- 20 Vorschlag: Korrektur der Modelle und der gemessenen Temperaturen
- 21 de
Missbrauch von Klimamodellen
en Why Secretary of State John Kerry Is Flat Wrong on Climate Change - 22 de
Falsche Prognosen der Warmisten
en Wrong prognostics of the Warmist Gurus
fr Fausses prévisions des gurus réchauffistes - 23 de
Zum englischen Gerichtsentscheid betreffend dem Film
"Eine unbequeme Wahrheit"
en In the high court of justice: "An Inconvenient Truths"
fr Les erreurs du film de Al Gore - 24 de
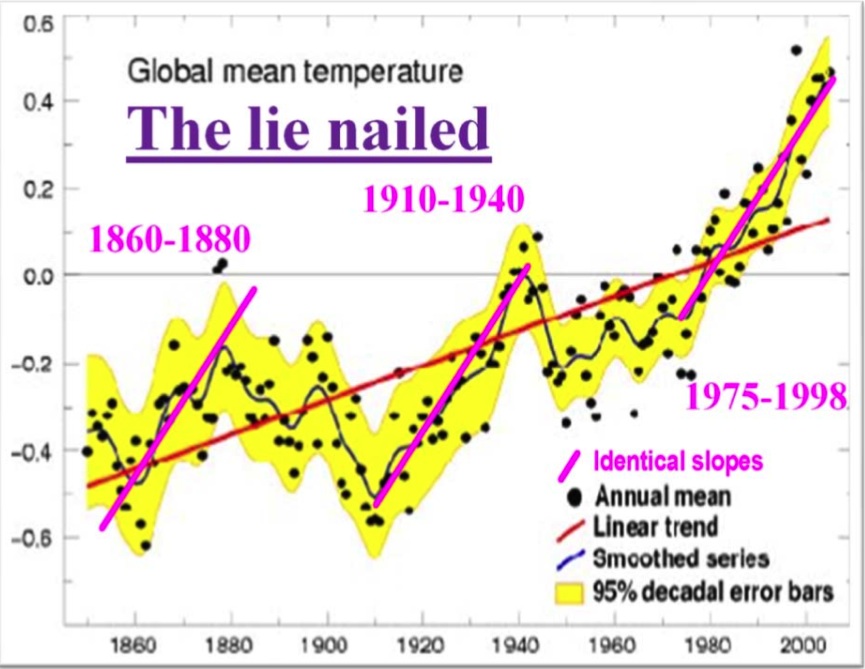
Die Lüge festgenagelt
en The Lie nailed
fr Le monsonge cloué - 25 Der fehlende Hotspot / The missing Hotspot / Le Point chaud manque
- 26 ERBE Earth Radiation Budget Experiment
- 27 Keine Klima-Kipp-Punkte / No Tipping Points / Pas de points d'inversion
- 28 Erfindung des 2-Grad-Zieles / 2 degree target / But de 2 degré
- 29 Alarmisten-Prognose: "Erderwärmung macht zehn Jahre Pause"
- 30 Klimaerwärmung auch wenn es kälter wird !
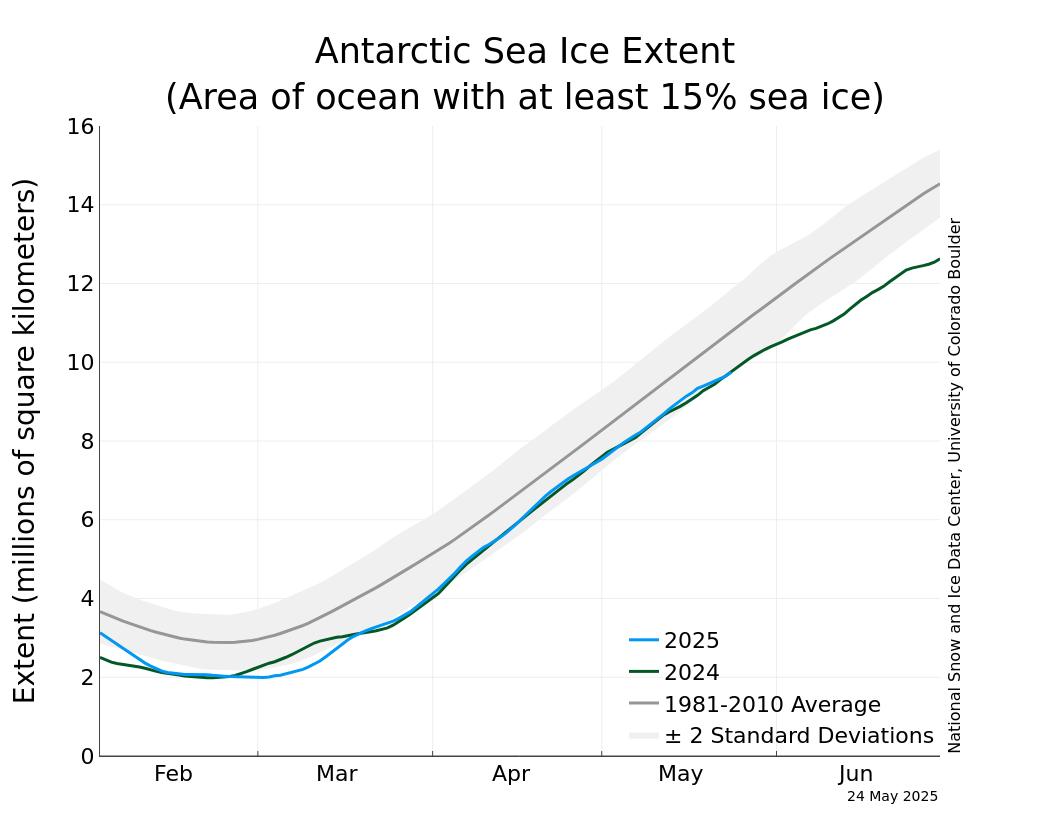
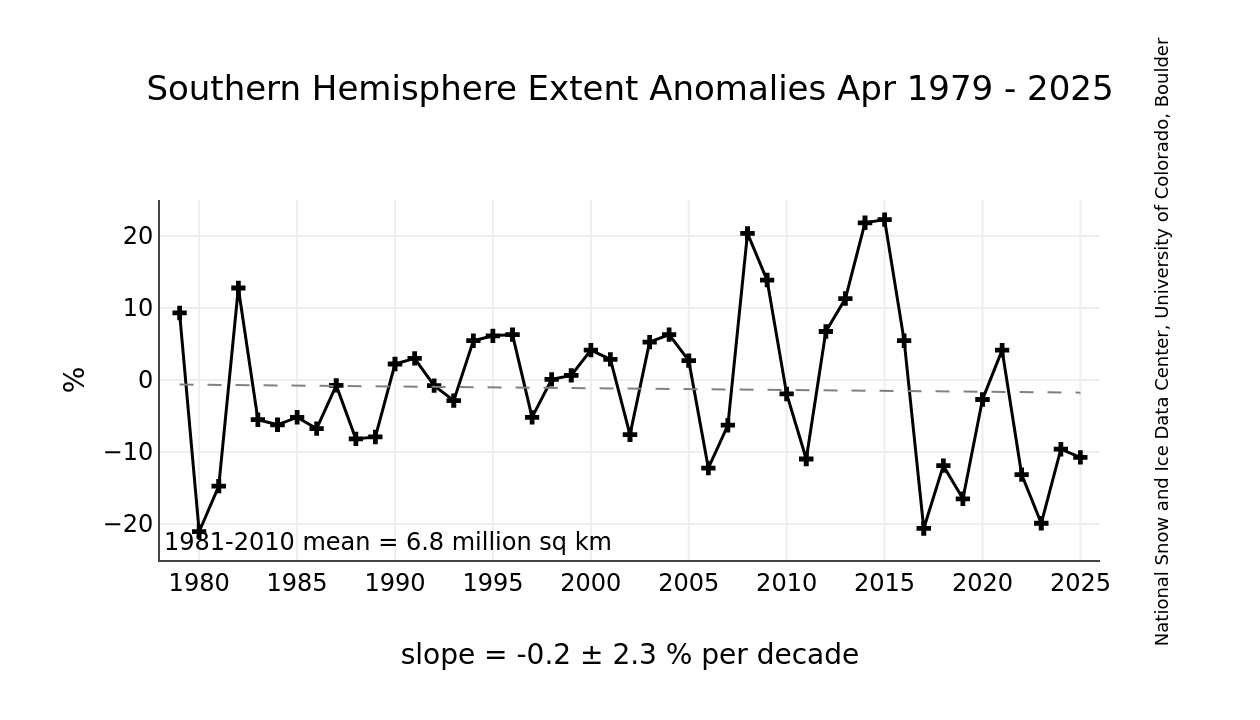
- 31 IPCC Modelle können die Zunahme des antarktischen Meereises nicht erklären
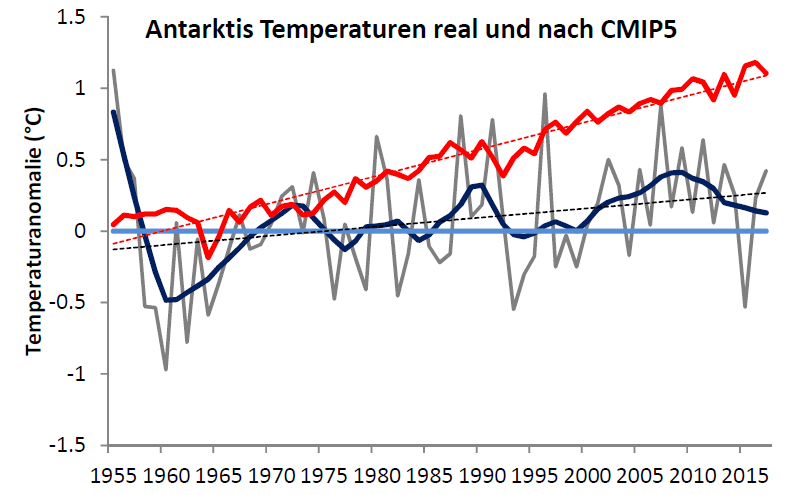
- 32 Polare Klimaschaukel: Panik-Modelle können dies nicht erklären
- 33 Tropen: Falsche Resultate der Panik-Modelle
- 34 Kritik am Treibhauseffekt und an der Gegenstrahlung
- 35 Wenn die CO2-Konzentration zunimmt, hat es einen kleineren Erwärmungseffekt
- 36 Falscher
CO2-Verstärkungseffekt des IPCC
Der Streit um die Rückkopplungen - 37 CO2 kann keinen Klimawandel verursachen
- 38 de
IPCC ignoriert den Einfluss der Sonne
en IPCC ignores the influence of the sun
fr Le GIEC ignores l'influence du soleil - 39 de
IPCC ignoriert die Sonnenzyklen
en IPCC ignores the Solar Cycles
fr Le GIEC ignores les cycles solaires - 40 Kritik am IPCC Strahlungsantrieb
- 41 IPCC ignoriert den Solar-Verstärker
- 42 de
IPCC ignoriert Ozeanzyklen - und irrt sich im Temperatur-Trend
en IPCC ignores Ocean Cycles - and is mistaken on Temperature Trend
fr Le GIEC ignores les cycles océaniques - et se trompe sur la température - 43 de
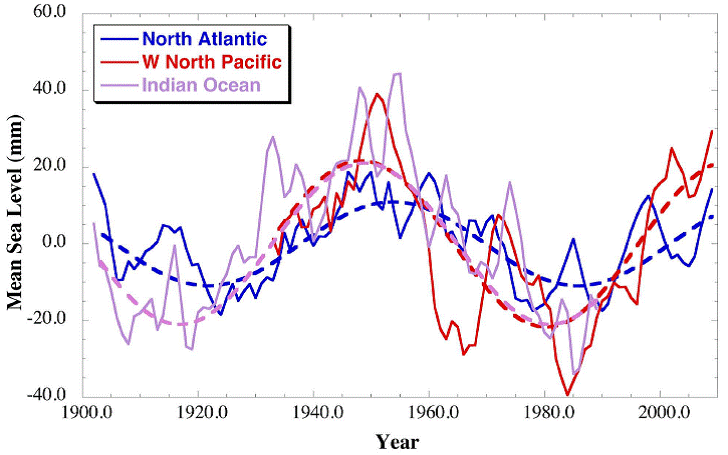
Die Meeresspiegel sind von den Ozeanzyklen
abhängig
en Sea Level and Ocean Cycle correlation
fr Corrélation entre niveau et cycles des océans - 44 de
Südpazifische Oszillation und Kosmische Strahlung
en South Pacific Oscillation and Cosmic Rays
fr Oscillation du Pacific Sud et rayonnement cosmique - 45 Geo-Engineering / Geoengineering / Géo-ingénierie
- 46 Falsche Klima-Modelle / Wrong Climate Models / Modèles du climat erronés
- 47 Falsche Prognosen / Wrong Prognostics / Fausses prévisions
- 48 de
Angstszenairen, Horrorvoraussagen und Schuldzuweisung (mit Videos)
en Fear Scenarious, Horror Previsions and accusations (with Videos)
fr Peur, prévisions de horrifiques et accusations (avec vidéos) - 49 Schwerwiegende Fehler in den IPCC-Rapporten
- 50 de
Zitate, Fehler und Falschaussagen der Panikmacher
en Citations, Errors and wrong statements of the panic-makers)
fr Citations, erreurs et faux témoignages des faiseurs de la panique - 51 Kritik an Kernaussagen des Global Warming
- 52 de
Manipulation von Wikipedia
en Wikipedia engineers the debate on global warming
fr Wikipedia dirige le débat sur le réchauffement climatique - 53 de
Kritik an der Klimapolitik, Kritik am IPCC
en Criticism on climate policy, Criticism of IPCC
fr Critique au débat sur le réchauffement climatique, Critiques du GIEC - 54 de
Neue Weltordnung
en New World Order
fr Nouvel ordre mondial - 55 Politische und wirtschaftliche Auswirkungen
- 56 Politischer und ökonomischer Unsinn der Treibhaus-Panik
↑
1 Was stellen Sie fest?
en What do you see?
fr Qu'est-ce que vous remarquez?
Situation bis zum Jahr 2000
en Situarion until 2000
fr Situation jusqu'à 2000
War der Temperaturanstieg bis zum Jahr 2000 so schlimm?
-
Wir leben am Ende von einer "Kaltzeit" im Temperaturanstieg zu einer "Warmphase".
→ Das heisst: Wir hoffen, dass es zu einer Warmphase kommen wird und das Klima nicht wieder zu einer Eiszeit zurückkehrt!
-
Unsere heutige Situation ist nicht aussergewöhnlich.
→ Das Klima zur Zeit der Römer war noch besser (d.h. noch wärmer) ! -
Wir müssen keine Angst haben.
→ Höchstens, dass es wieder kalt wird, aber nicht dass es noch wärmer werden könnte.
→ Auf jeden Fall sollten wir keine wirkungslosen Massnahmen treffen.
Das CO2 spielt keine Rolle:
-
In der Vergangenheit war nicht das CO2 an der Temperaturzunahme schuld.
→ Heute ist auch nicht das CO2 an der Temperaturzunahme schuld.
→ "Machen" können wir sowieso nichts. -
Während der kleinen Eiszeit im späten Mittelalter hat es nichts genutzt "Hexen" zu verbrennen. Später hat sich nämlich herausgestellt, dass diese am kalten Klima nicht schuld waren (!)
→ Wir hoffen, dass auch das IPCC, James Hansen, Al Gore und die Grünen etc. ihr Treiben einstellen und auch die Regierungen ihre Politik ändern.
→ Es ist beschämend, wie sich diese Menschen verhalten.
→ Man kann nicht immer mit der gleichen Ausrede wie im Mittelalter kommen: "Man habe daran geglaubt"
Situation ab 2000
en Situarion after 2000
fr Situation après 2000
![]()
![]()
de
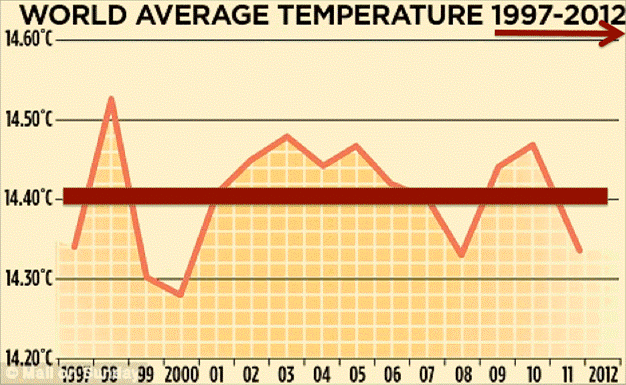
Wo bleibt die vorhergesagte Erderwärmung?
en Goodbye Warming - Hello Cooling

![]()
![]() Wo bleibt die vorhergesagte Erderwärmung?
Wo bleibt die vorhergesagte Erderwärmung?
-
EIKE Europäisches Institut für Klima und Energie
2012-02-25 de G l o b a l C o o l i n g : Wo bleibt die Erderwärmung ?
-
Die kalte Sonne (Fritz Vahrenholt & Sebastian Lüning)
2012-02-25 de Klaus-Eckart Puls: Wo bleibt die vorhergesagte Erderwärmung?
-
No Tricks Zone (P Gosselin)
2012-02-25 en Veteran Meteorologist Klaus Eckhart Puls: "Goodbye Warming - Hello Cooling". From Wrong Science To Fraud Science
| de | en | fr |
|---|---|---|
|
Neue Kälteperiode Forschungsergebnisse und Hypothesen |
New Cold Period Research and Hypotheses |
Nouvelle periode froide Recherches et hypothèses |
| de | en | fr |
|---|---|---|
|
Neue Kälteperiode Kaltzeit |
New Cold Period Cold Period |
Nouvelle periode froide Periode froide |
| Voraussagen | Predictions | Prédictions |
| Kälte: Warnungen | Cooling: Warnings | Refroidissement: Avertissements |
| Erwärmung: Entwarnung | Warming: All-Clear | Réchauffement: Fin de l'alerte |
| Eiszeiten | Ice Ages | Glaciations |
↑
2 Warum kommt das IPCC zu anderen Schlussfolgerungen ?
en Why does IPCC make other conclusions ?
fr Pourquoi les conclusions du GIEC sont différent ?
-
The Great Global Warming Swindle: Video UK-Channel 4, [74 Min.] 2007-03-08
de Der Klimaschwindel (Global Warming Swindle)
en The Great Global Warming Swindle
fr La grande escroquerie du réchauffement
climatique
-
2018-03-25 de
 Sonne, nicht CO2, ist Ursache für
Klimawandel [5:28 Min.]
Ausschnitt aus dem Dokumentarfilm "The Great Global Warming Swindle"
A documentary, by British television producer Martin Durkin, which argues against the virtually unchallenged consensus that global warming is man-made.
A statement from the makers of this film asserts that the scientific theory of anthropogenic global warming could very well be "the biggest scam of modern times."
-
NTV Dokumentation
2019-03-22 de Der Klimaschwindel - NTV Dokumentation
(Seite gelöscht, kein Wayback)
Ersatz:
2009-12-18 de Der Klimaschwindel - Teil 1
Der Klimawandel ist eine Lüge.
Es hat schon immer kältere und wärmere Phasen auf der Erde gegeben.
Nicht der Mensch ist für den derzeitigen Anstieg der Temperaturen
verantwortlich,
sondern dieser ist ein ganz natürliches Phänomen.
Kohlendioxid (CO2) ist ein lebenswichtiges Treibhausgas,
das keinen Einfluss auf die Erderwärmung hat
und zudem Pflanzen beim Wachstum hilft.
Wir steuern nicht auf eine Klimakatastrophe zu, sondern unterliegen einer regelrechten "Klimahysterie", die Skeptikern des Klimawandels den Mund verbietet und eine Kampagne politischer Wissenschaftler ist.
So lautet, vereinfacht zusammengefasst, die Kritik an der "Klimalüge" -
der von Menschen angeheizte Klimawandel wird in Frage gestellt oder
sogar ganz bestritten.
Die Überzeugung dieser "Klima-Leugner":
Wir sitzen einem riesigen Schwindel auf und verschwenden Zeit und Geld in die Bekämpfung von etwas, das es gar nicht gibt.
-
2013-11-21 de
 Der Klimaschwindel Wie die Oekomafia uns abzockt
CO2, Erderwärmung, abschmelzende Pole, dramatisch ansteigender Meeresspiegel, Treibhauseffekt, globaler Klimawandel - wir alle kennen diese Weltuntergangsszenarien.
Doch jetzt sorgen sensationelle Enthüllungen über Fälschungen, manipulierte Daten und systematischen Betrug in höchsten Kreisen der UN weltweit für Aufsehen.
Ist die These vom menschengemachten Klimawandel der Bluff des Jahrhunderts?
Sind wir alle Opfer einer Öko-Mafia, die uns Bürger und Steuerzahler ausnehmen will?
xxxxxxxxxxxxxxxxxxx
-
2011-10-27 de
 RTL Extra: Der Klimaschwindel (40 Min.)
-
2010-01-20 de
 Umweltschutz als neue Weltreligion
Biblische Plagen wie Hungersnöte und Sintfluten gelten nicht mehr als gottgewollt, sondern vom Menschen gemacht.
Ist der Umweltschutz die neue Weltreligion?
-
2014-05-15 de
 Rahmstorf, IPCC, Al Gore, Klimaschwindel
-
Global Warming - Doomsday Called Off (Video 44 Min):
(Tag des jüngsten Gerichtes abgesagt)
2015-03-08 en CBC - Doomsday Called Off (2004)
-
2011-11-24 en
 "The Greenhouse Conspiracy" UK TV 1990 (Apocalypse Cancelled)
Der Dokumentarfilm "The Green House Conspiracy" wurde im Jahre 1990 im australischen Fernsehen gezeigt und befasst sich mit der Mär der menschengemachten Erderwärmung.
Er ist ein guter Begleiter zum aktuellen Film "The Great Global Warming Swindle", der derzeit weltweit für Furore sorgt.
Die Argumente sind 17 Jahre älter, immer noch richtig und keines widerlegt. Dank Panik- und Angstmache sind inzwischen Milliarden und Abermilliarden von Steuergeldern bei den Angstmachern gelandet.
-
Church of Global Warming (Subtitled in German)
en Part 1
en Part 2
en Part 3
en Part 4
en Part 5
en Part 6
| de | en | fr |
|---|---|---|
|
Klimawandel: Probleme Der Klimaschwindel |
Climate change: Problems The Great Global Warming Swindle |
Changement climat.: Problèmes La grande escroquerie du réchauffement climatique |
| de | en | fr |
|---|---|---|
|
Klimawandel Videos |
Climat Change Videos |
Changement climatique Vidéos |
↑
3 Kritik am IPCC
en Criticism of IPCC
fr Critiques du GIEC
-
Die kalte Sonne (Fritz Vahrenholt & Sebastian Lüning)
2017-10-19 de Sorge um Ausgewogenheit: IPCC-Berichte werden von einer kleinen Clique Wissenschaftler und Institutionen dominiertEin beliebtes Argument in der Klimadebatte ist der Verweis auf die IPCC-Klimaberichte, die von hunderten von Autoren verantwortet werden und daher vermeintlich den "Gold-Standard" darstellen.
In der Tat gibt es keine anderen offiziellen Zusammenfassungen des Klimawissens, die eine ähnliche Detailfülle aufweisen.
Beim genauen Studium der IPCC-Berichte wird jedoch schnell klar, dass es viele wichtige Auslassungen und inhaltliche Schieflagen gibt.
Wie kann dies sein, wenn sich eine so große Anzahl von Fachleuten zusammenfindet, um die ganze Bandbreite der Klimawissenschaften abzudecken?
Hier lohnt ein Blick auf die Autorenlisten.
Wie wird man eigentlich in den illustren Kreis der IPCC-Autoren aufgenommen?
In der Planungphase der jeweiligen Berichte kann sich Jedermann über die nationalen IPCC-Verwaltungen bewerben.
In der Regel gehen sehr viel mehr Bewerbungen ein, als Autorenplätze zur Verfügung stehen.
Die letztendliche Nominierung geschieht dann durch den inneren Zirkel des nationalen IPCC, ein Prozess dem es entscheidend an Transparenz mangelt.
Während man offiziell vorgibt, an einer ausgewogenen Zusammensetzung der Autorenschaft interessiert zu sein, schafft es in der Regel kein IPCC-kritischer Wissenschaftler in die Erstellergruppe aufgenommen zu werden.
Ein gewichtiger Anteil der Autoren rekrutiert sich aus Klimahardlinern und Aktivisten.
Vor einigen Jahren analysierte Donna Laframboise die Autorenlisten und fand eine große Anzahl an Autoren mit WWF und Greenpeace Hintergund.
Greenpeace-Chefin Jennifer Morgan zieht bei IPCC und PIK unbehelligt die Strippen
Auch Institute wie das Potsdamer PIK sind eng mit den Aktivisten verflochten, mit fragwürdigen personellen Überschneidungen und Finanzierung.
| de | en | fr |
|---|---|---|
|
Klima: Probleme Fehler Teil I, Teil II Fehler und Falschaussagen der Panikmacher |
Climat: Problems Errors Part I, Part II Errors and wrong statements of the panic-makers |
Climate: Problèmes Erreurs partie I, partie II Erreurs et faux témoignages des faiseurs de la panique |
| de | en | fr |
|---|---|---|
|
IPCC Intergovernmental Panel on Climate Change Kritik am IPCC |
IPCC Intergovernmental Panel on Climate Change Criticism of IPCC |
GIEC Groupe d'experts intergouvernemental sur l'évolution du climat Critiques du GIEC |
| de | en | fr |
|---|---|---|
|
Klima-Diskurse: Diskussionen Ausschluss und Maulkorb für Kritiker |
Climate Discurses: Discussions Exclusion of critics |
Clima discurs: Discussions Exclusion des critiques |
↑
4 IPCC: Falsche Temperaturkurven
en IPCC: Wrong temperature curves
fr GIEC: Fausses diagrammes de températures
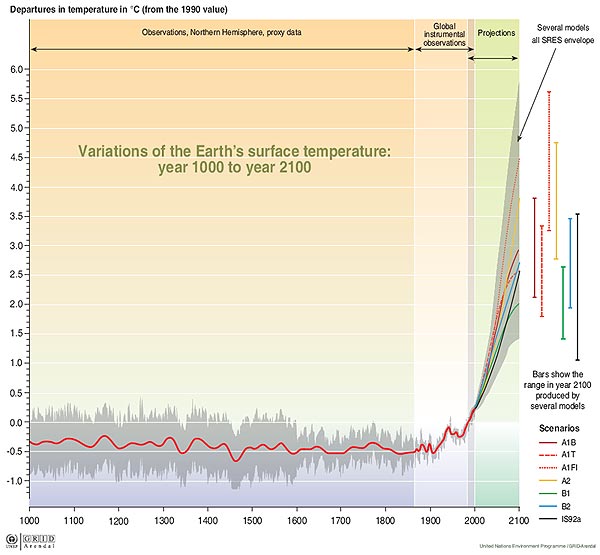
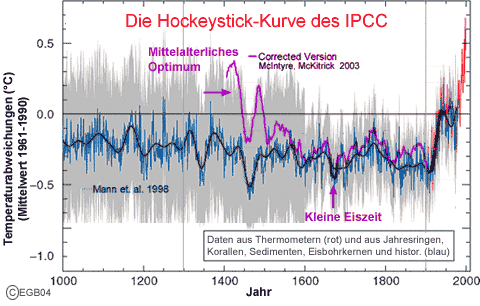
Die weltbekannte Hockeystick-Kurve ist eine Fälschung
en Falsification of the century with the
hockeystick curve by Michael Mann
fr Falsification du siècle avec la courbe de
la crosse de hockey par Michael Mann
![]()
![]() Die Hockeystick-Kurve des IPCC
Die Hockeystick-Kurve des IPCC
![]()
![]() Broken Hockey Stick! /
Die weltbekannte Hockeystick-Kurve ist eine Fälschung
Broken Hockey Stick! /
Die weltbekannte Hockeystick-Kurve ist eine Fälschung
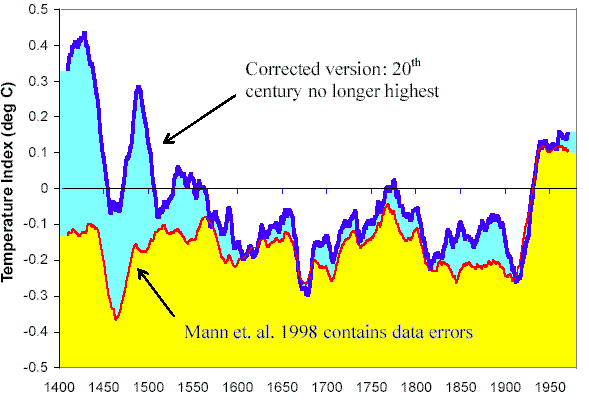
Der Betrug mit der "Hockeystick-Kurve":
-
Die Kurve von Mann et al. zeigt keine Warmzeiten in der Vergangenheit.
→ Damit entsteht der Eindruck, die heutige Erwärmung sei ein aussergewöhnliches Ereignis. -
Diese Kurve diente in Kyoto als Basis des "Kyoto-Protokolls".
→ Ohne diesen Betrug wäre das Kyoto-Protokoll wahrscheinlich nicht angenommen worden. -
Es wird auch in der Literatur von Betrug gesprochen.
→ Die richtigen Temperaturen waren bekannt, als diese Kurve erfunden und manipuliert wurde.
|
|
↑
5 Das Hockeyschläger Diagramm
en The Hockey stick curve
fr La courbe en crosse de hockey
-
de Diese Annahmen für das Kyoto-Protokoll sind falsch
-
en These data used as basis for the Kyoto-protocol are wrong
-
fr Ces valeurs pris comme base du protocole de Kyoto sont fausses
|
de Aus der Panik-Küche en From the panic laboratory fr De la marmite des alarmistes
|
de Das Holozän en The Holocene fr Le holocène
![]() Die unterschlagene historische COMNISPA-Temperaturkurve
Die unterschlagene historische COMNISPA-Temperaturkurve
![]()
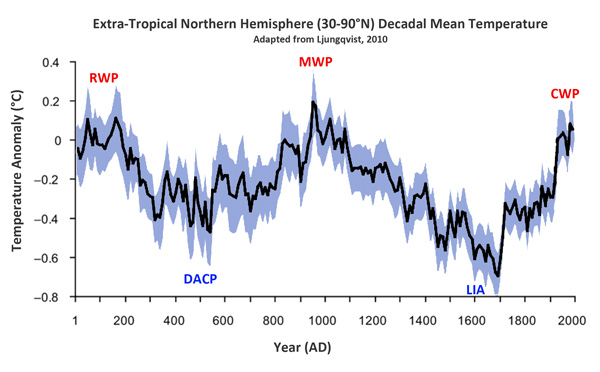
![]() Temperaturentwicklung der letzten 2000 Jahre auf der außertropischen
Nordhemisphäre
Temperaturentwicklung der letzten 2000 Jahre auf der außertropischen
Nordhemisphäre
RWP = Roman Warm Period
DACP = Dark Ages Cold Period
MWP = Medieval Warm Period
LIA = Little Ice Age
CWP = Modern Warm Period
![]()
![]() Wassertemperaturen der vergangenen 2000 Jahre
Wassertemperaturen der vergangenen 2000 Jahre

|
|
de
Das Hockeyschläger Diagramm |
↑
6 Als das IPCC das Mittelalterliche Klimaoptimum verschwinden ließ
en IPCC changed viewpoint on the MWP in 2001
fr Comme le GIEC avait disparu le Optimum médiéval climatique
MWP = Medieval Warm Period (Mittelalterliche Warmzeit)
LIA = Little Ice Age (Kleine Eiszeit)
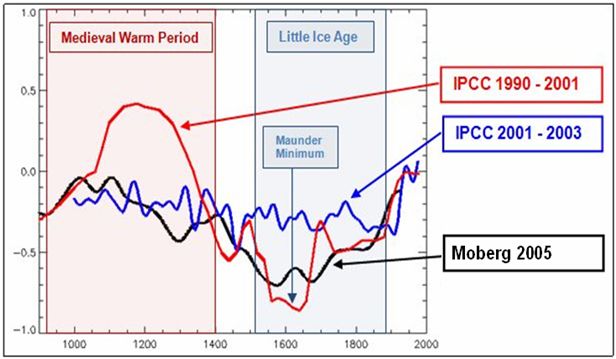
Ab 2001 verschwindet dieses geschichtlich belegte Phänomen.
|
|
↑
7 IPCC: Falsche CO2-Konzentrationen
en IPCC: Wrong CO2 curves
fr GIEC: Fausses diagrammes de CO2
de Aus der Panik-Küche en From the panic laboratory fr De la marmite des alarmistes
-
de Diese Annahmen für das Kyoto-Protokoll sind falsch
-
en These data used as basis for the Kyoto-protocol are wrong
-
fr Ces valeurs pris comme base du protocole de Kyoto sont fausses
|
|
|
Neue Forschungen
en New scientific research
fr Nouvelles recherches scientifiques
![]()
![]() 180 Years of atmospheric CO2 Gas Analysis by Chemical Methods
180 Years of atmospheric CO2 Gas Analysis by Chemical Methods

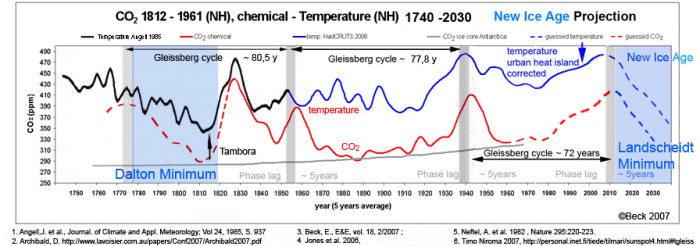
de Hiermit wird bewiesen, dass die CO2-Kurven des IPCC falsch sind:
- Ernst-Georg Beck stellt die Resultate der IPCC CO2-Kurve in Frage, indem er zeigt, dass die in den Eisbohrkernen gemessenen CO2-Konzentrationen nicht den seit 180 Jahren direkt gemessenen Werten entsprechen.
- Die Auswertung von 90.000 Kohlendioxid-Messungen zwischen 1812 und 1958 durch Ernst-Georg Beck in "Environment and Energy" zeigen, dass 1825, 1857 und 1942 die Kohlendioxid-Gehalte der Luft höher waren als heute.
- Die CO2-Konzentrationen sind nicht erst seit der Industrialisierung gestiegen.
- Wir habe heute keine aussergewöhnliche Situation.
- Dies ist gleichzeitig ein Hinweis, dass das CO2 nicht für die Temperaturerhöhung verantwortlich ist.
-
Prof. Zbigniew Jaworowski gibt im März 2004 ein Statement ab.
Darin weist er nach, dass:- die aus den Eisbohrkernen abgeleiteten CO2-Konzentrationen falsch sind und
- die allgemein als Basis der Klimamodelle angenommene präindustrielle CO2-Konzentration von 290 ppm ebenfalls falsch ist und tatsächlich 335 ppm ist.
|
Ernst-Georg Beck *1948 †2010-09-21 |
Dipl. Biologe, Biesheim, Frankreich
|
| de | en | fr |
|---|---|---|
| Klimawandel: Probleme | Climate change: Problems | Changement climatique: Problèmes |
| Falsche CO2-Konzentrationen von IPCC und Kyoto | Wrong CO2-Concentrations of IPCC and Kyoto | Fausses concentrations du CO2 du GIEC et de Kyoto |
↑
8 IPCC: Falsche Methan-Konzentrationen
en IPCC: Wrong Methane curves
fr GIEC: Fausses concentrations de méthane
|
Methan-Konzentration [ppm] (1984-2006) |
|
|
|
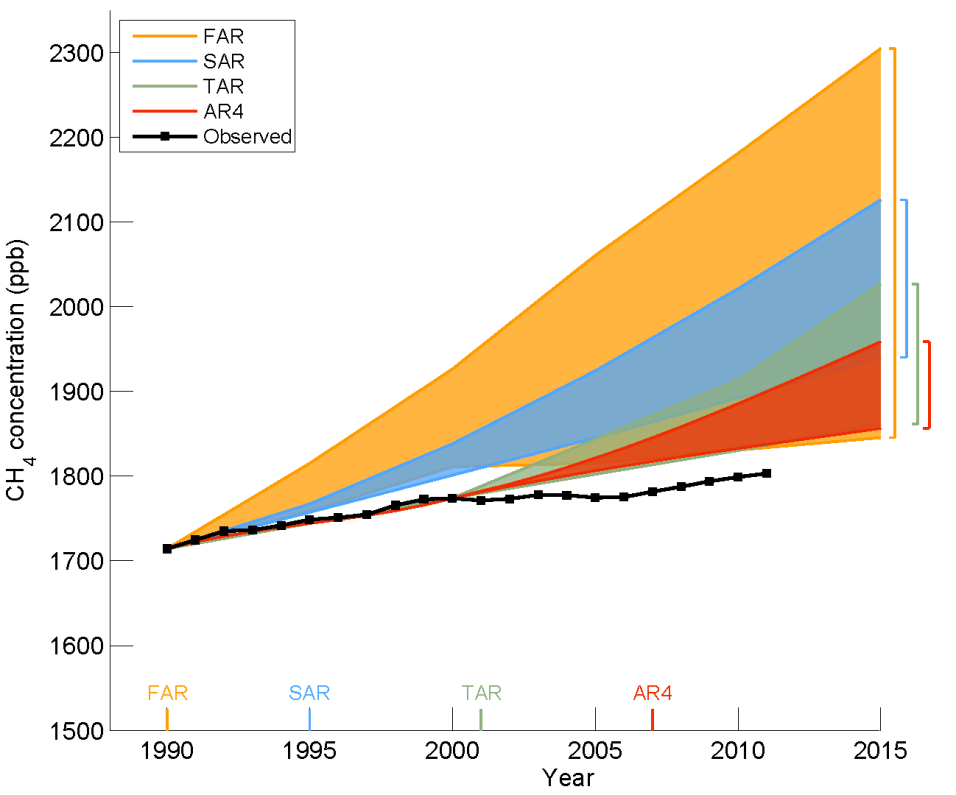
Feststellung / Facts / Constatations:
de
Methan stagniert seit mehreren Jahren. Folgerung / Conclusion / Conclusion:
de
Methan hat keinen Einfluss auf die Globale Erwärmung. |
|
de Aus der Panik-Küche en From the panic laboratory fr De la marmite des alarmistes
-
de Diese Annahmen für das Kyoto-Protokoll sind falsch
-
en These data used as basis for the Kyoto-protocol are wrong
-
fr Ces valeurs pris comme base du protocole de Kyoto sont fausses
|
|
|
| de | en | fr |
|---|---|---|
|
Klimawandel: Wissenschaft Methan (CH4) |
Climate change: Science Methane (CH4) |
Changement climatique: Science Méthane (CH4) |
| Methan-Konzentrationen | Methane Concentrations | Concentrations du méthane |
| Methan hat keinen Einfluss auf die Globale Erwärmung | Methane has no impact on Global Warming | Méthane n'a pas d'impact sur le réchauffement climatique |
↑
9 Temperatur kommt vor CO2
en Temperature leads CO2
fr La température avant le CO2
Feststellungen / Facts / Constatations:
-
de
Steigende Temperatur bewirkt
CO2-Anstieg
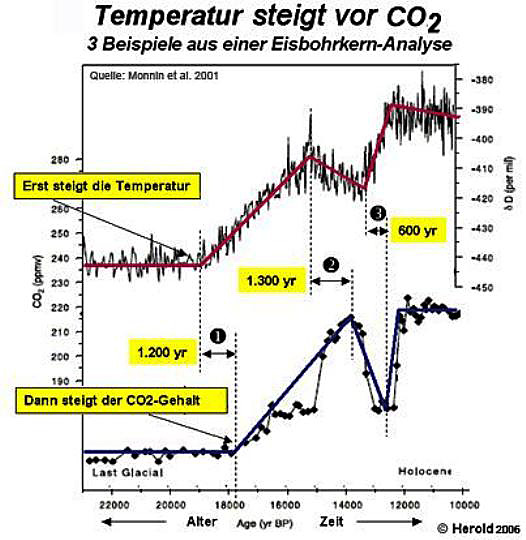
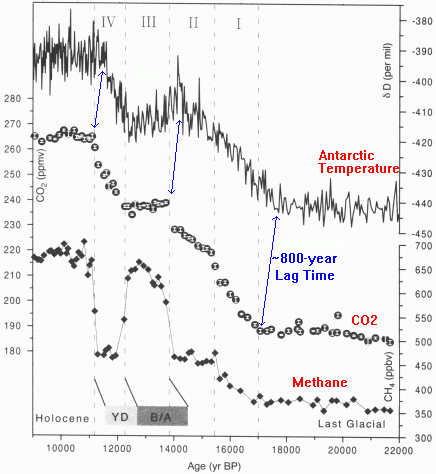
Sinkende Temperatur bewirkt weniger CO2 - In den letzten 400 000 Jahren folgte die CO2-Konzentration um mehrere 100 Jahre nach der Temperaturäderung!!!
-
en
Temperature rise resutls in more
CO2
Temperature reduction gives less CO2 -
fr
Si la température monte, le
CO2 monte
Si la température baisse, le CO2 baisse
![]()
![]() Daten aus Eisbohrkernen der Antarktis (1999)
Daten aus Eisbohrkernen der Antarktis (1999)
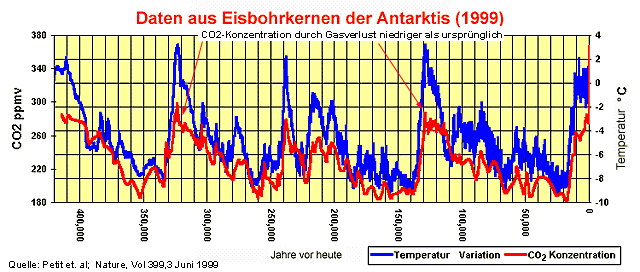
Die zunehmende CO2-Konzentration
ist die Folge und nicht die Ursache der globalen Erwärmung.
en
The rising concentration of CO2
is the result and not the cause of Global Warming.
fr
L'augmentation de la concentration du CO2
est le résultat et pas la cause du réchauffement climatique.
Die Umkehrpunkte zeigen, dass zuerst die Temperatur und erst nachher das CO2 kommt.
-
Da die Temperatur und das CO2 normaleweise miteinander steigen oder
sinken, kann nicht gesagt werden, ob die
Temperatur wegen dem CO2 oder das CO2 wegen der Temperatur steigt oder
sinkt.
→ Das heisst: man sieht nicht, was zuerst kommt und das andere beeinflusst. -
Man sieht erst bei den Umkehrpunkten, was zuerst umkehrt und was
nachher umkehrt.
→ Wenn die Temperatur vom steigen auf abnehmen kehrt, erfolgt dies beim CO2 erst einige hundert Jahre nachher. - Bei hohen Temperaturen ist viel Leben auf der Erde, das CO2 erzeugt und die sich langsam erwärmenden Meere nehmen immer weniger CO2 auf. → Die CO2-Konzentration in der Luft steigt daher langsam.
-
Wenn die Temperatur abnimmt, ist weniger Leben auf der Erde und die
sich abkühlenden Meere nehmen immer mehr CO2 aus der Luft auf.
→ Die CO2-Konzentration der Luft sinkt also mit einer gewissen Verzögerung.
Al Gore sagt in seinen Vorträgen und Filmen genau das Gegenteil:
-
Sehen Sie: Aus den Eisbohrkernen ist klar ersichtlich, dass, das CO2
eine grosse Rolle spielt:
Wenn das CO2 steigt, steigt auch die Temperatur und wenn das CO2 sinkt, sinkt auch die Temperatur.
→ Diese Aussage täuscht vor, dass steigendes CO2 eine steigende Temperatur verursacht. Das ist nicht richtig. -
Genau das Gegenteil ist der Fall.
→ Es muss angenommen werden, dass er am Anfang übersehen hat, was zuerst kommt. - Da dies nun allgemein bekannt ist muss angenommen werden, dass Al Gore sein Publikum absichtlich täuscht, weil sonst sein Hauptargument, die Eisbohrkerne, nicht mehr verwendet werden kann.
Auch das IPCC hat seine Aussagen (noch) nicht revidiert.
- Es wird immer noch behauptet, das CO2 beeinflusse die Temperatur.
-
Wenn das beim IPCC richtig gestellt würde, würde das
voraussichtlich das Ende des IPCC bedeuten.
→ Spruch: Nur die dümmsten Kälber suchen sich ihren Metzger selbst.
| de | en | fr |
|---|---|---|
|
Klimawandel: Wissenschaft Steigende Temperatur bewirkt CO2-Anstieg (nicht umgekehrt! - zuerst kommt die Temperatur!) |
Climate Change: Science Temperature responsible for CO2 rise (not the other way round!) |
Changement climatique: Science La température fait monter le CO2 (pas le contraire!) |
↑
10 IPCC anerkennt keine Temperaturmessungen von Satelliten
en IPCC doesn't accept temperature measuerments from satellites
fr Le GIEC ne reconnait pas les températures par satellites
|
Vergleich von
Oberflächen- und
Satelliten-Temperaturen |
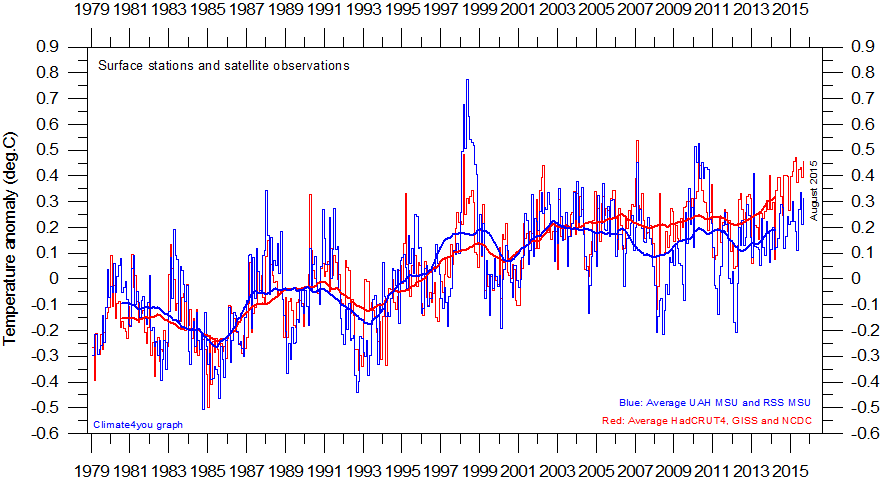
de Die seit 1979 von Satelliten gemessenen Temperaturen werden vom Weltklimarat und der Politik ignoriert.
Satellite measurement has a number of substantial advantages
over surface temperature measurement. |
|
|
|
-
de Die seit 1979 von Satelliten gemessenen Temperaturen werden vom Weltklimarat und der Politik ignoriert.
Die von Satelliten tasten die gesamte Erdoberfläche ab.
Die gemessenen Temperaturen zeigen keinen Temperaturanstieg.Derzeit wird alles versucht, den Temperaturumschwung zu vertuschen.
Tatsächlich wurden bei der Meldung vom wärmsten März 2008 nur die Landtemperaturen verwendet. Die Satelliten zeigen keinen Anstieg bis zum März 2008. Und der Trend der Abkühlung auf der Südhalbkugel 2007 geht weiter. Im April 2008 herrschten in Australien die kältesten Temperaturen seit 60 Jahren.
| de | en | fr |
|---|---|---|
| Temperatur | Temperature | Température |
| Temperaturmessungen durch Satelliten | Satellite Temperature Data | Température mesurages par satelllites |
↑
11 Warum lehnt die NASA Satellitenmessungen ab?
en Why Does NASA Oppose Satellites?
fr Pourquoi la NASA refuse de reconnaître les mesures par satellites?
-
en One of the ironies of climate science is that perhaps the most prominent opponent of satellite measurement of global temperature is James Hansen, head of ... wait for it ... the Goddard Institute for Space Studies at NASA!
As odd as it may seem, while we have updated our technology for measuring atmospheric components like CO2, and have switched from surface measurement to satellites to monitor sea ice, Hansen and his crew at the space agency are fighting a rearguard action to defend surface temperature measurement against the intrusion of space technology.
For those new to the topic, the ability to measure global temperatures by satellite has only existed since about 1979, and is admittedly still being refined and made more accurate.
However, satellite measurement has a number of substantial advantages over surface temperature measurement:
-
It is immune to biases related to the positioning of surface temperature stations, particularly the temperature creep over time for stations in growing urban areas.
-
It is relatively immune to the problems of discontinuities as surface temperature locations are moved.
-
It is much better geographic coverage, lacking the immense holes that exist in the surface temperature network.
Anthony Watts has done a fabulous job of documenting the issues with the surface temperature measurement network in the US, which one must remember is the best in the world.
-
-
Climate Skeptic
2008-07-19 en Why Does NASA Oppose Satellites? A Modest Proposal For A Better Data Set
-
Real Science (Steven Goddard)
2016-02-07 en The Wrong StufflFour years ago, the people with The Right Stuff sent this letter to NASA satellite deniers James Hansen and Gavin Schmidt, who are completely destroying the agency's reputation with their junk science.
March 28, 2012
Letter to The Honorable Charles Bolden, Jr. NASA Administrator NASA Headquarters Washington, D.C. 20546-0001We, the undersigned, respectfully request that NASA and the Goddard Institute for Space Studies (GISS) refrain from including unproven remarks in public releases and websites.
We believe the claims by NASA and GISS, that man-made carbon dioxide is having a catastrophic impact on global climate change are not substantiated, especially when considering thousands of years of empirical data.
With hundreds of well-known climate scientists and tens of thousands of other scientists publicly declaring their disbelief in the catastrophic forecasts, coming particularly from the GISS leadership, it is clear that the science is NOT settled.
The unbridled advocacy of CO2 being the major cause of climate change is unbecoming of NASA's history of making an objective assessment of all available scientific data prior to making decisions or public statements.
As former NASA employees, we feel that NASA's advocacy of an extreme position, prior to a thorough study of the possible overwhelming impact of natural climate drivers is inappropriate.
We request that NASA refrain from including unproven and unsupported remarks in its future releases and websites on this subject.
At risk is damage to the exemplary reputation of NASA, NASA's current or former scientists and employees, and even the reputation of science itself.
For additional information regarding the science behind our concern, we recommend that you contact Harrison Schmitt or Walter Cunningham, or others they can recommend to you.
↑
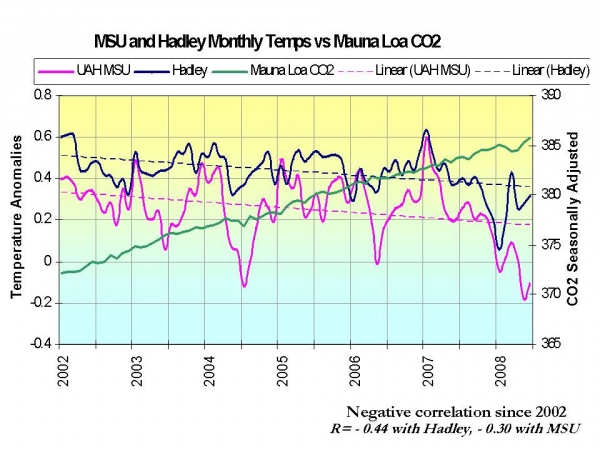
12 Die Abkühlung zeigt den IPCC-Irrtum: Es ist nicht das CO2!
en The cooling shows the IPCC eror: It is not the CO2!
fr Le refroisissemen montre l'erreur du GIEC: Ce n'est pas le CO2!
![]()
![]() World Temperatures Falling Whist CO2 Keeps Rising
World Temperatures Falling Whist CO2 Keeps Rising
-
EIKE Europäisches Komitee Für Klima und Energie Jena
2009-03-17 de Was man uns nicht erzählt! Die Warnungen von Experten vor einer unmittelbar bevorstehenden Klimakatastrophe sind ausschließlich das Produkt von Computermodellen
-
Research Review / Hans Labohm
2009-03 en What we are not being told
-
CO2 Science COM
2008-10-28 en World Temperatures Falling Whist CO2 Keeps Rising
| de | Wenn das CO2 die Erwärmung erklärt, muss es auch die Abkühlung erklären ... oder es muss eine andere Erklärung gefunden werden, dass nebeneinander liegende kalte und warme Zonen - gleichzeitig - verschiedene Ursachen haben. |
| en | If the CO2 explains the warming, it must also explain the cooling ... or another explanation must be found how neighbor cold and warm sectors may - simultaneously - obey to different causes. |
| fr | Si le CO2 explique le réchauffement, il doit aussi expliquer le refroidissement ... ou bien une autre explication doit être trouvée, signifiant alors que des secteurs voisins, chauds et froids, peuvent - simultanément - obéir à des causes différentes. |
|
Marcel Leroux *1938-08-27 †2008-08-12 |
Professeur de climatologie PhD, Professor Emeritus of Climatology, University Jean Moulin of Lyon, France; former director of Laboratory of Climatology, Risks and Environment, CNRS ▶Marcel Leroux: Who is who (Skeptiker) ▶Marcel Leroux: Video (Präsentationen) ▶Marcel Leroux: Sites web (français) ▶Marcel Leroux: Wikipedia (Opfer von Wikipedia) |
![]()
![]() Temperature: HadCRUT3 (negative→positiv→negative),
CO2: Mauna Loa (positive)
Temperature: HadCRUT3 (negative→positiv→negative),
CO2: Mauna Loa (positive)
1939-2008

-
Global warming quiz by Dr. Richard Keen, University of Colorado, Boulder
Skyfall fr QCM sur le réchauffement climatique
| de | en | fr |
|---|---|---|
| Das CO2 steigt und die Temperaturen fallen | CO2 is rising and the temperatures are falling | Le CO2 monte et les températures baissent |
↑
13 IPCC-Report 2007: Zeigt keine Abkühlung
en IPCC-Report 2007: Does not show the cooling
fr Rapport GIEC 2007: Ne montre pas le refroidissement
-
de
Temperaturkurven - CRU 2007:
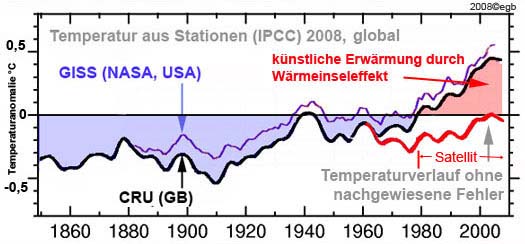
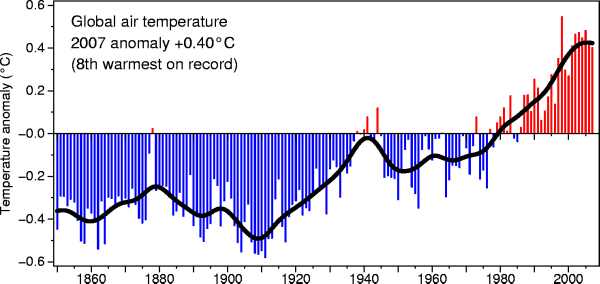
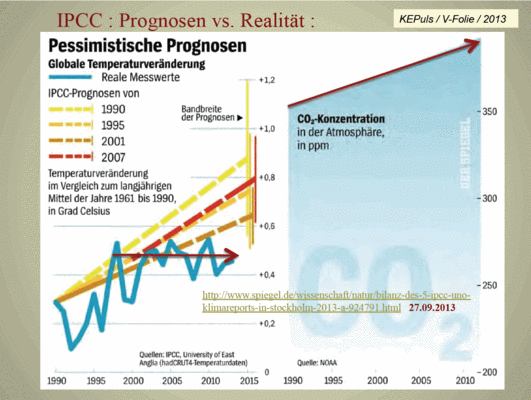
Die Abkühlung nach 2000 wird auf den Kurven des IPCC nicht gezeigt!
en Temperatures - CRU 2007:
The Cooling after 2000 is not showed on the IPCC diagrams!
fr Températures - CRU 2007:
Le refroidissement après 2000 n'est pas montré sur les diagrammes du GIEC!-
de
Deutliche Abkühlung nach 2000.
Diese Abkühlung kann mit dem CO2-Treibhauseffekt nicht erklärt werden.
en Visible cooling after 2000.
This cooling cannot be caused by the CO2 Greenhouse Effect.
fr Refroidissement apparente après 2000.
Ce refroidissement ne peut pas être expliqué avec l'effet de serre.
Quelle: / Source:
-
CRU - Climate Research Unit
UEA - School of Environmental Sciences University of East Anglia
en Home
en Temperature
en Global Temperature Record
-
de
Deutliche Abkühlung nach 2000.
-
de
IPCC Bericht 2007 zeigt keine Abkühlung nach 2000
en IPCC Report 2007 doesn't show the cooling after 2000
fr Rapport 2007 du GIEC ne montre pas le refroidissement après 2000-
de
Temperaturkurven - IPCC Rapport 2007:
Abkühlung nach 2000 wird nicht gezeigt!
Das IPCC kann diese Abkühlung nicht erklären.
Das IPCC irrt sich mit seiner Politik.
en Temperatures - IPCC Report 2007:
Cooling after 2000 is not showed!
IPCC cannot explain this cooling.
IPCC has to change his policy.
fr Températures - rapport GIEC 2007:
Le refroidissement après 2000 n'est pas montré!
Le GIEC n'a pas d'explication pour ce refroidissement.
Le GIEC doit modifier sa politique.
-
de
Temperaturkurven - IPCC Rapport 2007:
-
de
IPCC Temperatur Prognosen
en IPCC Temperature Prognnostics
fr Prévisions des températures du GIEC
- Source: IPCC/WG 1 Fig. 10.4
-
de
Die Prognosen sind nicht realistisch
Falsche Prognosen - Falsche Politik
en The prognostics are not realistic
Wrong prognostics - Wrong Politics
fr Le prognostiques ne sont pas réalistes
Fausses prognostiques - fausses politiques
| de | en | fr |
|---|---|---|
| Das CO2 steigt und die Temperaturen fallen | CO2 is rising and the temperatures are falling | Le CO2 monte et les températures baissent |
↑
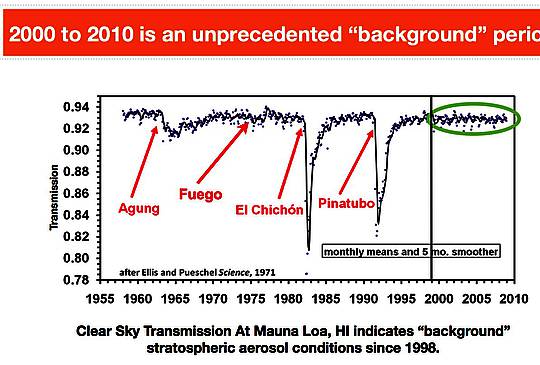
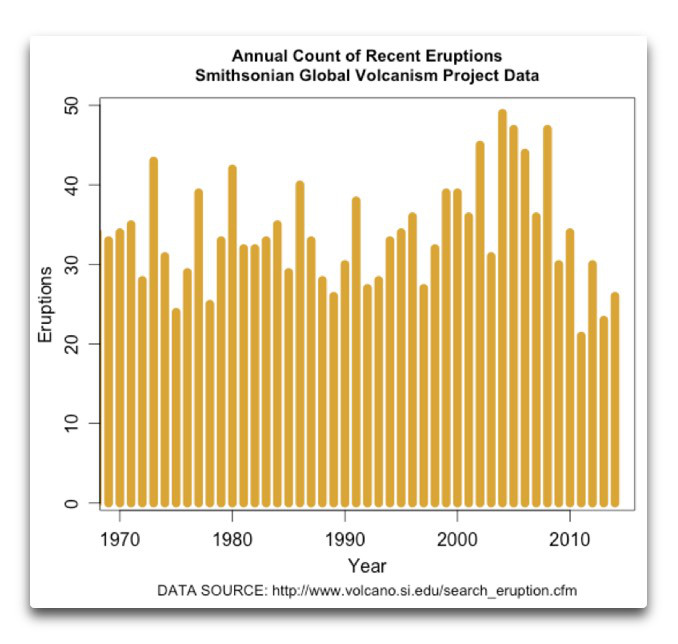
14 Vulkane und der Temperatur-Stillstand
en Volcanoes and the Temperature Pause
fr Volcans et la pause de la température
|
|
|
|
|
|
↑
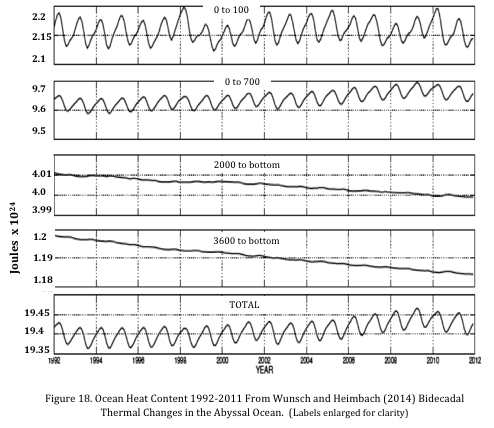
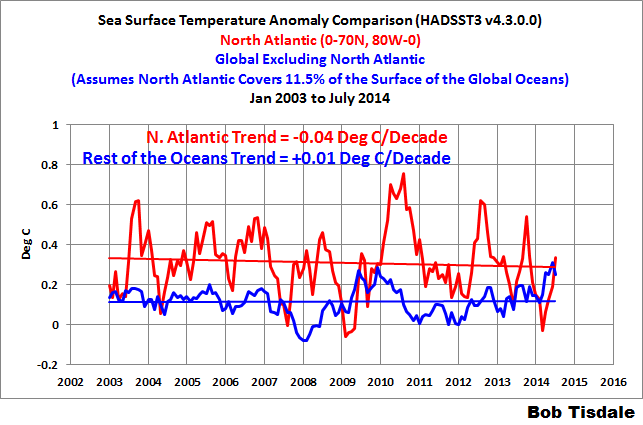
15 Suche nach der angeblich im Ozean versunkenen Wärme endet mit Fehlschlag:
Tiefe Meeresschichten kühlten sich in den letzten 20 Jahren ab
en
The "heat went to the oceans" excuse and Trenberth's missing heat
is AWOL - deep ocean has not warmed since 2005
-
Die kalte Sonne (Fritz Vahrenholt & Sebastian Lüning)
2014-08-05 de Suche nach der angeblich im Ozean versunkenen Wärme endet mit Fehlschlag: Tiefe Meeresschichten kühlten sich in den letzten 20 Jahren abEs hat sich mittlerweile herumgesprochen, dass die Erderwärmung seit 16 Jahren pausiert.
Entgegen den IPCC-Prognosen stagnieren die Temperaturen, es wird einfach nicht mehr wärmer.
Händeringend wird jetzt im Lager des Weltklimarats nach Ursachen gesucht.
Wie konnte dies passieren?
Die Forscher ersannen eine Vielzahl von Hypothesen.
Das am weitesten verbreitete Modell besagt dabei, dass die Oberflächentemperaturen der Erde zwar stagnieren, sich aber in aller Stille die Wassermassen der Tiefsee kräftig aufheizen würden.
Und falls sich diese angestaute Wärme irgendwann an die Erdoberfläche vorkämpfen könnte, dann droht uns die Hitzekatastrophe!
Die Behauptung "Die mittleren Tiefenschichten der Meere haben sich in den vergangenen 60 Jahren 15-mal schneller erwärmt als bei jeder natürlichen Schwankung der vergangenen 10.000 Jahre" ist schlichtweg falsch.
Eigentlich müsste Spiegel Online schnellstmöglch eine Korrekturmeldung nachschieben.
Man hat den Lesern einen Bären aufgebunden, vermutlich um die klimaalarmistische Bewegung zu befördern.
-
Watts Up With That? (Antony Watts)
2014-10-06 en The "heat went to the oceans" excuse and Trenberth's missing heat is AWOL - deep ocean has not warmed since 2005
Meeres-Temperaturen: kein Erwärmungstrend
|
|
![]() Argo Floats : How do we measure the ocean?
Argo Floats : How do we measure the ocean?
| de | en | fr |
|---|---|---|
| Temperatur | Temperature | Température |
| Temperatur und Wärmeinhalt der Ozeane | Temperatures and Heat content of the oceans | Températures et contenu thermique des océans |
↑
16 IPCC Wissenschaftler passen ihren Bericht erneut der
"Summary for Policy Makers" an!
en Tail wagging the dog -
IPCC to rework AR5 to be 'consistent with the SPM'
-
EIKE Europäisches Institut für Klima und Energie
2013-10-19 de IPCC Wissenschaftler passen ihren Bericht erneut der "Summary for Policy Makers" (SPM) an!Das IPCC (Intergovernmental Panel on Climate Change) meldet soeben, dass der von allen Politikern mit ihren Ämtern, Behörden und Instituten, sowie fast allen Journalisten als sakrosankte "Klimabibel" verehrte, umfassende wissenschaftliche Bericht des IPCC AR5 wieder abgeändert wird, um mit der gerade in Stockholm verabschiedeten "Zusammenfassung für politische Entscheider" (SPM Summary for Policy Makers) in Übereinstimmung gebracht zu werden.
-
Watts Up With That? (Antony Watts)
2013-10-12 en Tail wagging the dog - IPCC to rework AR5 to be 'consistent with the SPM'
↑
17 Je größer die Abweichungen desto sicherer die Hypothese
en Tail wagging the dog -
IPCC to rework AR5 to be 'consistent with the SPM'
|
en |
|

|
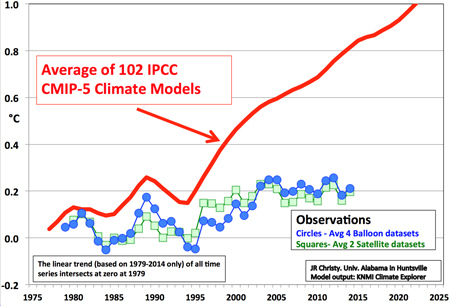
de Die verquere Logik des IPCC en IPCC's Confidence Grows as Models Get Worse Vergleich von Modellvorhersagen und realer Temperaturentwicklung (Roy Spencer) und Auftragung der IPCC-Wahrscheinlichkeiten für die Hypothese, dass der Mensch der Hauptschuldige am Klimawandel ist. Je weiter und deutlicher sich die Realität von den Theorien, Behauptungen und Prognosen entfernt, umso schriller werden die Behauptungen. |
↑ 18 Versuch den Temperatur-Stillstand zu vertuschen
Der Stocker-Trick
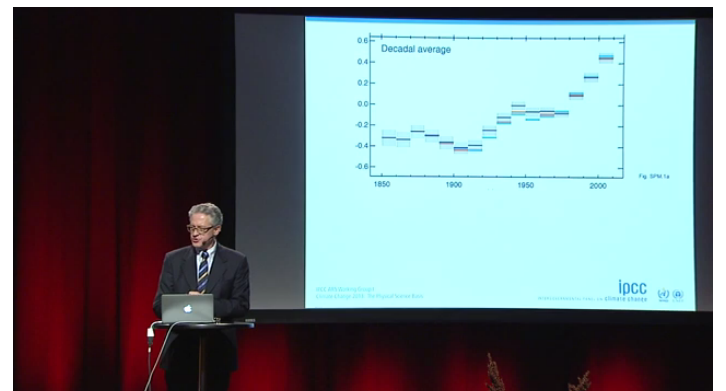
IPCC-Berichts-Häuptling Thomas Stocker hat nun endlich einen graphischen Trick gefunden, wie er die fehlende Erwärmung der letzten 15 Jahre elegant in seinen Temperaturkurven kaschiert:
Er zeigt nur noch Mittelwerte für ganze Jahrzehnte.
|
|
|
|
|
Vademecum: |
| Thomas Stocker |
Professor für Klima- und Umweltphysik an der Universität Bern Als leitender Hauptautor der Arbeitsgruppe "I" war er bereits am vierten Klimabericht der UNO beteiligt. Professur für Klimafolgenforschung von der Mobiliar gestiftet Daten zur Schlüsselszene in Al Gores Film stammen aus seinem Institut. ▶Thomas Stocker: Who is who (Aktivisten der anthropogenen Globalen Erwärmung) |
↑ 19 Dreiste Erklärung: Römischen Warmzeit wegen Erdachsverschiebung
IPCC AR5: Politische Wissenschaft!
Kommentar von Prof. Dr. Horst-Joachim Lüdecke:
Stocker ist, man muss es leider deutlich aussprechen, ein
Advokatenwissenschaftler. Von seinem Kollegen Rahmstorf unterscheidet
ihn offensichtlich nur eine bessere Kinderstube und die damit verbundenen
besseren Manieren.
Zudem ist er (Pardon) ein Lügner, wenn man dem Artikel in der Weltwoche
Nr. 41 mit dem Titel "Klima, Warum man den Forschern misstrauen muss"
trauen darf.
Hier berichtet nämlich der Weltwoche-Redakteur Roger Köppel über sein
Interview mit Stocker "....Meine Bemerkung, als der karthagische Feldherr
Hannibal in der Antike mit seinen Elefanten über die französischen
Alpen marschierte, seien die Gletscher kleiner gewesen als heute,
obschon es keine Autos gegeben habe, lächelte Stocker weg.
Damals, argumentierte er wissend im scheinbaren Triumph, habe die
Stellung der Erdachse die Erwärmung verursacht".
Diese Antwort ist nicht nur eine wissenschaftliche Lüge, sondern sie ist schon dreist.
Stocker missbraucht eine der drei Milankovitch-Zyklen (hier Neigung
der Erdachse) von einer Periodenlänge so um die 40.000 Jahre, um
daraus eine in 2000 Jahren klimawirksame Neustellung der Erdachse
hervorzuzaubern.
Wenn Köppel richtig berichtet, darf dies als Unverschämtheit dem
Redakteur und den Lesern der Weltwoche gegenüber bezeichnet werden.
Und da wir schon bei "Scham" sind, gestehe ich ein: ich schäme mich für
solche "Kollegen" wie Stocker, die den Ruf der Wissenschaft auf
Jahrzehnte hin in Mißkredit bringen.
(
SFR Arena 2013-10-04 Klimaerwärmung: Wie schlimm ist es?
Weltwoche 41/13 - Editorial 2012-10-09 von Roger Köppel)
| Thomas Stocker |
Professor für Klima- und Umweltphysik an der Universität Bern Als leitender Hauptautor der Arbeitsgruppe "I" war er bereits am vierten Klimabericht der UNO beteiligt. Professur für Klimafolgenforschung von der Mobiliar gestiftet Daten zur Schlüsselszene in Al Gores Film stammen aus seinem Institut. ▶Thomas Stocker: Who is who (Aktivisten der anthropogenen Globalen Erwärmung) |
| Horst-Joachim Lüdecke |
Prof. a.D. Dr., Dipl.-Physiker, Heidelberg Hochschule für Technik und Wirtschaft des Saarlandes Pressesprecher des Europäischen Instituts für Klima und Energie (EIKE) ▶Horst-Joachim Lüdecke:Who is who (Skeptiker) ▶Horst-Joachim Lüdecke: Video (Präsentationen) ▶Ausschluss und Maulkorb für Kritiker (Gleichschaltung des Direktoriums vom Alfred-Wegener-Institut in der Klima-Berichtserstattung) ▶Ausschluss und Maulkorb für Kritiker (Das renommierte amerikanische Museum für nationale Geschichte (AMNH) in New York Opfer des Klimakriegs) |
↑ 20 Vorschlag: Korrektur der Modelle und der gemessenen Temperaturen
-
EIKE Europäisches Institut für Klima und Energie
2014-08-21 de Zitat der Woche: Die Zahlenkunde zum "Einwählen" in die KlimawissenschaftDie ETH Zürich mit Ihrem Top Klimaforscher Reto Knutti (IPCC Akteur und dort auch Leitautor) ist immer wieder für eine Überraschung gut, wenn es um die Verteidigung des Klimaalarmismsus geht.
Das Zitat:
Falls die Modelldaten nach unten korrigiert werden, wie von den Forschern der ETH vorgeschlagen, und die gemessenen Daten nach oben korrigiert werden, wie es die britischen und kanadischen Forscher vorgeschlagen haben, dann sind sich das Modell und die tatsächlichen Messungen sehr ähnlich.
-
Whats Up With That? (Antony Watts)
2014-08-19 en Excuse #31 for 'the pause' - El Niño and longer solar cyclesFrom ETH Zurich - Why global warming is taking a break
The average temperature on Earth has barely risen over the past 16 years. ETH researchers have now found out why. And they believe that global warming is likely to continue again soon.
If the model data is corrected downwards, as suggested by the ETH researchers, and the measurement data is corrected upwards, as suggested by the British and Canadian researchers, then the model and actual observations are very similar.
-
Whats Up With That? (Antony Watts)
2014-08-19 en Quote of the week - the numerology of "dialing in" climate science
↑
21 Missbrauch von Klimamodellen
en Why Secretary of State John Kerry Is
Flat Wrong on Climate Change
-
Einführungsvorlesung von Prof. Dr. Reto Knutti an der ETH Zürich.
Klimawandel: Wie unsicher ist die Zukunft?
de Teil 1,
2,
3,
4.
Unbedingt Video Nr. 3 anschauen!!!
Professor Knutti erklärt mit Flugzeugen, warum die IPCC-Klimamodelle
richtig sein sollen!
Er hat zumindest Lacher auf seiner Seite.
Video Teil 3
Bemerkungen: Diese Darstellung ist sehr interessant und zeigt, wie der Durchschnitt von Flugzeugen, von denen angenommen werden kann, dasss sie schon einmal geflogen sind, wirklich einen guten Durchschnitt darstellen.
Bei den Klimamodellen des IPCC konnte bisher aber noch kein einziges Modell die Wirklichkeit in der Vergangenheit reproduzieren.
Es ist also anzunehmen, dass auch mit dem Durchschnitt der IPCC Klimamodelle keine Prognosen für die Zukunft gemacht werden können.
Die Lacher bei der Präsentation haben nicht gemeint, der Vortragende sei besoffen (wie der Vortragende angenommen hat), sie sahen aber den grossen Unterschied zwischen erprobten Flugzeugen und Phantasiegebilden, die nicht in der Lage sind Temperaturen, wie sie vor etwa 1985 und nach dem Jahr 2000 aufgetreten sind, zu simulieren.
Die Erklärung ist einfach: Mit zunehmendem CO2 kann allenfalls eine Temperaturerhöhung errechnet werden, für eine Abkühlung versagt aber diese Theorie und muss daher als eine nicht beweisbare Annahme verworfen werden.
Mit dem Durchschnitt der Klimamodelle deren Zuverlässigkeit herausstreichen zu wollen ist dreist und eines Professors unwürdig.
de Selbst Beurteilen! en Judge yourself! fr Jugez vous-même!
Why Secretary of State John Kerry Is Flat Wrong on Climate Change
|
|
Richard McNider & John Christy
But who are the Flat Earthers, and who is ignoring the scientific facts? de Klimapropheten und -profiteure - Die Klima-Rede von John Kerry |
| John R. Christy |
He is the Distinguished Professor of Atmospheric Science and
Director of the Earth System Science Center at the University
of Alabama in Huntsville. He was appointed Alabama's State Climatologist in 2000. For his development of a global temperature data set from satellites he was awarded NASA's Medal for Exceptional Scientific Achievement, and the American Meteorological Society's "Special Award." In 2002. Christy was elected Fellow of the American Meteorological Society. ▶John R. Christy: Who is who (Skeptiker) ▶John R. Christy: Video (Präsentationen) |
↑
22 Falsche Prognosen der Warmisten
en Wrong prognostics of the Warmist Gurus
fr Fausses prévisions des gurus réchauffistes
- 1 de
Was ist eigentlich aus James Hansens Temperaturvorhersagen geworden?
en James Hansen's climate forecasts of 1988: a whopping 150% wrong - 2 Prognosen von Professor Graßl
- 3 Prognosen des Potsdam Institut für Klimafolgenforschung (PIK)
- 4 Prognosen von Professor Latif
- 5 Prognosen von UK Met Office
- 6 15 Years Since The UN Declared The North Pole To Be Ice-Free
- 7 Gore: Polar ice cap may disappear by summer 2014
- 8 John Holdren - Obamas Wissenschaftsberater
- 9 Weitere Prognosen
↑
1 Was ist eigentlich aus James Hansens Temperaturvorhersagen geworden?
en James Hansen's climate forecasta of 1988:
a whopping 150% wrong
1986
|
WASHINGTON, June 10 1986
The rise in carbon dioxide and other gases in the earth's atmosphere will have an earlier and more pronounced impact on global temperature and climate than previously expected, according to evidence presented to a Senate subcommittee today.
Scientists and senators at a hearing by the Environmental Pollution Subcommittee agreed that the dangers of manmade changes in the atmosphere had moved from hypothesis to imminent reality and must be addressed quickly.
They said the rise in temperatures was expected to cause profound climatic changes and raise sea levels substantially.
Witnesses at the hearing also testified that the ozone layer of the upper atmosphere, which protects the earth from the sun's ultraviolet light, is being rapidly depleted by manmade gases, and the increased ultraviolet radiation would result in a rise in skin cancer cases and other ecological damage.
Dr. James E. Hansen of the Goddard Space Flight Center's Institute for Space Studies said research by his institute showed that because of the ''greenhouse effect'' that results when gases prevent heat from escaping the earth's atmosphere, global temperatures would rise early in the next century to ''well above any level experienced in the past 100,000 years.'' Steeper Rise in Next Century
Average global temperatures would rise by one-half a degree to one degree Fahrenheit from 1990 to 2000 if current trends are unchanged, according to Dr. Hansen's findings.
Dr. Hansen said the global temperature would rise by another 2 to 4 degrees in the following decade.
While the effect of small increases in global temperature is now unclear, Andrew Maguire, vice president of the World Resources Institute, a Washington research and policy group, said that the doubling of atmospheric carbon dioxide that is foreseen would cause a rise of 3 to 8 degrees in temperature by the 2030's.
He said this would devastate agriculture in the United States and elsewhere, and would cause a rise in sea level of some 4.5 feet as polar ice melted.
Earlier projections of warming trends had held that they would not occur before the middle of the next century.
One of the reasons that scientists now expect faster and higher temperature rises is the emerging consensus that gases other than the carbon dioxide emitted by the burning of such fossil fuels as coal are playing a major role in the greenhouse effect.
The greenhouse effect is the name given to the phenomenon created when carbon dioxide, methane, chlorofluorocarbons and other gases accumulate in the atmosphere and prevent radiant heat from the sun that has reached the earth's surface from escaping back into space.
Dr. Hansen and other scientists testifying today said there was now broad consensus among scientists that the greenhouse effect was speeding up the increase in global temperatures. Less Urgency in 1983
In 1983 a report by the National Academy of Sciences said the greenhouse effect was a ''cause for concern,'' but concluded that there was time to prepare for its impact.
The academy report projected a doubling of greenhouse gases by the third quarter of the next century.
Dr. Hansen's research, however, found that if there is no change in the current rate of growth, the greenhouse gases would double by the late 2020's.
A report by the Environmental Protection Agency three years ago said the warming trend could start by the 1990's and could reach as much as 4 degrees Fahrenheit by 2040, but this was attacked by President Reagan's science adviser at the time, George A. Keyworth, as ''unnecessarily alarmist.''
Today, the scientists and the senators on the subcommittee asserted that there must be national and international action now to mitigate and deal with the imminent effects of the atmospheric changes taking place as a result of human activity. Chafee Asks Early Action
Senator John H. Chafee, the Rhode Island Republican who is chairman of the subcommittee, quoted a recent assessment by the Department of Energy, which said, ''Human effects on atmospheric composition and the size and operations of the terrestrial ecosystems may yet overwhelm the life-support system crafted in nature over billions of years.''
Senator Chafee said it would be too risky to wait until all the answers about atmospheric changes were known before taking action.
He called for the Reagan Administration to take up the issue at the next international economic summit meeting and also at the President's next meeting with the Soviet leader, Mikhail S. Gorbachev. While the scientists testified today that it would be some time before there was enough data to pinpoint regional climatic changes, it was considered likely that some of today's most productive agricultural areas would become too arid for farming.
They also testified that a ''hole,'' in which the ozone has been reduced by some 40 percent, has formed in the ozone layer over Antarctica.
While many aerosol uses of chlorofluorocarbons have been banned in this country, their use in other applications is increasing, and they continue to be used in aerosols in other countries.
1988
|
A
B
C |
||
|
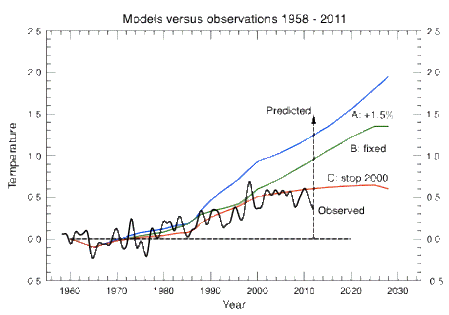
Laut der Hansen-Prognose müsste die Temperatur gegenüber dem Vergleichsniveau in den 1970er Jahren um 1,5°C angestiegen sein. In Wahrheit hat sich die Temperatur jedoch lediglich um 0,6°C erhöht. |
Die CO2-Emissionen sind seit dem Jahr 2000 um jährlich etwa 2,5 Prozent angestiegen, so dass wir gemäß dem Hansen-Paper einen Temperaturanstieg erwarten würden, der stärker als in Modell A ausfallen sollte. |
Es ist ersichtlich, dass die von der Hansen-Gruppe 1988 modellierte Temperaturvorhersage um etwa 150% danebenliegt.
Es ist überaus bedauerlich, dass genau diese Art von Modellierungen von unseren Politikern noch immer als verlässliche Klimavorhersage angesehen wird.
-
Die kalte Sonne (Fritz Vahrenholt & Sebastian Lüning)
Gastbeitrag von Prof. Jan-Erik Solheim (Oslo)
2012-06-15
de Was ist eigentlich aus James Hansens Temperaturvorhersage von 1988 geworden? Zeit für eine Überprüfung
en English original version of the article: James Hansen's predictions versus observations
-
Watts Up With That? (Antony Watts)
2012-06-15 en James Hansen's climate forecast of 1988: a whopping 150% wrong
-
Real Science (Steven Goddard)
2012-06-15 en Clarifying Hansen's Scenarios - Worse Than It Seems
| James (Jim) E. Hansen |
Dr., Former Head of NASA Goddard Institute for Space Studies
in New York City
He also serves as Al Gore's science advisor
▶James (Jim) E. Hansen: Who is who (Aktivisten der anthropogenen Globalen Erwärmung) ▶Ausschluss und Maulkorb für Kritiker (Das renommierte amerikanische Museum für nationale Geschichte (AMNH) in New York Opfer des Klimakriegs) |
← 2 Prognosen von Professor Graßl
-
Die kalte Sonne (Fritz Vahrenholt, Sebastian Lüning)
2012-04-04 de Graßl's Erwärmungsprognose von 1990 droht dramatisch zu scheiternIm Jahre 1990, also vor nunmehr 22 Jahren, alarmierte Hartmut Graßl mit seinem Buch "Wir Klimamacher" die Öffentlichkeit und sagte eine schlimme Klimakatastrophe vorher.
Auf Seite 61 schrieb er damals zusammen mit seinem Co-Autor Reiner Klingholz:
"Schon in den nächsten 30 Jahren wird sich die Erde mit hoher Wahrscheinlichkeit um ein bis zwei Grad erwärmen."
Nun sind die 30 Jahre bald um und wir erlauben uns nachzuschauen, ob sich die Natur an die Prognose gehalten hat.
Das Ergebnis ist ernüchternd:
Zwar ist die globale Durchschnittstemperatur von 1977 bis 2000 um 0,5°C angestiegen, wovon sich etwa die Hälfte davon, also 0,25°C, zwischen 1990-2000 ereignete.Danach begann jedoch der bekannte Erwärmungsstop, der bis heute andauert. Um auch nur die Untergrenze von Graßl's Prognose zu erreichen, müsste die Temperatur in den kommenden 8 Jahren also um 0,75°C ansteigen; um die Obergrenze zu erreichen, sogar um 1,75°C.
Zum Vergleich: Die gesamte Klimadiskussion dreht sich "nur" um 0,8°C, um die sich die Erde seit 1850 erwärmt hat.
Zudem hat Kollege Mojib Latif gerade vorhergesagt, dass sich die "klimatische Atempause", also der Erwärmungsstop bis 2020 fortsetzen wird.
Es sieht also überhaupt nicht gut aus für Graßl's Prognose.
Man muss kein Hellseher sein, um die Prognose schon jetzt als gescheitert zu bezeichnen.
Ganz nebenbei:
Hätten Sie gewusst, dass Graßl Mitglied des Stiftungsrates der Münchener Rück Stiftung ist?
Die enge Verbandelung führender deutscher Klimawissenschaftler mit der interessierten Versicherungsbranche bereitet Sorge.
Wie können Interessenskonflikte ausgeschlossen werden, wenn Versicherungsprämien bei gesteigerter Angst vor Sturm-, Hagel- und Überschwemmungsschäden problemlos angehoben werden?
Bereits 2011 kooperierte das Potsdam-Institut für Klimafolgenforschung (PIK) mit dem Gesamtverband der Deutschen Versicherungswirtschaft (GDV) in einer Studie, die auf wackeliger Grundlage eine Zunahme der Klimaschäden suggerierte.
Gerade Stefan Rahmstorf scheint hier in der Vergangenheit in Punkto Münchener Rück wenig Berührungsängste gehabt zu haben, wie klimaskeptiker.info kenntnisreich dokumentiert hat.
| Hartmut Graßl |
Prof. Dr., Universitätsprofessor Bis 2005 Direktor des Hamburger Max-Planck-Instituts für Meteorologie in Hamburg. 1994 bis 1999 Leiter des Weltklimaforschungsprogramms der UNO in Genf. Mitglied des Stiftungsrates der Münchener Rück Stiftung. ▶Hartmut Graßl: Who is who (Aktivisten der anthropogenen Globalen Erwärmung) |
← 3 Prognosen des Potsdam Institut für Klimafolgenforschung (PIK)
How reliable are the climate models?
|
|
|
(Vorsitzender der Arbeitsgruppe III des Weltklimarats IPCC): Die Besitzer von Kohle, Öl und Gasvorkommen müssen enteignet werden. |
|
|
|
← 4 Prognosen von Professor Mojib Latif
1990 - 2009
-
2012-12-09 de
 Mojib Latif- Klimaprognosen 1990, 1997, 2006, 2008, 2009
Prof. Latif 1997
-
1997
de Mojib Latif 1997 - Neue Eiszeit
Im Jahre 1997 hat der Klimaforscher Mojib Latif in den Sendungen ZDF Hallo Deutschland und DAS! (NDR) Prognosen zu den Wintern der kommenden Jahre abgegeben.
Die Prognosen lauteten folgendermaßen:
"Gemittelt über die nächsten 20 Jahre gehen wir davon aus, dass es eher kälter sein wird."
"Diese Situation (die Nordatlantische Oszillation) hat sich jetzt umgestellt, so dass das Russlandhoch die Überhand über unser Klima gewinnen wird. So das wir davon ausgehen, dass wir innerhalb der nächsten 10 bis 20 Jahre eher mit kühleren Wintern zu rechnen haben."
"Die Nordatlantische Oszillation hat sich in den letzten Jahren umgestellt und wir sind jetzt in einer Phase relativ schwacher Nordatlantischer Oszillation und wir erwarten ähnlich wie in den 60er Jahren relativ kalte Winter in der Zukunft."
Zur globalen Erwärmung sagte er im Jahre 1997
"Daher haben wir es zunächst einmal vor allem mit den natürlichen Klimaschwankungen zu tun, während wir erst in etwa 100 Jahren dann die globale Erwärmung zu spüren bekommen."
-
Die kalte Sonne (Fritz Vahrenholt & Sebastian Lüning)
2013-11-11 de Mojib Latif 1997: "Gemittelt über die nächsten 20 Jahre gehen wir davon aus, dass es eher kälter sein wird"
-
Readers Edition
2010-04-02 de Mojib Latif 1997 - Neue Eiszeit
Prof. Latif 2000
-
"Winter mit starkem Frost und viel Schnee wie noch vor zwanzig Jahren wird es in unseren Breiten nicht mehr geben."
-
In Deutschland gehören klirrend kalte Winter der Vergangenheit an.
-
Spiegel Online 2004-04-01
de Winter ade - Nie wieder Schnee?
In Deutschland gehören klirrend kalte Winter der Vergangenheit an:
"Winter mit starkem Frost und viel Schnee wie noch vor zwanzig Jahren wird es in unseren Breiten nicht mehr geben",
sagt der Wissenschaftler Mojib Latif vom Hamburger Max-Planck-Institut für Meteorologie.
Prof. Latif 2003
-
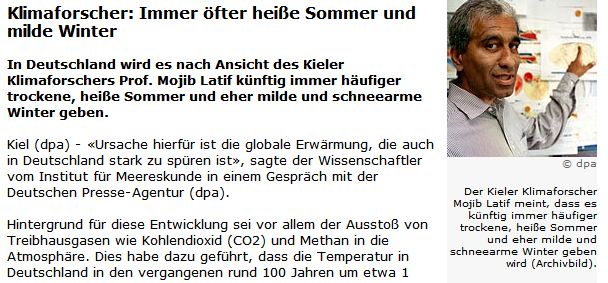
In Deutschland wird es nach Ansicht des Kieler Klimaforschers Prof. Mojib Latif künftig immer häufiger trockene, heisse Sommer und eher milde und schneearme Winter geben.
Prof. Latif 2004
-
Der Kieler Klimaexperte Mojib Latif warnt vor einer drohenden, unkalkulierbaren Erwärmung der Erdatmosphäre: "Der Welt droht eine Heißzeit", sagte der renommierte Meteorologe dem Magazin Readers Digest.
-
Die globale Erderwärmung wird laut Latif "zu Dreiviertel von den Menschen und zu einem Viertel von natürlichen Einflüssen" verursacht.
-
UmweltDialog
2004-08-02 de Klimawandel löst Völkerwanderung aus
Prof. Latif 2008
-
Der Klimawandel könnte erst mal eine kleine Pause einlegen, schreiben der Kieler Forscher Mojib Latif und seine Kollegen im Wissenschaftsmagazin "Nature" (Bd. 453, Seite 84-88).
-
Klimamodelle, die auch Ozeanströmungen berücksichtigten, ergaben einen um etwa 0,2 Grad geringeren Temperaturanstieg als bei früheren, gröberen Simulationen
-
Einen äußeren Grund für das langfristig schwankende Klima, etwa die Sonne, gibt es laut Latif nicht: "Das Klima der Erde schwankt von sich aus, ohne dass man einen speziellen Antrieb dafür braucht."
Prof. Latif 2009
-
Die Erde kühlt sich seit knapp einem Jahrzehnt wieder deutlich ab.
-
Es würde auch in den nächsten Jahrzehnten kälter statt wärmer werden.
-
Mojib Latif
2009-12-02 de Apokalyptische Klimaprognosen: Wie Forscher Angst schüren
2009-03-13 de
 Mojib Latif: Klimaprognosen 2009, 1990, 2008, 1997, 2006
Prof. Latif 2010
-
"... wir müssen weiterhin mit kalten Wintern rechnen, denn der
Einfluss der globalen Erwärmung auf das Wettergeschehen ist zum Glück
noch relativ gering.
Sie werden allerdings immer seltener werden."
Kommentar von Andreas Kreuzmann (Klimaskeptiker.info):
-
"Man kann sich kaum ein durchsichtigeres Rückzugsmanöver vorstellen:
Die angeblich so zuverlässigen Klimamodelle vom letzten Jahr [2007] haben komplett versagt, die aktuellen Messdaten beweisen eine Abkühlung, jetzt hat das natürlich Herr Latif alles schon immer gewusst und berechnet!Und in zehn Jahren (wenn er so langsam in Rente geht - er ist Jahrgang 1954 - und seine Schäfchen im Trockenen hat) kommt dann ganz bestimmt die oft herbeigeredete, aber immer wieder ausgefallene 'Klimakatastrophe', diesmal dann aber wirklich, ganz ehrlich, Ehrenwort!"
Prof. Latif 2012
-
ARD-Morgenmagazin
2012-02-13 de Die kalte Sonne: Fritz Vahrenholt vs. Mojib Latif
Bei dem Klimaforscher Mojib Latif liegen augenscheinlich die Nerven blank, da er auf die Klimathesen von Vahrenholt keine wirklichen Antworten hat.
Seltsam ist auch: Die gleichen Thesen wie Vahrenholt hatte Latif selbst bereits im Dezember 2009 verbreitet, und nun kritisiert Latif diese Thesen an Fritz Vahrenholt.
-
Extremwetter-Kongress in Hamburg / Mojib Latif
2012-03-20/23 de Das Klima bis 2022
Prof. Latif 2015
Man hat aus der Pleite gelernt
Nur noch 15 Jahre bleiben nach ihrer Ansicht, um den Klimawandel in den Griff zu bekommen. "Wenn der weltweite Kohlendioxidausstoß 2030 immer noch steigt, wird es zu spät sein", sagt der Klimaforscher Mojib Latif vom Kieler Helmholtz-Zentrum für Ozeanforschung.
Es ist das erste Mal, dass Latif sich öffentlich so konkret festlegt.
-
Die kalte Sonne (Fritz Vahrenholt & Sebastian Lüning)
2015-06-02 de IPCC im Jahr 2007: "Es bleiben vielleicht nur noch acht Jahre bis zur Klimakatastrophe"Im Jahr 2007 warnte der IPCC anlässlich der Herausgabe des 4. Klimazustandsberichts, dass die Zeit allmählich knapp werde, um die Klimakatastrophe noch zu vermeiden.
Man hätte vermutlich nur noch 8 Jahre, um der Apokalypse zu entkommen.
Man müsse umgehend handeln, sonst drohe die Hölle auf Erden.
Rechnen wir kurz nach:
2007 plus 8 ergibt 2015, unser heutiges Jahr. Von der Klimakatastrophe ist allerdings immer noch nichts zu sehen.
Die Temperatur liegt heute auf dem gleichen Niveau wie 2007 - und wie 1998.
Auch Wetterextreme haben nicht zugenommen.
Ganz offensichtlich hat man 2007 wohl etwas übertrieben.
Erinnern will sich daran heute niemand mehr.
Man blickt lieber in die Zukunft.
Was geht mich mein Geschätz von gestern an?Gelernt hat man aus der Pleite trotzdem: Mojib Latif
Kurzerhand verdoppelte Mojib Latif jetzt die Zeitspanne auf 15 Jahre und startet die Uhr 2015 einfach wieder neu bei Null.
Genial - Die Welt berichtete am 5. April 2015:
Es bleibt nicht mehr viel Zeit.
Das ist die Botschaft, die Klimaforscher den Politikern auf der ganzen Welt auf den Weg geben.
Nur noch 15 Jahre bleiben nach ihrer Ansicht, um den Klimawandel in den Griff zu bekommen. "Wenn der weltweite Kohlendioxidausstoß 2030 immer noch steigt, wird es zu spät sein", sagt der Klimaforscher Mojib Latif vom Kieler Helmholtz-Zentrum für Ozeanforschung.
Es ist das erste Mal, dass Latif sich öffentlich so konkret festlegt.
Im Jahr 2030 ist Latif dann in Rente und es kann ihm dann herzlich egal sein, ob er richtig oder falsch lag.
Ihm muss dabei bewusst sein, dass die Temperaturen auch in 15 Jahren noch auf dem heutigen Niveau liegen könnten, da die Ozeanzyklen bis dahin kühlend wirken werden.
Siehe "Judith Curry prognostiziert Erwärmungspause bis in die 2030er Jahre:
 Nordatlantik wird sich im kommenden Jahrzehnt leicht abkühlen
Hans von Storch fordert in einem solchen Fall Misstrauensvotum gegen CO2".
▶Hans von Storch fordert in einem solchen Fall Misstrauensvotum gegen CO2
Quellen / Sources:
-
Die Welt
2015-04-05 de 2030 schließt sich das Zeitfenster der ErderwärmungNur noch 15 Jahre bleiben nach ihrer Ansicht, um den Klimawandel in den Griff zu bekommen.
Der Klimawandel ist noch abwendbar.
Das zumindest sagt der Klimawissenschaftler Mojib Latif.
Der sinkende Kohle-Verbrauch in China erscheint ihm als leiser Hoffnungsschimmer.
![]() USA: Kohle und Kohlekraftwerke
USA: Kohle und Kohlekraftwerke
![]() de
Die Vereinigten Staaten sind das "Saudi Arabien" der Kohle
de
Die Vereinigten Staaten sind das "Saudi Arabien" der Kohle
en
America is the "Saudi Arabia" of Coal
fr
Les Étas Unis sont "l'Arabie Saoudite" du charbon
-
The Guardian
2007-05-02 en UN scientists warn time is running out to tackle global warmingGovernments are running out of time to address climate change and to avoid the worst effects of rising temperatures, an influential UN panel warned yesterday.
Greater energy efficiency, renewable electricity sources and new technology to dump carbon dioxide underground can all help to reduce greenhouse gas emissions, the experts said.
But there could be as little as eight years left to avoid a dangerous global average rise of 2C or more.
| Mojib Latif |
Dr. rer. nat.,
Professor für Meteorologie am Leibniz-Institut für
Meereswissenschaften (IFM-GEOMAR) an der Universität Kiel.
▶Mojib Latif: Who is who (Aktivisten der anthropogenen Erwärmung) |
← 5 Prognosen von UK Met Office
de
Flop des UK Met Office 2007: "Bis 2014 wird es um 0,3°C
wärmer"
en Smith et al (2007): 0.3°C in 10 years
-
Die kalte Sonne (Fritz Vahrenholt & Sebastian Lüning)
Paul Matthews
2013-12-04 de Vorhersage-Flop des UK Met Office 2007: "Bis 2014 wird es um 0,3°C wärmer"In der Studie von Smith et al. wurden folgende Vorhersagen aufgestellt:
In der Dekade 2004 bis 2014 würde es zu einer Erwärmung um 0,3°C kommen.
Mindestens die Hälfte der Jahre nach 2009 würde wärmer ausfallen als das Rekordjahr 1998
Die Vorhersagen haben sich jetzt jedoch als falsch herausgestellt.
Wir sind fast schon im Jahr 2014 angekommen, und seit dem Jahr 2004 hat es keinerlei Erwärmung gegeben.
Von den Jahren seit 2009 hat kein einziges den Rekord des Jahres 1998 gebrochen, jedenfalls den HadCRUT3-Daten zufolge.
Quellen / Sources:
-
EIKE Europäisches Institut für Klima und Energie
2013-11-30 de Die gekonnten Vorhersagen der Klimawissenschaft
-
The IPCC Report - Looking into the 5th IPCC Report
2013-11-20 en The skillful predictions of climate scienceThe Smith et al paper made the following specific predictions:
There would be 0.3°C warming over the decade 2004-2014
At least half of the years after 2009 would be warmer than the record year of 1998.
These predictions have turned out to be wrong.
We are almost into 2014 and there has been no warming at all since 2004.
Of the years since 2009, none of them have broken the record of 1998 according to HADCRUT3 data.
en Met Office Global Forecasts Too Warm In 13 Of Last 14 Years
-
Watts Up With That? (Antony Watts)
2014-01-29 en BBC Meteorologist: Met Office Global Forecasts Too Warm In 13 Of Last 14 Years
| de | en | fr |
|---|---|---|
|
Neue Kälteperiode Meldungen |
New Cold Period News |
Nouvelle periode froide Actualités |
← 6 15 Years Since The UN Declared The North Pole To Be Ice-Free
Quellen / Sources:
-
Real Science (Toni Heller, alias Steven Goddard)
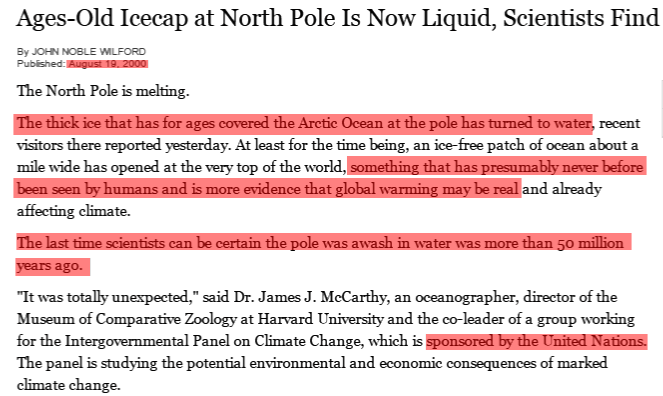
2015-01-02 en 15 Years Since The UN Declared The North Pole To Be Ice-Free
-
The New York Time
2000-08-19 en Ages-Old Icecap at North Pole Is Now Liquid, Scientists Find
← 7 Gore: Polar ice cap may disappear by summer 2014
-
Kopp Online
2013-12-21 en Al Gore sagte voraus, 2013 sei die Arktis völlig eisfrei - stattdessen ist die Eisschicht um die Hälfte gewachsen
-
USA Today
2009-12-14 en Gore: Polar ice cap may disappear by summer 2014
-
 2009-12-16 en
Al Gore Warns Polar Ice May Be Gone in Five Years
Former Vice President Al Gore references computer modeling to suggest that the north polar ice cap may lose virtually all of its ice within the next seven years. "Some of the models suggest that there is a 75 percent chance that the entire north polar ice cap, during some of the summer months, could be completely ice-free within the next five to seven years," says Gore.
-
 2013-09-15 en
Wrong: Al Gore Predicted Arctic Summer Ice Could Disappear In 2013
A 2007 prediction that summer in the North Pole could be "ice-free by 2013" that was cited by former Vice President Al Gore in his Nobel Peace Prize acceptance speech has proven to be off by 920,000 square miles.
In his Dec. 10, 2007 "Earth has a fever" speech, Gore referred to a prediction by U.S. climate scientist Wieslaw Maslowski that the Arctic?s summer ice could "completely disappear" by 2013 due to global warming caused by carbon emissions.
Gore said that on Sept. 21, 2007, "scientists reported with unprecedented alarm that the North Polar icecap is, in their words, 'falling off a cliff.' One study estimated that it could be completely gone during summer in less than 22 years. Another new study to be presented by U.S. Navy researchers later this week warns that it could happen in as little as seven years, seven years from now."
Maslowski told members of the American Geophysical Union in 2007 that the Arctic's summer ice could completely disappear within the decade. "If anything," he said, ?our projection of 2013 for the removal of ice in summer is already too conservative.
The former vice president also warned that rising temperatures were "a planetary emergency and a threat to the survival of our civilization."
← 8 John Holdren - Obamas Wissenschaftsberater
|
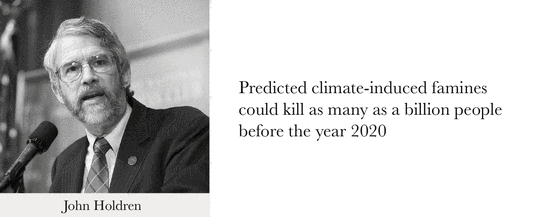
Eine Milliarde CO2-Todesfälle durch Hungersnot bevor 2020 Mehrere prominente Wissenschaftler, haben für die letzten 4 Jahrzehnte eine Katastrophe vorausgesagt, wenn wir fossile Brennstoffe weiterhin nutzen. Im Jahr 1985 sagte Obamas Wissenschaftsberater John Holdren voraus, dass wir jetzt, nahe an einer Milliarde CO2-Todesfälle durch Hungersnot seien, bevor wir 2020 erreichen. |
← 9 Weitere Prognosen
Top 10 FAILED Global Warming Predictions
-
2012-06-16 en
 Top 10 FAILED Global Warming Predictions
ABC News: 2008 prediction about climate in 2015 .. what a gaffe!
-
2015-06-23 en
 2008 prediction about climate in 2015 .. what a gaffe!
New York City underwater?
Gas over $9 a gallon?
A carton of milk costs almost $13?
Welcome to June 12, 2015.
Or at least that was the wildly-inaccurate version of 2015 predicted by ABC News exactly seven years ago.
Appearing on Good Morning America in 2008, Bob Woodruff hyped Earth 2100, a special that pushed apocalyptic predictions of the then-futuristic 2015.The segment included supposedly prophetic videos, such as a teenager declaring,
"It's June 8th, 2015. One carton of milk is $12.99." (On the actual June 8, 2015, a gallon of milk cost, on average, $3.39.)
Another clip featured this prediction for the current year: "Gas reached over $9 a gallon." (In reality, gas costs an average of $2.75.)
de Im Jahr 2008 strahlte der US-amerikanische Sender abcnews eine Sendung zur Klimagefahr aus.
Die wichtigste Nachricht: Schon sieben Jahre später, 2015, würde das Klima verrückt spielen und sich die Klimakatastrophen häufen.
Alles falsch, wie wir heute wissen.
Ungeachtet dieses Fehlschlags werden auch auch heute noch ähnliche Filme produziert.
Wenn dann das Prognosejahr erreicht ist, wird sich eh niemand mehr an die verrückten Schauergeschichten erinnern.
Nine Years Since The New York Times Announced The End Of Winter
-
Real Science (Toni Heller, alias Steven Goddard)
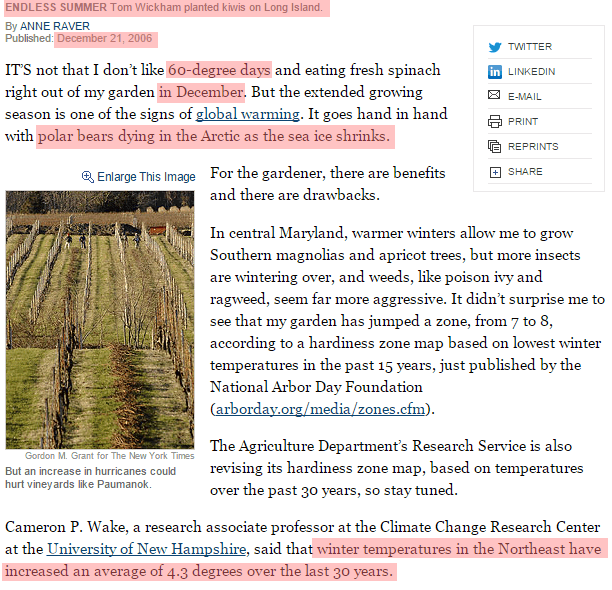
2015-10-01 en Nine Years Since The New York Times Announced The End Of WinterIn 2006, the New York times announced the end of winter and said that winter temperatures in the Northeast had increased 4.3 degrees.
Pentagon Says Europe Will Drown In The Next Four Years
-
Real Science (Steven Goddard)
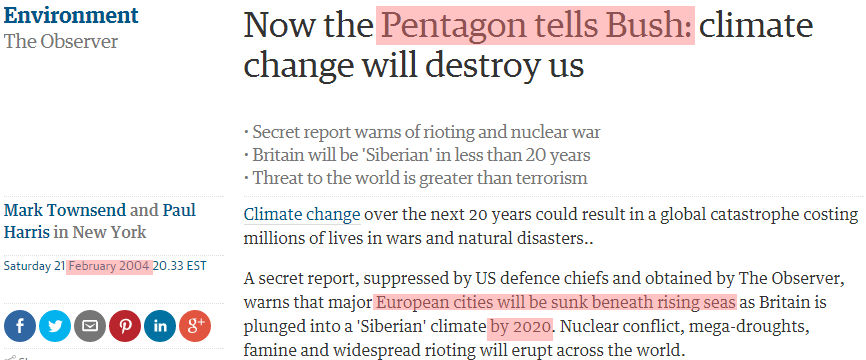
2015-09-27 en Pentagon Says Europe Will Drown In The Next Four YearsWe give the Pentagon hundreds of billions of dollars a year, but they didn't have enough money to find out that sea level isn't actually rising in much of Europe.
↑
23 Zum englischen Gerichtsentscheid betreffend dem Film
"Eine unbequeme Wahrheit"
en In the high court of justice: "An Inconvenient Truths"
fr Les erreurs du film de Al Gore
Zum englischen Gerichtsentscheid vom 10.10.2007 betreffend dem Film
"Eine unbequeme Wahrheit"
en In the high court of justice: "An Inconvenient Truths"
fr La justice anglaise: "Une vérité qui dérange"
|
-
2013-05-25 de
 Der größte Schwindel aller Zeiten
Klimaschwindler in der Klemme
| James (Jim) E. Hansen |
Dr., Former Head of NASA Goddard Institute for Space Studies
in New York City
He also serves as Al Gore's science advisor
▶James (Jim) E. Hansen: Who is who (Aktivisten der anthropogenen Globalen Erwärmung) ▶Ausschluss und Maulkorb für Kritiker (Das renommierte amerikanische Museum für nationale Geschichte (AMNH) in New York Opfer des Klimakriegs) |
| Thomas Stocker |
Professor für Klima- und Umweltphysik an der Universität Bern Als leitender Hauptautor der Arbeitsgruppe "I" war er bereits am vierten Klimabericht der UNO beteiligt. Professur für Klimafolgenforschung von der Mobiliar gestiftet Daten zur Schlüsselszene in Al Gores Film stammen aus seinem Institut. ▶Thomas Stocker: Who is who (Aktivisten der anthropogenen Globalen Erwärmung) |
In Grossbritannien ist es per Gesetz verboten, an Schulen einseitig politische Propaganda zu treiben.
Die britische Regierung hatte, ähnlich wie unser Umweltminister, die Schulen aufgefordert, den Schülern Al Gores Film, der für die Nobelpreisverleihung ausschlaggebend war, zu zeigen.
Dagegen hatte der Elternsprecher Stuart Dimmock geklagt.
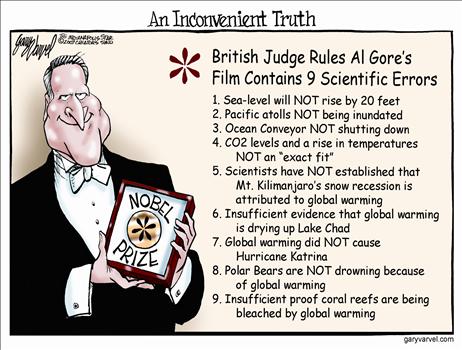
Der Richter Michael Burton (High Court) hat der Klage am 10.10.2007 stattgegeben und entschieden, dass der Film in neun Punkten "partisan political views" (einseitige politische Ansichten) in "the context of alarmism and exaggeration" (im Rahmen von Alarmismus und Übertreibung) verbreite.
Folgende Punkte gaben den Ausschlag für die höchstrichterliche Entscheidung:
-
"Der Film behauptet, die Eisschmelze am Kilimandscharo sei ein Beweis für die Globale Erwärmung.
Der Regierungsvertreter musste zugeben, dass dies nicht richtig ist.
-
Der Film deutet an, dass Daten aus Eisbohrkernen bewiesen, dass die Zunahme von CO2 den Temperaturanstieg der letzten 650,000 Jahren verursacht hätte.
Das Gericht fand, dass der Film irreführend ist:
In diesem Zeitraum folgte die Zunahmen an CO2 jeweils etwa 800-2000 Jahren dem Temperaturanstieg und konnte ihn daher nicht verursacht haben. -
Der Film bedient sich emotionaler Bilder vom Hurrikan Katrina und unterstellt, dass dieser die Folge der globalen Erwärmung gewesen sei.
Der Fachmann der Regierung musste zugeben, dass es nicht möglich ist, einzelne Ereignisse der Globalen Erwärmen anzulasten.
-
Der Film zeigt Bilder vom Austrocknen des Tschad-Sees und behauptet, dies sei durch die Globale Erwärmung ausgelöst worden.
Der Regierungsvertreter gab zu, dass dies nicht der Fall sei.
-
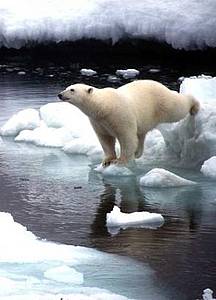
Der Film behauptet, eine Studie zeige, dass Eisbären ertrunken seien, weil das arktische Eis verschwände.
Es stellte sich heraus, dass Herr Gore die Studie falsch gedeutet hatte.
Tatsächlich waren die vier Eisbären wegen eines besonders heftigen Sturmes ertrunken. -
Der Film droht damit, dass die Globale Erwärmung den Golfstrom stoppen und dies Europa eine Eiszeit bringen könnte:
der Kläger konnte wissenschaftliche Beweise erbringen, dass dies eine Unmöglichkeit sei.
-
Der Film gibt der Globalen Erwärmung Schuld am Artensterben, insbesondere dem Ausbleichen der Korallenriffe.
Die Regierung könnte dafür keine Beweise vorlegen.
-
Der Film unterstellt einen Meeresspiegelanstieg über 6 Metern, der die Umsiedlung von Millionen Menschen erforderlich machen wird.
Der tatsächlich zu erwartende Meeresspiegelanstieg in den nächsten 100 Jahren liegt bei etwa 40 cm und stellt keine Bedrohung für einer derart massive Wanderbewegung dar.
-
Der Film behauptet, der Meeresspiegelanstieg würde die Evakuierung einer bestimmten Pazifik Insel bei Neuseeland erfordern.
Die Regierung konnte das nicht bestätigen und das Gericht hielt daher die Behauptung für unbegründet.
(Quelle: Lewis Smith, Al Gore's inconvenient judgment, in: The Times London 11.10.07)
| Albert Arnold (Al) Gore |
American environmental activist former Vice President of the United States (from 1993 to 2001 under President Bill Clinton) former journalist. ▶Albert Arnold (Al) Gore: Who is who (Aktivisten der anthropogenen Globalen Erwärmung) |
↑
24 Die Lüge mit dem raschen Anstieg der Temperaturen festgenagelt
en The Lie with the fast raising temperature nailed
fr Le monsonge avec la température qui monte rapidement cloué
de Die Lüge festgenagelt
Ist die Temperaturssteigerung 1981-2005 einmalig verglichen mit dem
Temperaturanstieg seit der kleinen Eiszeit?
en The lie nailed
Is the global temperature increase 1981-2005 unique compared to the general temperature rise since the end of the Little Ice Age ?
-
EIKE Europäisches Institut für Klima und Energie
2009-12-18 de Lord Monckton über Pachauris Vortrag auf der UN-Klimakonferenz in Kopenhagen
|
|
|
|
↑
25 Der fehlende Hotspot (warme Zone)
en The missing Hotspot
fr Le 'Hotspot'(point chaud) manque
Der 'Hotspot' ist entscheidend für die Klimadebatte.
en The 'Hotspot' is crucial to the climate debate.
fr Le 'Hotspot' est crucial pour le débat sur le climat.
|
IPCC (theoretical) SOURCE: IPCC Assessment Report 4, 2007, Chapter 9, Figure 9.1, page 675  de Die zu erwartende Temperaturverteilung in der Atmosphäre (über Ecuador) nach den Klimamodellen des IPCC. en IPCC: If greenhouses gases are warming the planet that warming will happen first in the cold blob of air 8-12 km above the tropics. fr Les modèles informatiques existants prédisent que la tendance au réchauffement aux tropiques due aux concentrations croissantes de CO2 doit être plus forte dans la troposphère qu'au niveau du sol. Le graphique du rapport AR4 du GIEC montre une zone rouge bien visible, le "hot spot" prévu dans la troposphère tropicale entre 8 et 12 km d'altitude. |
Radiosonde measurements SOURCE: Part E of Figure 5.7 in section 5.5 on page 116 of the US CCSP 2006 report 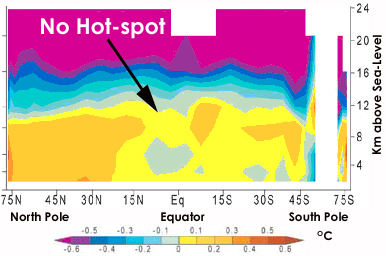 de Real gemessenen Temperaturen im Zeitraum von 1979 - 1999 über den Tropen (Ecuador). Von einem Hot-Spot ist nichts zu sehen und auch die Temperaturverteilung hat mit dem Rechenmodell nichts gemeinsam. en The big problem for the believers of AGW is that years of radiosonde measurements can't find any warming, as shown in the indicated source. fr Cependant les observations des relevés des températures réelles des radiosondes du Hadley Centre rapportées ci-contre ne montrent pas le "hot spot" attendu prédit par le réchauffement induit du CO2. Le "hot spot" prévu est entièrement absent de l'observation des relevés. |
| de | en | fr |
|---|---|---|
| Physikalische Aspekte | Physical aspects | Aspects physiques |
| Der fehlende Hotspot (warme Zone) | The missing Hotspot | Le 'Hotspot'(point chaud) manque |
↑ 26 ERBE Earth Radiation Budget Experiment
|
de Ausstrahlung der Erde (vertikale Achse) im Verhältnis zur Wassertemperatur (horizontale Achse), wie sie vom ERBE-Satelliten (oben links) gemessen worden sind und wie sie von 11 Klimamodellen "vorhergesagt" worden waren. en Climate feedbacks are estimated from fluctuations in the outgoing radiation budget from the latest version of Earth Radiation Budget Experiment (ERBE) nonscanner data. This is the opposite of the behavior of 11 atmospheric models forced by the same SSTs. |
| de | en | fr |
|---|---|---|
| Fehler der Klimamacher, Teil I | Errors of the Climatemakers, Part I | Erreurs des faiseurs du climat, partie I |
| ERBE Earth Radiation Budget Experiment | ||
↑
27 Keine Kipp-Punkte und Kipp-Elemente im Klimasystem
en No Tipping Points
fr Pas de points d'inversion
|
|
Keines der genannten Systeme ist je in der Klimavergangenheit in einen unkontrollierten Zustand übergegangen, sondern es fanden immer zyklische, dynamische Vorgänge statt, die im Wesentlichen astrophysikalisch kontrolliert sind (Hyperzyklen).
Mit dem Begriff Kipp-Punkt wird suggeriert, der Mensch könne
per Kippschalter das Wettergeschehen ändern (Klima = Wetter/Zeit). |
|
Fatal ist, dass alle genannten Beispiele an Kipp-Elementen genau das Gegenteil beweisen und den rein hypothetischen und unrealistischen Charakter des verwendeten Modells bestätigen. |
|
|
|
| de | en | fr |
|---|---|---|
|
Klima: Fragen Klima-Kipp-Punkte |
Climate: Questions Climate Tipping Points |
Climat: Questions Points de non retour dans le climat |
↑
28 Die Erfindung des 2-Grad-Zieles
en Invention of the 2 degree target
fr L'invention du but de 2 degrés
de Aus der Panik-Küche en From the panic laboratory fr De la marmite des alarmistes
Das "2-Grad-Ziel" hat nichts mit fundierter Wissenschaft zu tun.
en This has nothing to do with science
fr Cela n'a rien à faire avec la science
| de | en | fr |
|---|---|---|
|
Klima: Fragen Die Erfindung des 2-Grad-Zieles |
Climate: Questions Invention of the 2 degree target |
Climat: Questions L'invention du but de 2 degré |
|
Klima Probleme: Fehler I Die Erfindung des 2-Grad-Zieles |
Climate Problems: Errors I Invention of the 2 degree target |
Climat problèmes: Erreurs I L'invention du but de 2 degré |
↑
29 Alarmisten-Prognose 2008: "Erderwärmung macht zehn Jahre Pause"
en Computer models 2008: "Global Warming makes a
pause of 10 years"
fr Modèles d'ordinateur 2008:
"Le rechauffement climatique fait une pause de 10 ans"
de Aus der Panik-Küche en From the panic laboratory fr De la marmite des alarmistes
Das ist keine Wissenschaft mehr !
en That is not science anymore !
fr Ce n'est plus de la science !
| de | en | fr |
|---|---|---|
| Fehler der "Klimamacher", Teil II | Errors of the "Climatemakers", Part II | Erreurs des "faiseurs du climat", partie II |
| Alarmisten-Prognose: "Erderwärmung macht zehn Jahre Pause" | Activist Prognostic 2008: "Global Warming makes a pause of 10 years" | Prognostique des activistes 2008: "Le rechauffement climatique fait une pause de 10 ans" |
↑
30 Klimaerwärmung auch wenn es kälter wird
en Global Warming also when it gets colder
fr Réchauffement climatique même s'il devient plus froid
de Aus der Panik-Küche en From the panic laboratory fr De la marmite des alarmistes
Globale Erwärmung führt zur Abkühlung !
en Colder winters possible due to Global Warming !
fr Refroidissement par le réchauffement climatique !
Siehe auch / See also / Voir aussi:
| de | en | fr |
|---|---|---|
| Klima-Panik | Climate Change panic | La panique à cause du réchauffement climatique |
| Globale Erwärmung führt zur Abkühlung! | Colder winters possible due to Global Warming | Refroidissement par le réchauffement climatique |
↑
31 IPCC Modelle können die Zunahme des antarktischen Meereises nicht
erklären
en IPCC models cannot explain progress in
Antarctic Sea Ice
fr Les modèles du GIEC ne peuvent pas expliquer
l'augmentation de la glace maritime en antarctique
Realität
en Reality
fr Réalité
|
Wikipedia Map of Antarctica |
|
|
|
|
|
|
|
|
|
|
|
| de | en | fr |
|---|---|---|
|
Auswirkungen des Klimas Antarktis (Südpol) |
Effects of Climate Change Antarctic (South Pole) |
Conséquences climatiques Antarctique (Pôle Sud) |
de Aus der Panik-Küche en From the panic laboratory fr De la marmite des alarmistes
IPCC Klimamodelle
en IPCC Climate Models
fr Modèles du GI£EC
de Das Ergebnis ist erschreckend:
Die meisten Klimasimulationen modellierten für die vergangenen 30 Jahre fälschlicherweise einen Rückgang des antarktischen Meereises.
en Many of the models have an annual Sea Ice Extent cycle that differs markedly from that observed over the last 30 years.
In contrast to the satellite data, which exhibits a slight increase in Sea Ice Extent, the mean Sea Ice Extent of the models over 1979-2005 shows a decrease in each month.
| de | en | fr |
|---|---|---|
| Fehler der Klimamacher, Teil II | Errors of the Climatemakers, Part II | Erreurs des faiseurs du climat, partie II |
| IPCC Modelle können die Zunahme des antarktischen Meereises nicht erklären | IPCC models cannot explain progress in Antarctic Sea Ice | Les modèles du GIEC ne peuvent pas expliquer l'augmentation de la glace maritime en antarctique |
↑
32 Polare Klimaschaukel: Panik-Modelle können dies nicht erklären
en Polar see-saw cannot be explained by climate models
fr Balançoire polaire ne peut pas être représneté par les modèles
Klimaschaukel zwischen Arktis und Antarktis
en Twentieth century bipolar seesaw of the Arctic
and Antarctic surface air temperatures
|
de Trendbereinigte Temperaturentwicklung der Arktis (blau) und Antarktis (rot Offensichtlich gibt es natürliche Umverteilungsprozesse, die Energie von einer Polarregion in die andere umschaufeln können. en Arctic (blue) and Antarctic (red) temperature time series The 20th century de-trended Arctic and Antarctic temperatures vary in anti-phase seesaw pattern - when the Arctic warms the Antarctica cools and visa versa. |
| de | en | fr |
|---|---|---|
| Pole, Arktis, Antarktis | Pols, Arctic, Antarctic | Pôles, Arctique, Antarctique |
| Polare Klimaschaukel | Polar see-saw | Balançoire polaire |
↑
33 Tropen: Falsche Resultate der Panik-Modelle
en The Tropics: Wrong results of the climate models
fr Les tropiques: Fausses résultats des des modèles climatiques
|
de Die Atmosphäre im rot markierten Bereich ist Gegenstand der Suche nach dem menschlichen Fingerprint des Klimawandels. Resultat: Keine Belege für den sogenannten lang gesuchten menschlichen Fingerabdruck als Wirkmechanismus auf das Klima. en We examine tropospheric temperature trends of model simulations and try to reconcile them with the best available updated observations. Result: Model results and observed temperature trends are in disagreement in most of the tropical troposphere. |
| de | en | fr |
|---|---|---|
| Fehler der Klimamacher, Teil II | Errors of the Climatemakers, Part II | Erreurs des faiseurs du climat, partie II |
| Tropen: Falsche Resultate der Panik-Modelle | The Tropics: Wrong results of the climate models | Les tropiques: Fausses résultats des des modèles climatiques |
↑
34 Kritik am Treibhauseffekt und an der Gegenstrahlung
en Criticism of the Greenhouse Effectof and the back-radiation
fr Critiques de l'effet de serre et du forçage radiatif (back-warming)
| de | en | fr |
|---|---|---|
| Physikalische Aspekte | Physical aspects | Aspects physiques |
| Kritik am Treibhauseffekt und an der Gegenstrahlung | Criticism of the Greenhouse Effect and of the back-radiation | Critiques de l'effet de serre et du forçage radiatif (back-warming) |
↑
35 Wenn die CO2-Konzentration zunimmt,
hat es einen kleineren Erwärmungseffekt
en As Carbon Dioxide increases it has less Warming Effect
fr Lorsque la concentration du
CO2 augmente, son effet de réchauffement diminue
| de | en | fr |
|---|---|---|
| Kohlenstoffdioxid (CO2) | Carbon dioxide (CO2)" | Dioxyde de carbone (CO2)" |
|
Der CO2-Sättigungseffekt Wenn die CO2-Konzentration zunimmt, hat es einen kleineren Erwärmungseffekt |
Der CO2-Sättigungseffekt As Carbon Dioxide increases it has less Warming Effect |
Der CO2-Sättigungseffekt Lorsque la concentration du CO2 augmente, son effet de réchauffement diminue |
↑
36 Falscher CO2-Verstärkungseffekt des IPCC
en Wrong CO2 Feedback Effekt of the IPCC
fr Faux effet de rétroaction du CO2 du GIEC
a Falscher CO2-Verstärkungseffekt
en Wrong CO2 Feedback Effekt
fr Faux effet de rétroaction du CO2
b Der Streit um die Rückkopplungen
en The argument about the feedbacks
fr L'argument des rétroactions
| de | en | fr |
|---|---|---|
|
Fehler der Klimamacher, Teil I Falscher CO2-Verstärkungseffekt des IPCC |
Errors, Part I Wrong CO2 Amplifying Effekt of the IPCC |
Erreurs, partie I Faux effet d'amplification du CO2 du GIEC |
| Der Streit um die Rückkopplungen | The argument about the feedbacks | L'argument des rétroactions |
↑
37 CO2 kann keinen Klimawandel verursachen
en CO2 cannot cause
a Climate Change
fr CO2 ne peut pas
causer un changement climatique
|
From Climate Positive Feedback Theory
From Greenhouse Gas Theory |
|
| de | en | fr |
|---|---|---|
| Zusammenhänge | Correlations | Corrélations |
| CO2 kann keinen Klimawandel verursachen | CO2 cannot cause a Climate Change | CO2 ne peut pas causer un changement climatique |
↑
38 IPCC ignoriert den Einfluss der Sonne
en IPCC ignores the influence of the sun
fr Le GIEC ignores l'influence du soleil
Der Einfluss der Sonne auf das Klima wird nicht anerkannt
en IPCC: The influence of the sun on the climate is not considered
fr GIEC: L'influence du soleil sur le climat n'est pas considérée
| de | en | fr |
|---|---|---|
|
Klimawandel: Probleme IPCC ignoriert den Einfluss der Sonne |
Climate change: Problems IPCC ignores the influence of the sun |
Changement climatique: Problèmes Le GIEC ignore l'influence du soleil |
↑
39 IPCC ignoriert die Sonnenzyklen
en IPCC ignores the Solar Cycles
fr Le GIEC ignores les cycles solaires
Natürliche Zyklik seit 2000 Jahren
en Natural Cycles since 2000 Years
fr Des cycles naturels depuis 2000 ans
de
![]() Sonne und Treibhausgase - Ursachen des Klimawandels
Sonne und Treibhausgase - Ursachen des Klimawandels
(
Quelle 1,
Quelle 2)
en
![]() Global Warming: Second Thoughts of an Environmentalist
Global Warming: Second Thoughts of an Environmentalist
A) Total Solar Irradiance (TSI)
B) Temperature Development

Two things are noteworthy:
-
Every time when solar activity was low, there were periods of cold weather.
Whenever the sun was strong (like in the current warm period, the Roman Warm Period and the Medieval Warm Period), there were warm periods.
-
Secondly, there is obviously a 1,000-year cycle with alternating hot and cold periods.
|
Fritz Vahrenholt
Homepage
KlimaNachrichten/Die Kalte Sonne
Wikipedia
|
Professor, Dr., Deutscher Politiker (SPD), Manager, Wissenschaftler
und Buchautor. ►Fritz Vahrenholt: Who is who (Skeptiker) ▶Fritz Vahrenholt: Präsentationen (Bilder & Grafiken) ▶Fritz Vahrenholt: Video-Präsentationen ▶Fritz Vahrenholt: Wikipedia (Opfer von Wikipedia) |
↑
40 Kritik am IPCC Strahlungsantrieb
en Criticism of the IPCC radiative forcing
fr Critiques au forçage radiatif du GIEC
Antropogenic Radiative forcing:
1,6 Watt/m2
Solar irradiance:
0,12 Watt/m2
![]()
![]()
![]()
![]() IPCC Fourth Assessment Report -
The Physical Science Basis
IPCC Fourth Assessment Report -
The Physical Science Basis
Summary for Policymakers,
page 16, Figure SPM-2

| de | en | fr |
|---|---|---|
| Fehler der Klimamacher, Teil I | Errors of the Climatemakers, Part I | Erreurs des faiseurs du climat, partie I |
| Kritik am IPCC Strahlungsantrieb | Criticism of the IPCC radiative forcing | Critiques au forçage radiatif du GIEC |
↑
41 IPCC ignoriert den Solar-Verstärker
en IPCC ignores the Solar amplifier
fr L'amplificateur du soleil est ignoré par le GIEC
Die Berücksichtigung eines Solarverstärkers würde nämlich auch automatisch eine Verringerung der übertriebenen Klimawirkung des CO2 bedeuten.
Logisch: Wenn die Sonne klimawirksamer wird, muss ein anderer Klimamechanismus in seiner Wirkung reduziert werden, denn es gibt insgesamt nur 0,8°C Erwärmung seit 1850, die es auf verschiedene Klimafaktoren aufzuteilen gilt.
Eine auf diese Weise signifikant reduzierte CO2-Klimawirkung würde zu deutlich weniger anthropogener Erwärmung führen als von Jones et al. in ihrer Arbeit angenommen.
| de | en | fr |
|---|---|---|
| Fehler der "Klimamacher", Teil I | Errors of the "Climatemakers", Part I | Erreurs des "faiseurs du climat", partie I |
| IPCC ignoriert den Solar-Verstärker | IPCC ignores the Solar amplifier | L'amplificateur du soleil est ignoré par le GIEC |
↑
42 IPCC ignoriert Ozeanzyklen - und irrt sich im Temperatur-
Trend
en IPCC ignores Ocean Cycles - and is mistaken
on Temperature Trend
fr Le GIEC ignores les cycles océaniques -
et se trompe sur la température
![]()
![]() Die Pazifisch Dekadische Oszillation (PDO) besitzt eine
Zyklendauer von ca. 60 Jahren.
Die Pazifisch Dekadische Oszillation (PDO) besitzt eine
Zyklendauer von ca. 60 Jahren.

Die Pazifisch Dekadische Oszillation erhöht bzw. erniedrigt die Temperatur um jeweils etwa 0,2°C je nach PDO-Phase.
Der Erwärmungsstop im Jahr 2000 fällt mit dem Abstieg der PDO zusammen und stellt eine Wiederholung der Situation aus den 1940er Jahren dar
Aber es gibt ja nicht nur die PDO, sondern eine ganze Flöte von weiteren klimasysteminternen Zyklen.
Nehmen wir zum Beispiel die AMO. Auch sie besitzt einen etwa 60-jährigen Zyklus, der jedoch um 10-20 Jahre zeitverzögert zur PDO abläuft.
Und auch die Nordatlantische Oszillation (NAO) schwingt in diesem Größenmaßstab.
Ist es nicht verwunderlich, dass all diese Zyklen in ähnlichen Zeitmaßstäben schwingen, wenn auch nicht synchron?
-
Die kalte Sonne (Fritz Vahrenholt & Sebastian Lüning)
2012-07-28 de La Ola im Ozean: Die klimazyklische Stadionwelle
![]()
![]() Temperaturzyklen sind dem Langzeittrend überlagert.
Temperaturzyklen sind dem Langzeittrend überlagert.

Die Temperaturprognose aus dem 2007er IPCC-Bericht folgt offensichtlich der durch die Ozeanzyklen übersteilten Flanke, wäre jedoch besser dem Langzeittrend gefolgt.
Der Langzeittrend wird zudem vermutlich in Kürze für eine Weile abknicken, da die Sonnenaktivität als wichtige Einflussgröße in den kommenden Jahrzehnten abnehmen wird.
-
Die kalte Sonne (Fritz Vahrenholt & Sebastian Lüning)
2012-06-19 de Wu et al. 2011: Erwärmung im späten 20. Jahrhundert durch Ozeanzyklen verstärkt
|
|
↑
43 Die Meeresspiegel sind von den Ozeanzyklen abhängig
en Sea Level and Ocean Cycle correlation
fr Corrélation entre niveau et cycles des océans
de Die Meeresspiegelentwicklung des letzten Jahrhunderts ist durch einen ausgeprägten 60-Jahres-Zyklus geprägt.
Auch das Ende der Erwärmung 1940 und 2000 lag wiederum 60 Jahre auseinander.
en We find that there is a significant oscillation with a period around 60-years in the majority of the tide gauges examined during the 20th Century, and that it appears in every ocean basin.
|
|
Sechzig-Jahres-Ozeanzyklus auch in der Meeresspiegelentwicklung |
↑
44 Südpazifische Oszillation und Kosmische Strahlung
en South Pacific Oscillation and Cosmic Rays
fr Oscillation du Pacific Sud et rayonnement cosmique
|
Südpazifischen Oszillation und kosmischen Strahlung
Eine Gegenüberstellung der um 30 Monate zeitverzögerten gleitenden 3 Jahresmittel der Südpazifischen Oszillation und der durch die Sonnenaktivität modulierten kosmischen Strahlung zeigt in Abb. 4d eine gute Übereinstimmung im periodischen Verlauf von 1980 bis 2008 und weist auf die extraterrestrische Beeinflussung der La Nina - El Nino Perioden hin.
|
de Kurzfassung
Vergleichbar mit den Untersuchungsergebnissen der Nordatlantischen Oszillation (NAO) wird auch die Südpazifische Oszillation (SO) durch Sonnenaktivität beeinflusst:
Während der Wärmeperiode ab 1980 wird eine Resonanz zwischen den Periodizitäten der Sonnenfleckenhäufigkeit in der 22. und 23. Sonnenfleckenperiode und des Sonnenwindindex "aa" mit der zeitverzögerten Südpazifischen Oszillation beobachtet.
Auch die durch die Magnetfelder der Sonnenwinde ausgelösten Periodizitäten der Kosmischen Strahlung sind in diesem Zeitraum mit der zeitverzögerten Südpazifische Oszillation (SO) in Resonanz (K=0,8).
Das führt zu solar gesteuerter Bewölkungsreduktion durch den Svensmark-Effekt und dadurch zu verstärkter Sonneneinstrahlung.
Es erfolgt so ein zusätzlicher Temperaturanstieg und eine zusätzliche Erwärmung des Ozeans in der südlichen Hemisphäre.
Diese solar bewirkte Meereserwärmung führt zur Emission von gelöstem CO2, was als Zusatzdüngung der Weltflora dient.
Eine Temperaturerhöhung durch CO2 lässt sich aus den Messwerten nicht ableiten.
Mit Beendigung der Sonnenaktivität im Dezember 2006 hat auch in der südlichen Hemisphäre eine kalte Wetterperiode begonnen.
en Abstract
It was found that the South Pacific Oscillation (SO) is influenced by Sun activity similar to the North Atlantic Oscillation (NAO).
Especially during the warming period from 1980 to 2009 the oscillation of Sunwind - Index "aa" was in good resonance with the delayed South Pacific Oscillation.
The same observation was found between the Oscillation of Cosmic Radiation, which is controlled by the Forbush - Reduction by the magnetic fields of the sun protons of the Sunwind and the delayed SO (K=0,8).
The consequence of this observations is the postulation, that the increase of global temperature in the Southern Hemisphere was caused by sun activity with strong emissions of Proton-rays in Earth's direction during the 22. and 23. Sunspot-Periods reducing Cosmic Rays with the consequence of reduction of cloudiness, increasing global rays and warming up the lower atmosphere (Svensmark - Effect).
As a consequence resolved CO2 was continuously emitted from the slowly warming up Ocean giving a good fertilizer of the flora of the world.
A relevance of CO2 concerning Climate Change could not be found.
With the end of Sun activity in 2006 a cold weather period has started in the Southern Hemisphere too.
↑
45 Geo-Engineering
en Geoengineering
fr Géo-ingénierie
![]()
![]()
Mit der Verarbeitung zu Mineralwasser ist der
CO2-Ausstoss auf Null gesenkt!

| de | en | fr |
|---|---|---|
|
Klima: Fragen Geo-Engineering |
Climate: Questions Geoengineering |
Clima: Questions Géo-ingénierie |
↑
46 Fundamental falsche Klima-Modelle
en Fundamentally wrong Climate Models
fr Modèles du climat erronés
| de | en | fr |
|---|---|---|
|
IPCC Intergovernmental Panel on Climate Change Fundamental falsche Klima-Modelle |
IPCC Intergovernmental Panel on Climate Change Fundamentally wrong Climate Models |
GIEC Groupe d'experts intergouvernemental sur l'évolution du climat Modèles du climat erronés |
↑
47 Falsche Prognosen mit den Computermodellen
en Wrong prognostics with computer models
fr Fausses pronostiques avec les modèles d'ordinateurs
![]()
![]()
![]() Abb. 10. Prognosen des IPCC zum Meeresspiegelanstieg im 21. Jahrhundert
Abb. 10. Prognosen des IPCC zum Meeresspiegelanstieg im 21. Jahrhundert

-
Watts up with that? (Antony Watts)
2014-04-02 en The big list of failed climate predictions
| de | en | fr |
|---|---|---|
|
Klimawandel: Probleme Prognosen |
Climate change: Problems Prognostics |
Climat: Problèmes Pronostiques |
↑
48 Angstszenairen, Horrorvoraussagen und Schuldzuweisung (mit Videos)
en Fear Scenarious, Horror Previsions and accusations (with Videos)
fr Peur, prévisions de horrifiques et accusations (avec vidéos)
de Verzeichnis en Contents fr Sommaire
- 2019
- de
 Die Öko-Horrorprognosen und ihre perversen Folgen
- 2013
- de
 Rückkehr der Sintflut: Hans-Joachim Schellnhuber, Mojib Latif
und Stefan Rahmstorf
- 2010
- de
 Klimawandel und Schweinepest - das Geschäft mit der Angst
- 2009
- de
 Apokalyptische Klimaprognosen: Wie Forscher Angst schüren
- 2008
- de
 Prof. Schellnhuber "Earth may explode"
de Text en Text fr Texte
⇧ 2019
↑ Die Öko-Horrorprognosen und ihre perversen Folgen
-
2019-04-30 de
 Die Öko-Horrorprognosen und ihre perversen Folgen
Wir hören nahezu täglich Vorhersagen zum Klimawandel, den endlichen Ressourcen, der Polschmelze usw.
Dabei geraten die alten Prognosen schnell wieder in Vergessenheit.
Was waren also die größten Öko-Horrorprognosen und was hatten diese für Folgen?
⇧ 2013
↑ Rückkehr der Sintflut: Hans-Joachim Schellnhuber, Mojib Latif und Stefan Rahmstorf
↑ Rückkehr der Sintflut: Hans-Joachim Schellnhuber, Mojib Latif und Stefan Rahmstorf
de Aus der Panik-Küche en From the panic laboratory fr De la marmite des alarmistes
-
Rückkehr der Sintflut: Hans-Joachim Schellnhuber, Mojib Latif und Stefan Rahmstorf
2013-04-25 de Rückkehr der Sintflut - Wenn das ewige Eis schmilzt +
Wie unsere Kinder leben werden
|
Hans-Joachim Schellnhuber *1950-06-07 |
Professor, Bis September 2018 war er Direktor des 1992 von ihm gegründeten Potsdam-Instituts für Klimafolgenforschung (PIK) ▶Hans-Joachim Schellnhuber: Who is who (Aktivisten der anthropogenen Erwärmung) |
| Stefan Rahmstorf |
Professor, Potsdam-Institut für Klimafolgenforschung
▶Stefan Rahmstorf: Who is who (Aktivisten der anthropogenen Erwärmung) |
| Mojib Latif |
Dr. rer. nat.,
Professor für Meteorologie am Leibniz-Institut für
Meereswissenschaften (IFM-GEOMAR) an der Universität Kiel.
▶Mojib Latif: Who is who (Aktivisten der anthropogenen Erwärmung) |
⇧ 2010
↑ Klimawandel und Schweinepest - das Geschäft mit der Angst
-
2010-10-26 de
 Klimawandel und Schweinepest - das Geschäft mit der Angst.
Die Weltgesundheitsorganisation (WHO) hatte mit Phase 6 die höchste Warnstufe ausgerufen, die Schweinegrippe war offiziell eine Pandemie.
Was für viele Menschen vor allem ein Horrorszenario ist, ist für einige Pharmaunternehmen ein Glücksfall.
Da stellt sich die Frage ob das mit dem Klimawandel auch ausgenutzt wird.
⇧ 2009
↑ Apokalyptische Klimaprognosen: Wie Forscher Angst schüren
-
Bayerisches Fernsehen
2009-12-02 de Apokalyptische Klimaprognosen: Wie Forscher Angst schüren
⇧ 2008
↑ Prof. Schellnhuber "Earth may explode"
↑ Prof. Schellnhuber "Earth may explode"
-
TV Spot in PHOENIX TV at Nov.13th, 2008
2008-11-13 de Prof. Schellnhuber: "dann würde 2050 die Erde explodieren"
Germany Prof. Schellnhuber "Earth may explode"
How the scientific adviser of the German cancellor Angela Merkel acts within the scope of his's authority concerning the future of the world population growth and the climate of the earth.
| de | en | fr |
|---|---|---|
| Klimawandel: Probleme | Climate change: Problems | Changement climatique: Problèmes |
| Horror-Voraussagen und Schuldzuweisung | Horror-predictions and accusations | Prévisions horrifiantes et accusations |
| de | en | fr |
|---|---|---|
|
Zitate Zitate der Paniker zur Abkühlung |
Citations Citations concerning a new ice age |
Citations Citations concernant d'une nouvelle aire glaciale |
| Zitate der Paniker zur Erwärmung | Citations concerning Global Warming | Citations concernant le réchauffement climatique |
| Reaktion der Panikmacher | Reactions of the panic makers | Réactions des faiseurs de la panique |
↑
49 Schwerwiegende Fehler in den IPCC-Rapporten
en Fatal errors in the IPCC Reports
fr Erreurs graves dans les rapports du GIEC
| de | en | fr |
|---|---|---|
| Fehler der Klimamacher, Teil I | Errors of the Climatemakers, Part I | Erreurs des faiseurs du climat, partie I |
| Schwerwiegende Fehler in den IPCC-Rapporten | Fatal errors in the IPCC Reports | Erreurs graves dans les rapports du GIEC |
↑
50 Zitate, Fehler und Falschaussagen der Panikmacher
en Citations, Errors and wrong statements of the panic-makers
fr Citations, erreurs et faux témoignages des faiseurs de la panique
| de | en | fr |
|---|---|---|
|
Zitate Zitate der Paniker zur Abkühlung |
Citations Citations concerning a new ice age |
Citations Citations concernant d'une nouvelle aire glaciale |
| Zitate der Paniker zur Erwärmung | Citations concerning Global Warming | Citations concernant le réchauffement climatique |
| Reaktion der Panikmacher | Reactions of the panic makers | Réactions des faiseurs de la panique |
↑
51 Kritik an Kernaussagen des Global Warming
en Basic declarations of global warming disputed
fr Déclarations de base du réchauffement contestées
| de | en | fr |
|---|---|---|
| Fehler der "Klimamacher", Teil I | Errors of the "Climatemakers", Part I | Erreurs des "faiseurs du climat", partie I |
| Kritik an Kernaussagen des Global Warming | Basic declarations of global warming disputed | Déclarations de base du réchauffement contestées |
↑
52 Manipulation von Wikipediar
en Wikipedia engineers the debate on global warming
fr Wikipedia dirige le débat sur le réchauffement
climatique
| de |
▶ Internet-Terror: Manipulation von Wikipedia durch einen Administrator ▶ Das Lexikon der Lügen ▶ Vom Onlinelexikon zur Propagandamaschine: Zensur, Einschüchterung und arglistige Täuschung ▶ Wikipedia: Klima-Fälscher Connolley: Der Mann, der unser Weltbild umschrieb ▶Die dunkle Seite von WIKIPEDIA: EIKE Zensur - kurz und knapp [Who is who (Skeptische Institute): EIKE; Wikipedia: Websites, Opfer: EIKE, Manipulatoren: Andol] |
|||||
|---|---|---|---|---|---|---|
| en |
▶ At Wikipedia, one man engineers the debate on global warmingator |
|||||
| fr |
▶ A Wikipedia, un homme dirige le débat sur le réchauffement climatique et à sa manière |
↑
53 Kritik an der Klimapolitik, Kritik am IPCC
en Criticism on climate policy, Criticism of IPCC
fr Critique au débat sur le réchauffement
climatique, Critiques du GIEC
Eingabe von den Niederlanden zur Zukunft des IPCC
en Dutch advice to IPCC
|
| de | en | fr |
|---|---|---|
|
Klima: Probleme Kritik an der Klimapolitik |
Climate: Problems Criticism on climate policy |
Clima: Problèmes Critique au débat sur le réchauffement climatique |
| de | en | fr |
|---|---|---|
|
IPCC Intergovernmental Panel on Climate Change Kritik am IPCC |
IPCC Intergovernmental Panel on Climate Change Criticism of IPCC |
GIEC Groupe d'experts intergouvernemental sur l'évolution du climat Critiques du GIEC |
↑
54 Neue Weltordnung
en New World Order
fr Nouvel ordre mondial
| de | en | fr |
|---|---|---|
|
Politik: Global Neue Weltordnung |
Politics: Global New World Order |
Politique: Globale Nouvel ordre mondial |
| Klimawandel und die grosse Transformation | Climat Change and the Great Transformation | Changement climatique et la grande transformation |
| CLIMATE CHANGE AS CULTURAL CHANGE | ||
| Ökologistisch motivierte Umverteilung von Wohlstand | Use Global Warming to Redistribute Wealth | Redistribute de l'argent avec le réchauffement climatique |
| Neue Weltregierung | New World Government | Nouveau Gouvernement mondial |
| Global regieren | Global Governance | Gouverner mondialement |
-
Google Video
2010-12-18 en Global Warming or Global Governance (1:22)
If you were to ask ten people on the street if mankind was causing global warming, at least eight out of ten would say yes.
After all, Al Gore's Inconvenient Truth allegedly provides incontrovertible evidence that this is the case.
Both presidential candidates are committed to passing economically devastating legislation that will do little to nothing to stop global warming.
Contrary to what is heard in the media, however, there is overwhelming evidence that the warming we are experiencing is natural, with maybe a small amount contributed by man's activities.
Nor is there any scientific consensus. 31,000 scientists have signed a petition stating there is "no convincing scientific evidence that human release of carbon dioxide is causing catastrophic" warming.
Is Obama Poised to Cede US Sovereignty?
-
YouTube
2009-10-16 en Is Obama Poised to Cede US Sovereignty?
On October 14, Lord Christopher Monckton gave a presentation in St. Paul, MN on the subject of global warming. In this 4-minute excerpt from his speech, he issues a dire warning to all Americans regarding the United Nations Climate Change Treaty that is scheduled to be signed in Copenhagen in December 2009.
Monckton's entire 95-minute speech can be viewed here:
-
YouTube
2009-10-21 en Updated with Slides - Lord Christopher Monckton Speaking in St. Paul
A draft of the treaty can be read here:
-
YouTube
2009-09-15 en AD HOC WORKING GROUP ON LONG-TERM COOPERATIVE ACTION UNDER THE CONVENTION
↑
55 Politische und wirtschaftliche Auswirkungen
en Political and econimical impacts
fr Impacts politiques et économiques
|
|
Jeder Klimawandel verursacht Kosten, die nicht vermieden werdem können, weil wir das Klima nicht beeinflussen können. Eine allgemeine Erwärmung wird normaleweise als besseres Klima mit besseres Wetter bezeichnet und verursacht im Normalfall nur kleine Anpassungskosten, verbessert die Ernährungslage und fordert weniger Menschenleben. Die Klima-Panik hat keinen Einfluss auf das Klima, sie verursacht nur sehr hohe Kosten, Arbeitslosigkeit Armut und Hunger. |
| de | en | fr |
|---|---|---|
| Auswirkungen des Klimawandels | Impacts of Climate Change | Impacts du changement climatique |
| Politische und wirtschaftliche Auswirkungen | Political and econimical impacts | Impacts politiques et économiques |
| Politischer Ursprung des Global Warming | Political origin of Global Warming | Origine politique du réchauffement climatique |
↑
56 Politischer und ökonomischer Unsinn der Treibhaus-Panik
en Political and economical nonsens with Global Warming
fr Le non-sens de la politique avec le réchauffement climatique
|
|
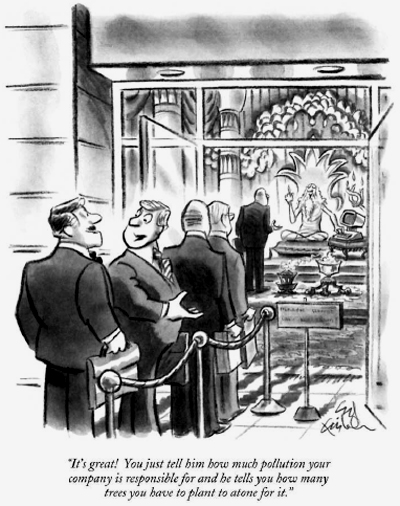
|
de
"Das ist Grossartig! Sie sagen ihm, für wie viel CO2 ihre Firma verantwortlich ist und er sagt ihnen, wie viele Bäume sie pflanzen müssen um das wieder gutzumachen." en "It's great! You just tell him how much pollution your company is responsible for and he tells you how many trees ou have to plant to atone for it." fr "C'est formidable! Vous lui dites pour combien de CO2 votre entreprise est responsable et il vous dit combien d'arbres vous devez planter en compensation." |
| de | en | fr |
|---|---|---|
|
Auswirkungen des Klimawandels Politischer und ökonomischer Unsinn der Treibhaus-Panik |
Impacts of Climate Change Political and economical nonsens with Global Warming |
Impacts du changement climatique Le non-sens de la politique avec le réchauffement climatique |
Das passiert mit Kritikern des IPCC
-
Videoausschnitt
2019-02-02 de Das passiert mit Kritikern des IPCC
- Augusto Mangini, Universität Heidelberg, Institut für Umweltphysik
- Bundesanstalt für Geowissenschaften und Rohstoffe (BGR)
Ganzer Vortrag:
Vortrag des Geologen und "Kalte Sonne"-Autoren
Dr. Sebastian Lüning, am 28.01.2019 bei der AfD-Fraktion im
Bundestag
▶
![]() Sebastian Luening: Wieviel Klimawandel macht der Mensch?
(AfD-Fraktion Bundestag)
Sebastian Luening: Wieviel Klimawandel macht der Mensch?
(AfD-Fraktion Bundestag)
|
Sebastian Lüning
KlimaNachrichten/Die Kalte Sonne
Wikipedia
|
Dr. habil. Dipl. Geologe / Paläontologe ►Sebastian Lüning: Who is who (Skeptiker) ►Sebastian Lüning: Videos (Präsentationen) ▶Sebastian Lüning: IFHGK Institut für Hydrographie, Geoökologie und Klimawissenschaften ►Die kalte Sonne: Who is who (Fritz Vahernholt & Sebastian Lüning) ▶Sebastian Lüning: Wikipedia (Opfer von Wikipedia) |
Sind die IPCC Rapporte korrumpiert?
en Are the IPCC Reports corrupted?
fr Les rapport du GIEC sont-ils corrompus?
de IPCC Rapporte - Korruption?
-
"Dieser Report enthält nicht, was die auf der Titelseite des Rapports angegebenen Wissenschaftler angenommen haben."
-
"Mindestens 15 Schlüssel-Abschnitte wurden gestrichen", wie zum Beispiel:
-
"Keiner der obenerwähnten Studien zeigt einen klaren Beweis, dass der Klimawandel der Erhöhung der Treibhausgase zugeordnet werden kann."
-
"Die Änderungen seien auf die Antwort von Regierungen, individuellen Wissenschaftlerrn und NGO's vorgenommen worden."
en IPCC Reports - Corruption?
-
"This report is not what was approved by the contributing scientists listed on the title page."
-
"At least 15 key sections have been deleted." These include statements as:
-
"None of the studies cited above has shown clear evidence that we can attribute the observed [climate] changes to the specific cause of increases in greenhouse gases".
-
"No study to date has positively attributed all or part of the climate change observed to date to anthropogenic [manmade] causes."
-
Professor Seitz concluded:
"I have never witnessed a more disturbing corruption of peer-review process than the events that led to this IPCC report." -
"In his reply IPCC did not deny making these deletions but stated:
There has been no dishonesty, no corruption of the peer-review process and no bias and that uncertainties have not been suppressed." -
"Changes were in response to comments from governments, individual scientifists and non-governmental organizations."
fr Rapports du GIEC - Corrompu?
-
"Ce n'est pas la version qui a été approuvée par les scientifiques participants listés en première page."
-
"Au moins 15 parties de la section science ont été supprimées", comprenant des sections comme:
-
"Aucune des études citées ci-dessus n'a montré de preuve claire que nous pouvons attribuer les changement climatiques observée à la cause spécifique de l'augmentation des gaz à effet de serre."
-
"Aucune étude à ce jour n'a attribué de manière positive, tout ou une partie des changements climatiques observés aux causes humaines."
-
La conclusion de Professeur Seitz:
"Je n'ai jamais été témoins d'une corruption plus dérangeante du processus de relecture par des pairs que dans ce rapport du GIEC." -
"Dans sa réponse, le GIEC n'a pas nié avoir fait ces suppressions mais il disait qu'il n'y avait pas de malhonnêteté ou biais dans le rapport et que les incertitudes sur les causes du réchauffement global ont été incluses."
-
"Les changements ont été faits, dit le GIEC, en réponse aux commentaires venant des gouvernements, des scientifiques individuels et des ONG."
↑
