3.4.9 Der CO₂-Treibhauseffekt
en
The CO₂ Greenhouse Effect
fr
L'éffet de serre du CO₂
| ⇨ | Klima: Wandel│ Fragen│ Wissenschaft│ Probleme│ Beurteilung│ Diskurse│ Auswirkungen | |||
| ⇩ | Klima-Skandal: Manipulation│ Realität│ Angst | |||
| ⇩ | Neue Kälteperiode: Kaltzeit│ Auswirkung | |||
Mit folgenden Links wird von anderen Webseiten auf diese Seite verwiesen:
| de | en | fr |
|---|---|---|
|
Klimawandel: Wissenschaft Der CO2-Treibhauseffekt |
Climate change: Science The CO2 Greenhouse Effect |
Changement climatique: Science L'éffet de serre du CO2 |
| Einleitung | Introduction | Introduction |
| Die Klimasensitivität von CO₂ | Climate sensitivity of CO₂ | La sensibilité climatique du CO₂ |
|
Die CO₂-Sättigung: Wenn die CO₂-Konzentration zunimmt, ist die Erwärmung wegen der Sättigung kleiner |
The CO₂ Saturation: As Carbon Dioxide increases it has less Warming Effect |
La saturation du CO₂: Lorsque la concentration du CO₂ augmente, son effet de réchauffement diminue |
| Der Streit um die Rückkopplungen | The argument about the feedbacks | L'argument des rétroactions |
| Der fehlende Hotspot (warme Zone) | The missing Hotspot | Le 'hotspot' (point chaud) manque |
| ERBE Earth Radiation Budget Experiment | ERBE Earth Radiation Budget Experiment | ERBE Earth Radiation Budget Experiment |
⇧ de Verzeichnis en Contents fr Sommaire
⇧ Welt-Info
⇧ de Allgemein en General fr Générale
| de | en | fr |
|---|---|---|
|
Klimawandel: Wissenschaft Physikalische Aspekte |
Climate change: Science Physical aspects |
Changement climatique: Science Aspects physiques |
| Atmosphäreneffekt | Atmosphere Effect | Effet atmosphérique |
| Das CERN CLOUD Projekt | The CERN CLOUD Project | Le projet CLOUD du CERN |
|
Grundlagen und Begriffe Physikalische Zusammenhänge Signalanalyse Glossar |
Physical basis and terms Physical correlations Signal processing Glossar |
Bases physiques et termes Corrélations physiques Traitement du signal Glossaire |
| de | en | fr |
|---|---|---|
| Physikalische Aspekte | Physical aspects | Aspects physiques |
| Der Treibhauseffekt | The Greenhouse effect | L'effet de serre |
| de | en | fr |
|---|---|---|
| Physikalische Aspekte | Physical aspects | Aspects physiques |
| Forschungen auf dem Gebiet des Treibhauseffektes | Scientific research on the Greenhouse Effect | Recherches scientifiques sur l'effet de serre |
| de | en | fr |
|---|---|---|
| Physikalische Aspekte | Physical aspects | Aspects physiques |
| Kritik am Treibhauseffekt und an der Gegenstrahlung | Criticism of the Greenhouse Effect and of the back-radiation | Critiques de l'effet de serre et du forçage radiatif (back-warming) |
| de | en | fr |
|---|---|---|
|
Klimawandel: Wissenschaft Wasserdampf / Wolken |
Climate change: Science Water vapor / Clouds |
Changement climatique: Science Vapeur d'eau / nuages |
|
Wolkenforschung, Korrelation zwischen der kosmischen Strahlung und der Wolkenbildung, Korrelation zwischen Wolken und Temperatur, Der Wasserdampfverstärker für das CO2, Das Geheimnis der Wolken. |
||
| de | en | fr |
|---|---|---|
|
Fehler der Klimamacher, Teil I Falscher CO2-Verstärkungseffekt des IPCC |
Errors, Part I Wrong CO2 Amplifying Effekt of the IPCC |
Erreurs, partie I Faux effet d'amplification du CO2 du GIEC |
| Der Streit um die Rückkopplungen | The argument about the feedbacks | L'argument des rétroactions |
| de | en | fr |
|---|---|---|
|
Klima: Wandel Ursachen des Klimawandels |
Climate: Change Causes of Climate Change |
Climat: Changement Les causes du changement climatique |
|
Einflüsse auf das Klima Temperatur der Erde Klima-Beobachtungen Neuste Meldungen zum Klimawandel |
Impacts on Climate Change Earth Temperature Climate Observations News on Climate Change |
Impacts sur le climat Température de la terre Observations sur le climat Dernières nouvelles sur le changement climatique |
⇧ de Text en Text fr Texte
⇧
1 Einleitung
en Introduction
fr Introduction
- a de CO2 in Frage gestellt
- b de Dick Thoenes: Meine Ansichten zum Einfluss von CO₂ auf das Klima
- c de Freispruch für CO2?
- d
de
 Werner Kirstein: Erdklima vs. Klimapolitik
- e
de
Gerhard Wisnewski: Die Klima-Religion
- f de 9 Fragen zum Klimaschutz
- g
de
Wieviel Klimawandel macht der Mensch? -
Eine kritische Überprüfung der IPCC-Thesen - h en Consensus? 200+ New 2019 Papers Support A Skeptical Position On Climate Alarmism
↑ a CO2 in Frage gestellt
- Pensée unique en L'effet de serre remis en question par des physiciens théoriciens!
↑ b Dick Thoenes: Meine Ansichten zum Einfluss von CO2 auf das Klima
-
EIKE Europäisches Institut für Klima und Energie
Dick Thoenes, Professor em. für Chemie-Ingenieurwesen an der Eindhoven University
2015-06-23 de Meine Ansichten zum Einfluss von CO2 auf das KlimaDer Treibhauseffekt von CO2 ist bisher weder in Laborexperimenten noch über realen Beobachtungen bestätigt worden.
Tatsächlich ist nicht schlüssig gezeigt worden, dass eine CO2-Zunahme in der Atmosphäre einen definitiven Einfluss auf das Klima hat.
Wir wissen, dass von der Infrarotstrahlung, die durch CO2 absorbiert werden kann, bereits über 90% schon absorbiert und in Wärme umgewandelt worden sind.
Wenn der CO2-Gehalt steigt, kann die Absorption natürlich niemals über 100% steigen.
Dies wird zu einer Erwärmung unter 2°C führen.
Wir wissen jedoch auch, dass dies mehr Vorteile als Nachteile hätte.
▶Kohlenstoffdioxid (CO₂): CO₂-Experimente
▶Der CO₂-Treibhauseffekt: CO₂-Experimente
↑ c Freispruch für CO2?
-
Gesellschaft Laufpass / Klaus-Eckart Puls
2009-05-23 de Freispruch für CO2?Immer mehr Wissenschaftler zweifeln an der Klimaschädlichkeit des unreaktiven Gases
Fazit
Satelliten-Messungen
Eine Verdoppelung des CO2-Gehaltes in der Atmosphäre kann nach neuesten Auswertungen von Satelliten-Messungen nur wenig mehr als ein halbes Grad Erd-Erwärmung bewirken.
▶Kohlendioxid absorbiert schon nahezu soviel es kann
Hypothese der Klimamodelle
Alle von einigen Klima-Instituten verbreiteten spektakulären Zahlen von 3 / 4 / 5°C Grad Erwärmung in den nächsten 50-100 Jahren beruhen auf einem Modellierungs-Kunstgriff, einer Hypothese - der sogenannten WasserdampfVerstärkung.
Diese Hypothese ist jedoch wissenschaftlich höchst umstritten.
Die Natur
Und selbst die Natur nimmt diese Hypothese offensichtlich nicht zur Kenntnis,
denn seit 1998, also seit zehn Jahren, ist es global im Gesamttrend um zwei Zehntel Grad kühler geworden, wenn auch immer noch auf hohem Niveau.
Dabei ist der CO2-Gehalt weiter angestiegen.
▶Die Erwärmungspause / The Hiatus
Trend
Der Temperatur-Trend hat sich von dem angeblichen KlimaSignal CO2 abgekoppelt.
Es ist eine Illusion zu glauben, man könne durch das Drehen an ein paar CO2-Stellschrauben irgendein WunschKlima festhalten.
Und - diese Illusion kostet die Bürger Milliarden.
Das NIPCC32 sagt dazu: "Es ist für die Wissenschaft beschämend, dass in der globalen Debatte über eine so wichtige Frage ("Klimawandel") öffentlich vorgebrachte Übertreibungen an die Stelle der Vernunft getreten sind".
↑ d Prof. Dr. Werner Kirstein: Erdklima vs. Klimapolitik
-
Prof. Dr. Werner Kirstein / TU Dresden 2018-04-12
2018-06-22 de
Klimawandel: Wird die Wissenschaft politisch beeinflusst?
Ist der Klimawandel menschengemacht?
Ganz klar nein, sagt Prof. Dr. Werner Kirstein.
Als Klimageograph kennt er die Daten der Klimaaufzeichnungen sehr genau.
Und so weiß er auch, dass der Gehalt von CO2 in unserer Atmosphäre nicht nur einen historischen Tiefstand aufweist, welcher nahezu kritische Auswirkungen auf die Flora haben, sondern die Temperatur keinesfalls beeinträchtigt.
Viel mehr ergeben die Daten, dass der Prozess genau umgekehrt ist.
Der CO2-Gehalt passt sich an die Temperatur an.
Im Dezember 2015 trafen sich in Paris mehr als 50.000 Menschen, um an dem Weltklima-Gipfel teilzunehmen.
Besonders stolz war man darauf, dass sich alle teilnehmenden Nationen für eine Reduzierung von Kohlenstoffdioxid (CO2) ausgesprochen und sich verpflichtet haben zu Reduzieren.
Wieviel und nach welchen Maßstäben wurde nicht definiert.
Ziel des Ganzen sei, durch den verminderten Aussoß von CO2 zu bewirken, dass sich die Erde nicht mehr als 2 Grad im Vergleich zum Beginn des Industrie-Zeitalters (ab Mitte des 19. Jhd.) erhöht.
Ein Grad davon haben wir bereits erreicht, so dass das Ergebnis des Klimagipfels letztlich die Absicht aussprach, dass der Mensch, nicht weiterhin das Klima so stark beeinflusst.
Klimawissenschaft und Klimapolitik stehen sich diametral gegenüber.
In diesem Vortrag zeigt Prof. Dr. Werner Kirstein auf, weshalb die Debatte um das Senken von CO2 ausschließlich politischen Zielen dient und keinesfalls der Umwelt, dem Weltklima oder den Menschen.
Faktentabelle
en Table of facts
fr Tableau de faits
|
de CO2-Konzentration und Temperatur vor 600 Millionen Jahren en CO2-Concentration in the atmosphere in the last 600 Millions of Years fr Concentration du CO2 depuis 600 millions ans
|
|
|
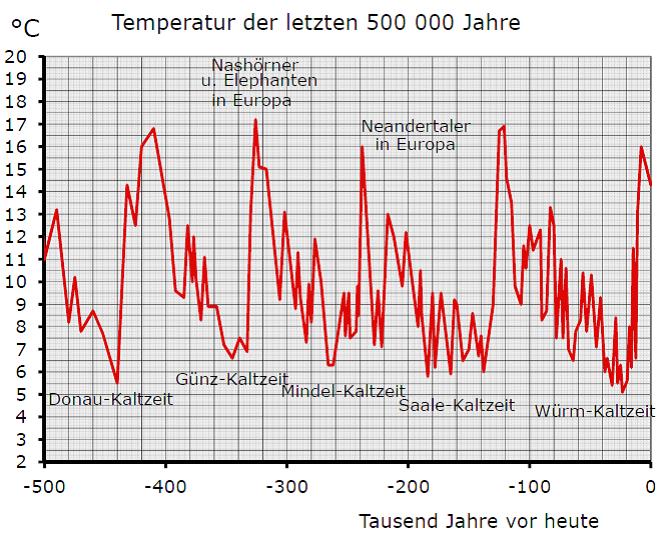
de Die aktuelle Eiszeit seit 500'000 Jahren en The actual Ice Age since 500'000 Years fr L'aire glacière actuelle depuis 500'000 ans Wenn sich der Klimazyklus der vergangenen 500'000 Jahre so fortsetzt, dann könnte das bedeuten, dass in wenigen tausend Jahren wieder der Rückfall auf das echte Eiszeit-Temperaturniveau mit Ausbreitung der Gletscher über Kanada und Skandinavien eintreten würde. |
| de | en | fr |
|---|---|---|
|
Neue Kälteperiode Eiszeiten & Warmzeiten |
New Cold Period Ice Ages & Warm Periods |
Nouvelle periode froide Glaciations & periodes chaudes |
|
|
de Das Holozän en The Holocene fr Le holocène de Das Holozän ist der jüngste Zeitabschnitt der Erdgeschichte; er dauert bis heute an. en The Holocene is a geological epoch which began at the end of the Pleistocene (at 11,700 calendar years BP) fr L'Holocène est une époque géologique s'étendant sur les 10'000 dernières années. |

|
|
de In den letzten 5'000 Jahren waren drei Warmzeiten (grün) wo es wärmer war als heute und die Erde hat dies überlebt. Geniessen Sie die Wärme noch solange sie dauert. en Over the last 5'000 years there were three warm periods (green sections) where it was warmer than today and the Earth survived. Enjoy the warmth while it lasts. fr Pendant les dernières 5'000 années il y avait trois periodes chaudes (vert) avec des températures plus élevés qu'aujourd'hui et la terre a survécue. Réjouissez-vous de la chaleur tant qu'elle dure. |

|
|
de Klima-Entwicklung in den letzten 3200 Jahren en Climat in the last 3200 Years fr Climat dans les 3200 dernières années/span> monte seulement après
|

|
|
de Die Mittelalterliche Warmzeit und die Kleine Eiszeit en Medieval Warm Period and the Little Ice Age fr L'optimum climatique médiéval et le petit âge glaciaire
|
|
|
de Meeresspiegel-Anstieg vor Kohlenwasserstoff-Anstieg Kein Einfluss von CO2 und der fossilen Energien! en Sea level rise before Hydrocarbon use increase
No influence of CO2 and fossile energy! fr Augmentation du niveau des océans avant l'augmentation des hydrocarbures Pas d'influence du CO2 et des énergies fossiles! |

|
|
de Der Anteil von CO2 in der Luft fr Concentration du CO2 actuelle
Sauerstoff (O2): 21 %
0,04 Volumen-Prozent der Luft Von den 0,04 Prozent CO2 in der Luft produziert die Natur 96,5 Prozent, der Rest, also 3,5 Prozent, der Mensch.
Der Mensch produziert also 3,5 % 0.0014 % der Luft sind etwa 1 Teil CO₂ auf 71'000 Teile Luft oder 1/71'000 der Luft. |

![]()
![]()

Die Realität: CO2-Rückgang seit 600 Millionen Jahren.
![]()
![]()
Entwicklung des CO2-Gehalts
der Atmosphäre in den letzten ca. 570 Mio. Jahren.
Der Parameter RCO2 bezeichnet das Verhältnis des Massenanteils an
CO2 in der Atmosphäre des jeweiligen Zeitpunkts
im Vergleich zum vorindustriellen Wert von ca. 300 ppm
(Grafik: W. H. Berger)
Demnach lag der CO2-Gehalt der Erdatmosphäre vor etwa 500-600 Millionen Jahren bis zu 20mal höher als in den letzten paar Jahrhunderten vor der industriellen Revolution.
Im Laufe der Zeit gab es dabei auch teils erhebliche Schwankungen.
So begann der CO2-Gehalt vor etwa 450 Millionen Jahren erheblich abzusinken, bevor er vor rund 250 Millionen Jahren erneut auf etwa den fünffachen heutigen Wert anstieg.
Seither nimmt er - wenn auch mit einer Reihe von Schwankungen - im Prinzip kontinuierlich ab.
Heute haben wir die seit 500-600 Millionen Jahren nahezu niedrigsten CO2-Konzentrationen in der Atmosphäre.
Würde man der obigen "Fieber"-Argumentation folgen, dann hätte die Erde vor Jahrmillionen fast schon kochen müssen.
So sprach der Schweizer Professor und IPCC-Berichts-Chef Thomas Stocker in einem Interview mit der Weltwoche am 11. 4. 2013 von einem Temperaturanstieg von 2 bis 4,5 °C pro Verdopplung des vorindustriellen CO2-Gehalts von 280 ppm.
Zahllose Fossilien belegen jedoch, dass sich die Tier- und Pflanzenwelt früherer Zeiten trotz eines um bis zu 2000 % höheren CO2-Gehalts im Großen und Ganzen bester Lebensbedingungen erfreute.
|
|
de Vom Menschen verursachtes CO₂ CO2 ist einer der wichtigsten Nährstoffe für Leben auf der Erde. Es hat sich in den letzten Perioden der großen Vereisung in der Eiszeit des Pleistozäns einem gefährlich niedrigen Niveau angenähert, und die menschlichen CO2-Emissionen können das Aushungern und den letztendlichen Tod des meisten Lebens auf dem Planeten aufgrund eines CO2-Mangels verhindern.
▶de
Die Auswirkungen von CO₂ auf das
Überleben des Lebens |

![]()
![]() IPCC AR 5 SYR Figure 1.5
IPCC AR 5 SYR Figure 1.5

|
|
de Falsche CO2-Konzentrationen von IPCC und Kyoto en Wrong CO2-Concentrations of IPCC and Kyoto fr Fausses concentrations du CO2 du GIEC et de Kyoto de Diese Annahmen für das Kyoto-Protokoll sind falsch en These data used as basis for the Kyoto-protocol are wrong fr Ces valeurs pris comme base du protocole de Kyoto sont fausses So macht man den Leuten Angst; so wird man hereingelegt. Dieses Bil wurde jahrelang als "Logo" der WG1 vom IPCC (Prof. Thomas Stocker) verwendet. |
![]()
![]()
|
|
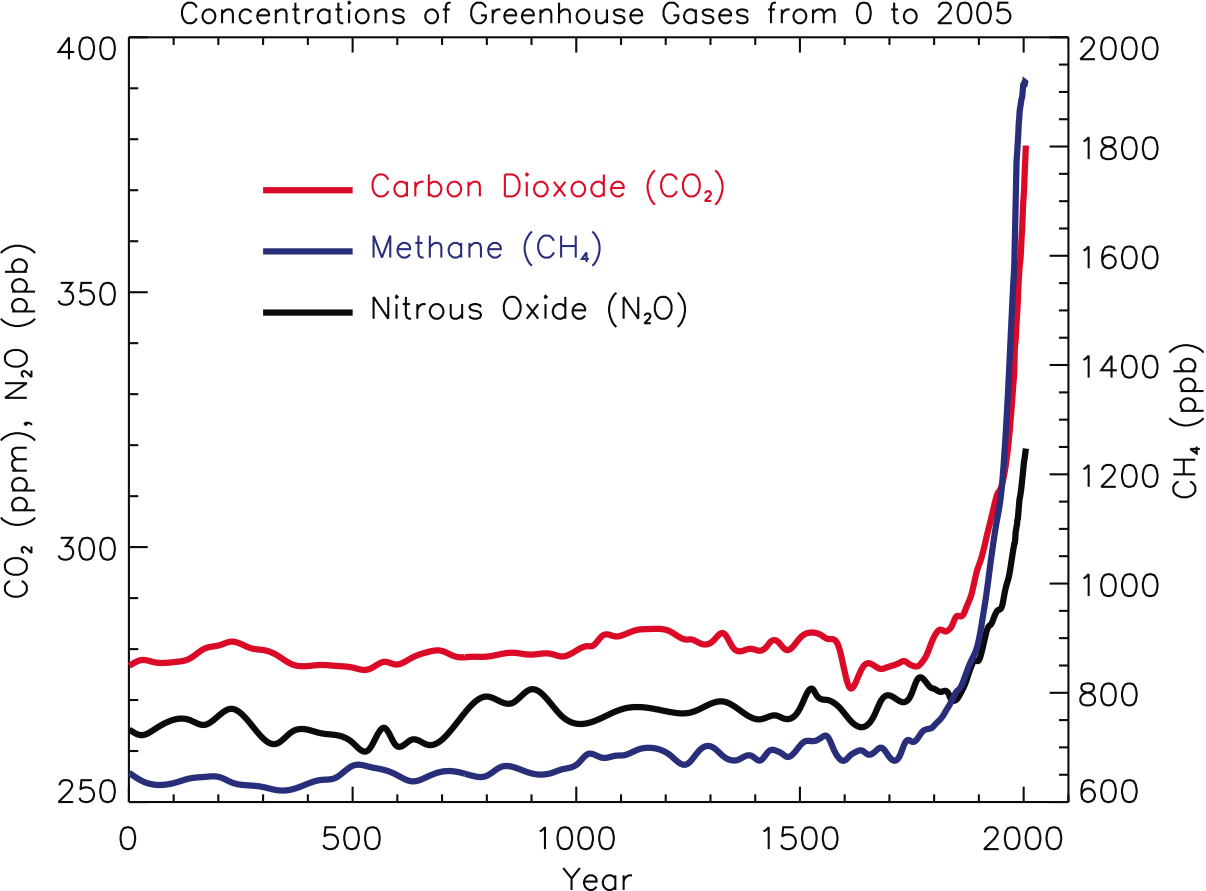
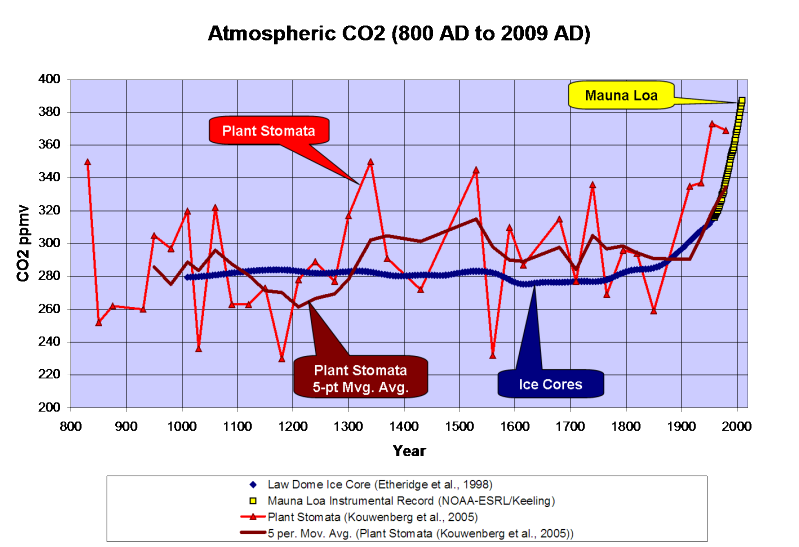
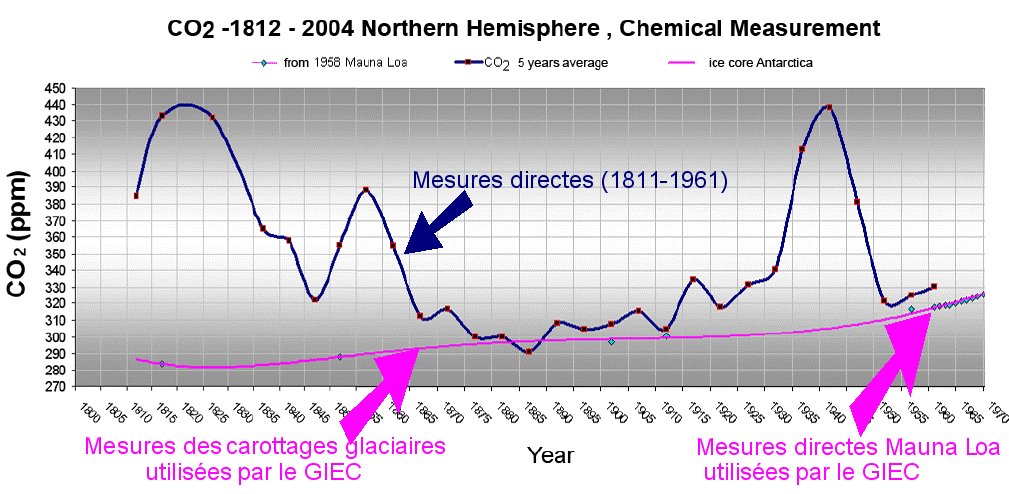
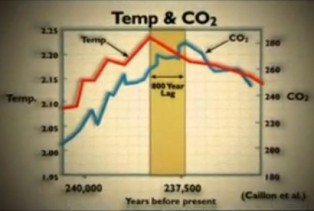
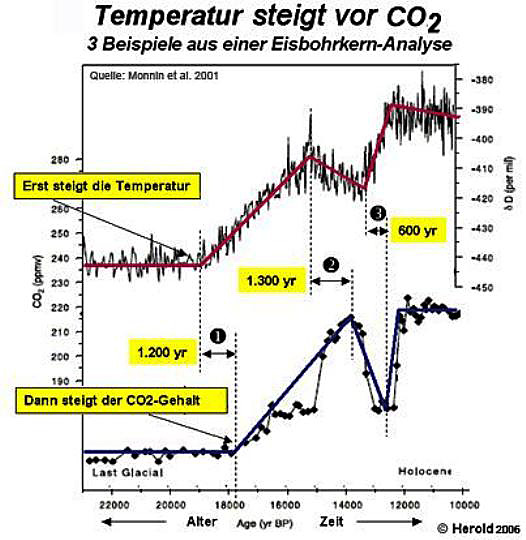
de Der historische CO₂ Gehalt der Atmosphäre en Historical CO₂ concentration fr Concentratiion du CO₂ historique Es ergeben sich überraschende Erkenntnisse Sie zeigen vor allem, dass die Konzentration des CO2 deutlich höher war als 280 ppm, wie es die Proben aus den Eisbohrkernen zeigen und dass die zeitliche Verzögerung zwischen Temperatur- und folgender CO2-Änderung viel geringer als 800 Jahre sein könnte. Sie zeigen aber auch, dass immer erst die Temperatur- und dann die CO2-Änderung erfolgte. |
|
|
de Die Daten aus Pflanzenstomata zeigen eine viel größere Variabilität des atmosphärischen CO₂-Gehaltes über die letzten 1000 Jahre als die Daten aus Eiskernen. Sie zeigen außerdem, dass der Gehalt während des vorigen Jahrtausends oft zwischen 300 und 340 ppmv lag, einschließlich eines Anstiegs um 120 ppmv vom späten 12. Jahrhundert bis zum mittleren 14. Jahrhundert. Die Stomatadaten deuten auch einen höheren CO₂-Gehalt an als die auf dem Mauna Loa gemessenen Werte; jedoch nähern sich beide Werte mit einem gleitenden Mittel über 5 Punkte ganz gut an ... |
en Plant stomata data show much greater variability of atmospheric CO₂ over the last 1,000 years than the ice cores and that CO₂ levels have often been between 300 and 340ppmv over the last millennium, including a 120ppmv rise from the late 12th Century through the mid 14th Century. The stomata data also indicate higher CO2 levels than the Mauna Loa instrumental record. |
|
|
de Eine Überprüfung historischer chemischer Analysen (Beck, 2007) zeigt sogar eine noch größere Variabilität des CO₂-Anteils in der Atmosphäre als die Daten aus den Pflanzenstomata ... en A survey of historical chemical analyses (Beck, 2007) shows even more variability in atmospheric CO2 levels than the plant stomata data since 1800. |
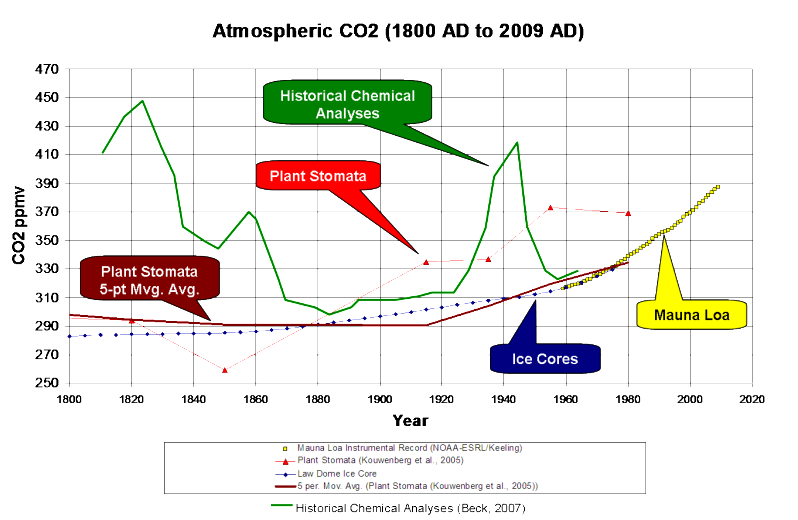
Forschungen der CO2-Konzentrationen in der Vergangenheit
en Research on CO2 concentrations in the past
fr Recherches sur la concentration du CO2 dans le passé
![]()
![]()
![]()
▶Ernst-Georg Beck: Forschungen der CO2-Konzentrationen in der Vergangenheit
|
de Diese Balken zeigen den zusätzlichen Erwärmungseffekt von je 20 ppm mehr CO2 in der Atmosphäre. en This graph shows the additional warming effect of each extra 20 ppm of atmospheric CO2. fr Ce graphique montre l'effet induit par chaque 20 ppm supplémentaires de CO2 sur la température de l'air. |
de Wenn die CO2-Konzentration zunimmt, hat es einen kleineren Erwärmungseffekt en As Carbon Dioxide increases it has less Warming Effect fr Lorsque la concentration du CO2 augmente, son effet de réchauffement diminue de Kohlendioxid absorbiert schon nahezu soviel es kann. Wir zeigen Ihnen, warum eine Verdoppelung von CO2 nicht viel Änderung bewirkt. Der Effekt heute ist vernachlässigbar, er ist nicht messbar. en Carbon dioxide is already absorbing almost all it can. Here's why it's possible that doubling CO2 won't make much difference. And the effect is already so small, it's unmeasurable. fr Le dioxyde de carbone absorbe déjà presque toute l'énergie possible. Voici pourquoi le doublement de la teneur en CO2 ne changera pas grand chose. L'effet est tellement faible qu'il n'est pas mesurable. |
|
|
de Diese Balken zeigen den zusätzlichen Erwärmungseffekt von je 20 ppm mehr CO2 in der Atmosphäre. en This graph shows the additional warming effect of each extra 20 ppm of atmospheric CO2. fr Ce graphique montre l'effet induit par chaque 20 ppm supplémentaires de CO2 sur la température de l'air. |
de
Die natürliche Erwärmung durch CO2 wird
durch die blauen Säulen dargestellt,
Jede Erhöhung des CO2-Niveaus um 20 ppm über
das vorindustrielle Niveau bringt einen Temperaturanstieg von etwa
0,03°C natürliche Erwärmung Um an diese globale Erwärmung zu glauben, ist ein "Sprung in den Glauben" nötig.
en
The natural heating effect of carbon dioxide is the blue bars
Each 20 ppm increment above 280 ppm provides about 0.03° C of
naturally occurring warming This is the leap of faith required to believe in global warming. |


|
|
de
Zuerst steigt die Temperatur und erst nachher steigt das CO₂ Wichtig: Das CO2 kann also nicht der Grund für die Erwärmung sein! en First the temperature rises, CO₂ rises afterwards Important: Therefore CO2 cannot be the cause for global warming! fr D'abord c'est la température qui monte, le CO₂ monte seulement après Important: Le CO2 ne peut donc pas être la cause du rechauffement! |
|
|
Great Global Warming Swindle - Al Gore Excerpt
|
||
|
||
|
|
|
|
|
|
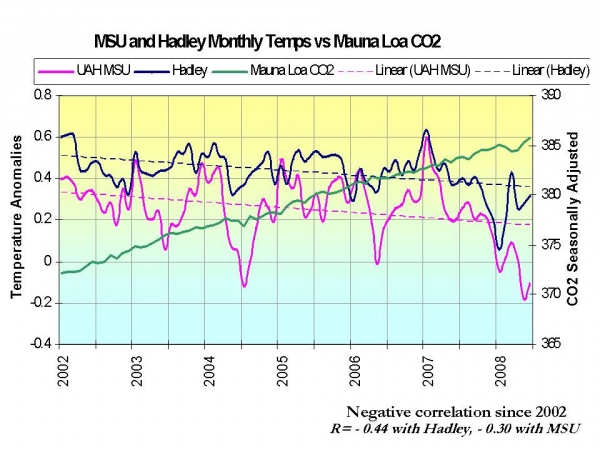
de Das CO2 steigt und die Temperaturen fallen en CO2 is rising and the temperatures are falling fr Le CO2 monte, les températures baissent de Das CO2 steigt, die Temperaturen fallen. Wenn das CO2 die Erwärmung erklärt, muss es auch die Abkühlung erklären ... en CO2 is rising, the temperatures are falling. If the CO2 explains the warming, it must also explain the cooling ... fr Le CO2 monte, les températures baissent. Si le CO2 explique le réchauffement, il doit aussi expliquer le refroidissement ... |
|
Solar Activity Variations |
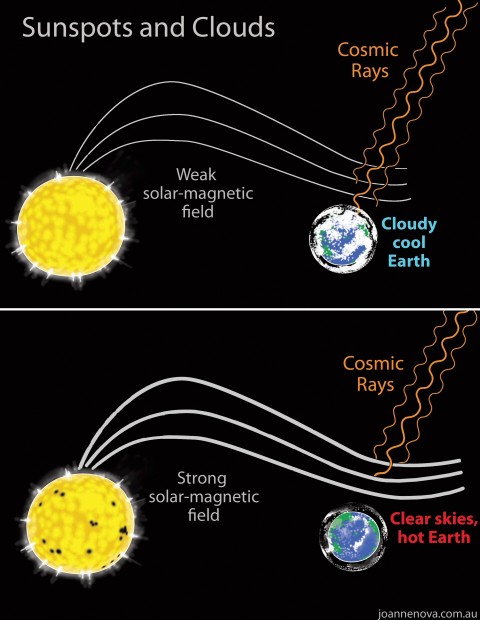
de Sonne, kosmische Strahlung und Wolkenbildung en Sun, Cosmic Rays and Cloud Cover fr Le soleil, les rayons cosmiques et la formation de nuages de Die Sonnenaktivität steuert die Kosmischen Strahlen und dadurch die Wolkenbildung. Mehr Sonnenaktivität → weniger Wolken → es wird wärmer. en The sun is influencing the cosmic rays and therefore the clouds cover. More solar activity → less clouds → warmer Earth. fr Le Soleil influence les rayons cosmiques est par cela les nuages sur la terre. Augmentation de l'activité solaire → moins de nuages → réchauffement de la terre. |
|
|
|
de Mehr Sonnenaktivität → weniger Wolken → es wird wärmer. Bei grosser Sonnenaktivität erreicht weniger Kosmische Strahlung die Erde. Mit weniger Kosmischer Strahlung werden weniger Wolken auf der Erde gebildet. Weniger Wolken lassen mehr Sonnenstrahlung auf die Erde, womit sich die Erde erwärmt. en More solar activity → less clouds → warmer Earth. A stronger wind from greater solar activity will reduce the flux of cosmic ray reaching Earth. Less cosmic rays means less cloud cover on the earth. Less cloud cover influences the terrestrial climate by higher solar radiation. fr Augmentation de l'activité solaire → moins de nuages → réchauffement de la terre. Une augmentation de l'activité solaire a comme effet une réduction du flux de rayons cosmiques atteignant la terre. Moins de rayons cosmiques produisent moins de nuages sur la terre. Moins de nuages laissent plus de rayons solaires réchauffer la terre. |

|
|
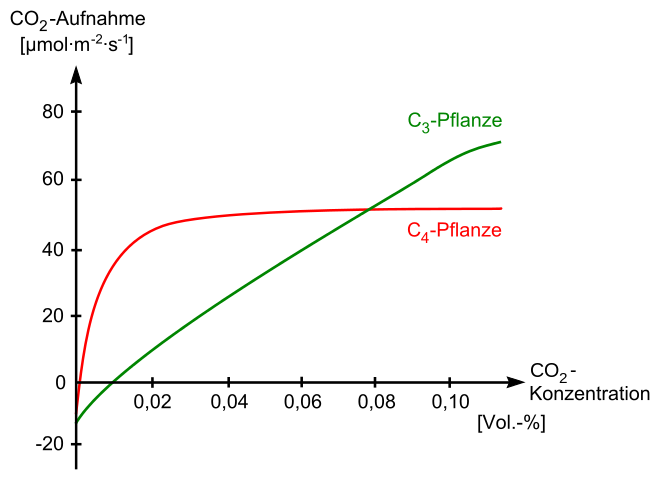
de Auswirkungen der CO2-Konzentration auf das Pflanzenwachstum en Impact of the CO2-Concentration on the plant growth fr Impacte de la concentration du CO2 sur la croissance des plantes
z. B. Bäume und Nutzpflanzen wie: Weizen, Roggen, Reis z. B. Gräser und Nutzpflanzen wie: Mais, Zuckerrohr, Hirse
de Falls der Verbrauch fossiler Treibstoffe nicht närrischerweise limitiert wird im Zuge eines abwegigen Versuches, den Klimawandel zu verhindern - zuvor globale Erwärmung genannt - wird die erwartete Zunahme der CO2-Emissionen in der Atmosphäre die Ernteerträge sowie die Wasser-Effizienz aller in der Welt erzeugten Nahrungsmittel deutlich verbessern. Dies erlaubt es uns die wachsende Weltbevölkerung weiter zu ernähren auch noch weit über das Jahr 2050 hinaus. Dann werden Berechnungen zufolge etwa 9 Milliarden Menschen auf der Erde leben, verglichen mit den heutigen 7,2 Milliarden. en I have found if fossil fuel usage is not foolishly restricted in a misguided attempt to prevent climate change - previously referred to as global warming - the expected increase in anthropogenic CO2 emissions will significantly enhance the yields and water-use efficiencies of essentially all of the world's food crops, allowing us to continue to feed the world's growing population up to and far beyond the year 2050, when it is expected to peak out at approximately nine billion people, compared to today's 7.2 billion. |


|
How not to make a climate photo op |
de Kommentar Pure Panikmache: MIT prognostiziert 7°C Temperaturanstieg bis 2100 "Wenn die Prognose dieser "Wissenschaftler" eines Temperaturanstiegs um 7°C bis 2100 auch mit dieser Methode entstanden ist, wundert mich nichts mehr. Immerhin gestehen diese Alarmisten mit der Einführung des Zufallselements (unbewußt?) zu, daß sie eben keine gesicherte Prognose aufstellen, sondern nur mit unvollständigen Computermodellen herumgespielt haben. Sie haben in Wirklichkeit keine Ahnung, wie sich das Klima künftig entwickeln wird." en Comments received MIT: Global Warming of 7°C 'Could Kill Billions This Century' Global temperatures could rise by more than 7C this century killing billions of people and leaving the world on the brink of total collapse, according to new research". The simple fact is that the source of these dire warnings come from computer "models" written by humans with a vested interest in a warming outcome. |

-
Klagemauer.TV
2016-11-20 de
"Klimawissenschaftler: Klimawandel nicht durch
CO2 verursacht"
Zu Werner Kirstein: "Erdklima vs. Mainstrem-Medien" 2016-06-15
Quelle/Source:
-
Klagemauer TV
2016-11-18 de Klimawissenschaftler: Klimawandel nicht durch CO2 verursacht (Vortrag von Prof. Dr. Werner Kirstein)Vom 7. November bis zum 18. November 2016 findet die 22. UN-Klimakonferenz in Marrakesch, in Marokko, mit 195 Mitgliedsstaaten, statt.
Schwerpunktmäßig wird wieder diskutiert, wie man die beschlossene Begrenzung der Erderwärmung auf zwei Grad innerhalb dieses Jahrhunderts umsetzen kann.
Dazu legte Petteri Taalas, Generalsekretär der Weltorganisation für Meteorologie WMO, einer Sonderorganisation der Vereinten Nationen, die aktuellen Daten vor.
Er zeigte auf, dass im Schnitt die Temperaturen im Jahr 2016 1,2 Grad über dem Niveau vor dem Industriezeitalter liegen.
Das sei laut Herrn Taalas auch der Grund für mehr Wetterkatastrophen und - als unmittelbare Folge davon - für wirtschaftliche Einbußen größeren Ausmaßes.
Ursache seien die klimaschädlichen Treibhausgase.
1988 wurde der Weltklimarat IPCC von der UN ins Leben gerufen,
mit dem klaren Auftrag zu beweisen, dass ein Klimawandel vorliege,
und dieser menschengemacht sei.
Mit speziell geschriebenen Computerprogrammen sollte nachgewiesen werden, dass die Welt durch eine steigende Erderwärmung in einer Klimakatastrophe enden würde.
Hauptverursacher sei das angeblich umweltschädliche CO2, wie von Politikern und Hauptmedien seit Jahrzehnten gebetsmühlenartig vermittelt wird.
Eine Vielzahl namhafter Wissenschaftler weist Manipulationen in den Messungen und Auswertungen nach, und sieht für den Klimawandel aber ganz andere Ursachen und Zusammenhänge.
Prof. Dr. Werner Kirstein, ein erfahrener Klimatologe, ist eine dieser Gegenstimmen.
In seinem Vortrag "Erdklima versus Mainstream-Medien", den wir gleich im Anschluss zeigen, erklärt er fundiert und sehr anschaulich die Zusammenhänge von Erdklima, Klimaerwärmung und CO2 aus einer ganz anderen Sichtweise.
Die propagandamäßige Arbeitsweise der offensichtlich gleichgeschalteten Medien wird in diesem Vortrag ebenfalls beleuchtet.
Schauen Sie nun den Vortrag und bilden Sie sich Ihre eigene Meinung.
-
Prof. Dr. Werner Kirstein
2018-08-06 de
Klimatologe sagt Claus Kleber die Meinung
Der Klimatologe und Physiker Prof. Dr. Werner Kirstein richtete am 04.08.2018 eine Mail an Claus Kleber vom 'heute-journal' im Zweiten, bzgl. des Beitrages
"Trockener Sommer: Woher kommt die Hitze?"
in der heute-journal-Sendung vom 03.08.2018.
Hier nach besagtem Beitrag aus der Sendung, verlesen.
Sehr aufschlussreich.
Quelle/Source:
-
EIKE Europäisches Institut für Klima und Energie
2018-08-07 de Dr. Claus Kleber (ZDF heute Journal 3.8.18): ".. sich die Atmophäre 'grundstürzend' ändert!"Am 3.8.18 brachte das ZDF im heute Journal angekündigt von seinem Moderator, dem bekannten Klimakatastrophenprediger und Sachbuchautor in nämlicher Sache, Dr. Claus Kleber einen Beitrag zur Hitzeperiode dieses Sommers.
Der Physiker und Klimatologe Prof. Dr. Werner Kirstein fühlte sich bemüßigt, diese permanent wiederholte Klimaktastrophenmeldung, diesmal
sogar als mögliche "grundstürzenden" Änderung der Atmosphäre angekündigt
zu widerlegen mehr Objektivität und Sachlichkeit anzumahnen. Wohl wissend, dass diese beiden Begriffe für das ZDF und Claus Kleber lästige Fremdworte sind.
Schauen und lesen Sie selbst
| ZDF |
Zweites Deutsches Fernsehen
▶ZDF: Who is who (Medien der Globalen Erwärmung) |
| Werner Kirstein |
Prof. Dr.
▶Werner Kirstein: Who is who (Skeptiker) ▶Werner Kirstein: Video (Präsentationen) ▶Ausschluss und Maulkorb für Kritiker (Uni Leipzig (Dekan Prof. Dr. Haase) ⬌ Prof. Dr. W. Kirstein) |
| de | en | fr |
|---|---|---|
|
Klima: Wandel Ursachen des Klimawandels |
Climate: Change Causes of Climate Change |
Climat: Changement Les causes du changement climatique |
|
Einflüsse auf das Klima Temperatur der Erde Klima-Beobachtungen Neuste Meldungen zum Klimawandel |
Impacts on Climate Change Earth Temperature Climate Observations News on Climate Change |
Impacts sur le climat Température de la terre Observations sur le climat Dernières nouvelles sur le changement climatique |
↑ e Wisnewski: Die Klima-Religion
-
Gerhard Wisnewski
2016-03-05 de
Die Klima Religion (Die Klima Lüge)
| de | en | fr |
|---|---|---|
|
Klimawandel: Probleme Glaube und Hysterie (Teile I-III) |
Climate change: Problems Climate Hysteria (Parts I-III) |
Climat: Problèmes Hystérie sur le climat (parties I-III) |
↑ f 9 Fragen zum Klimaschutz
-
EIKE Europäisches Institut für Klima und Energie
Prof. Dr. Horst-Joachim Ludecke, Prof. Dr. Carl-Otto Weiss, Prof. Dr. Friedrich Karl Ewert
2015-12-01 de Neun Fragen zum Klimaschutz
Allgemeines
"Klimaschutz" ist ein neuer deutscher Glaubenskanon, dem sich inzwischen auch die Kirchen angeschlossen haben.
Die Medien und fast alle politischen Parteien erklären "Klimaschutz" zur Staatsraison.
Diese Entwicklung hat Konsequenzen: Die deutsche Energiewende, begrundet mit Klimaschutz, zerstört durch Windräder und endlose Energiemaisfelder unsere Natur und beschert uns die höchsten Strompreise Europas.
Ökoideologie in Medien, Erziehung, Technik, Wissenschaft und Wirtschaft spaltet die Gesellschaft, wie es der zunehmende Widerstand der betroffenen Bevölkerung gegen Windräder als "Kathedralen" des neuen Glaubens zeigt.
Angesichts dieser Vorgänge werden Fragen und Antworten zu Sinn, Nutzen und Zweck des Klimaglaubens unvermeidbar.
Leitlinien sind dabei die Aufklärung und folgende naturwissenschaftlichen Fakten:
-
Beträchtliche Klimaänderungen sind stete Begleiter der Erdgeschichte.
Konstantes Klima gab es noch nie.
Etwas sich permanent Änderndes kann nicht geschützt werden.
-
Seit Beginn der Industrialisierung bis zum Jahre 1998 ist es insgesamt um weniger als 1°C wärmer geworden,
und seit 1998 stagniert die Erdtemperatur.
Ein ursächlicher Zusammenhang von Erdtemperaturen mit anthropogenem CO2 ist bis heute nicht nachweisbar, selbst eine statistische Korrelation fehlt.
CO2 ist unbestritten das zweitstärkste Treibhausgas nach dem Wasserdampf.
Ob aber menschgemachtes CO2 einen Klimaeinfluss ausübt, konnte bis heute keine wissenschaftliche Fachpublikation belegen.
-
Kein Klimamodell hat die aktuelle globale Temperaturstagnation vorhergesagt, die schon 17 Jahre anhält.
Stattdessen werden ständig neue Erwärmungswerte prognostiziert.
-
Es gibt nach 150 Jahren geringer Erwärmung keine über das natärliche Auftreten hinausgehenden Häufigkeiten oder Stärken von Stürmen, Hurrikanen, Tornados, Extremniederschlägen, Dürren, Gletscherschmelzen, Meeresspiegelanstiegen,...
Genau dies sagt auch der Report AR5 2013/2014 des Intergovernmental Panel on Climate Change (IPCC).
-
"Klima" ist von Natur aus ein hochdynamischer Prozess und mit keinem Mittel stabil zu halten.
"Klimaschutz" vermittelt eine Illusion und ist nur ein politisches Konstrukt.
Dazu sagt Prof. Heinz Miller, Vize-Direktor des Alfred-Wegener Instituts (AWI) in Bremerhafen:
"Wer von Klimaschutz redet, weckt Illusionen.
Klima lässt sich nicht schutzen und auf einer Wunschtemperatur stabilisieren.
Es hat sich auch ohne Einwirkungen des Menschen oft drastisch verändert.
Schlagworte wie "Klimakollaps" oder "Klimakatastrophe" sind irrefuhrend.
Klima kann nicht kollabieren, die Natur kennt keine Katastrophen"
-
"Klimaschutz" ist das Gegenteil von Naturschutz.
Dies zeigen bereits die sich stetig ausbreitenden Windradungetume von heute 200 m Höhe, welche Landschaften zerstören, Flugtiere töten und Menschen durch Infraschall gesundheitlich schädigen.
Frage 1: Was ist Klima, was "Klimaschutz"?
Klima ist nicht mit Wetter zu verwechseln.
Es ist das mindestens 30-jährige statistische Mittel von Wetterparametern wie Temperaturen, Niederschlägen, Anzahl von Extremwetterereignissen u.w.m.
Es gibt kein "Klima" schlechthin und auch kein Globalklima, nur Klimazonen von polar bis tropisch.
Wie das Wetter wandelt sich auch das Klima jeder Erdklimazone naturgesetzlich unaufhörlich und kann infolgedessen nicht geschützt werden.
Man müsste dazu mit dem Schutz des Wetters beginnen. Der Begriff "Klimaschutz" kann daher nur als Mittel der politischen Agitation angesehen werden.
Ohne ständigen Klimawandel hätte es kein Leben auf der Erde gegeben, er war ein wichtiger Faktor der biologischen Evolution.
Klimawandel kann für die Menschen gleichermaßen schädlich oder günstig sein, wie es die Klimavergangenheit belegt (s. Frage 3).
Die im historischen Klimavergleich moderate globale Erwärmung des 20. Jahrhunderts war für die Menschheit vorteilhaft und keineswegs schädlich.
Frage 2: Was ist "anthropogene globale Erwärmung"?
Anthropogene globale Erwärmung ist ein theoretisch vermuteter, bis heute nicht nachweisbarer Erwärmungseffekt infolge von CO2-Emissionen aus Elektrizitäts- und Wärmeerzeugung, Industrie, Transport, Landwirtschaft, Zementherstellung u.w.m.
Die Konzentration des Treibhausgases CO2 in der Erdatmosphäre hat sich seit Beginn der Industrialisierung (~) von 0,028% auf heute 0,04% erhöht, das sind 12 Moleküle mehr in 100.000 Luftmolekülen über grob 150 Jahre.
Der hypothetische Erwärmungseffekt wird als AGW (Anthropogenic Global Warming) bezeichnet.
Seine Nichtnachweisbarkeit beruht auf seiner zu geringen Stärke, natürliche Temperaturfluktuationen überdecken ihn.
Weil Medien und Politik immer wieder sachlich falsch behaupten, die AGW sei gefährlich hoch und würde sogar das "Klima" schädigen, muss betont werden, dass es bis heute keine begutachtete Klima-Fachpublikation gibt, die AGW an Hand von Messwerten nachweist.
Alle entsprechenden Behauptungen basieren auf Klimamodellen, die willkürliche, das Ergebnis bereits bestimmende Annahmen enthalten.
Eine Modellbildung von Klima als einem Geschehen mit buchstäblich unzähligen (meist unbekannten) maßgebenden Einflussgrößen ist vermutlich für immer unmöglich.
Entscheidender Begriff der AGW ist die Klimasensitivität des CO2 als die globale Erwärmung infolge einer hypothetischen Verdoppelung der atmosphärischen CO2-Konzentration.
Sie ist mit extrem hohen Unsicherheiten belegt und praktisch unbekannt.
Alle politischen Maßnahmen, die eine gefährliche globale Erwärmung voraussetzen, beruhen somit auf einem unbekannten Zahlenwert.
de en fr Klimawandel: Wissenschaft
Der CO2-TreibhauseffektClimate change: Science
The CO2 Greenhouse EffectChangement climatique: Science
L'éffet de serre du CO2Einleitung Introduction Introduction Die Klimasensitivität von CO₂ Climate sensitivity of CO₂ La sensibilité climatique du CO₂ Die CO₂-Sättigung:
Wenn die CO₂-Konzentration zunimmt, ist die Erwärmung wegen der Sättigung kleinerThe CO₂ Saturation:
As Carbon Dioxide increases it has less Warming EffectLa saturation du CO₂:
Lorsque la concentration du CO₂ augmente, son effet de réchauffement diminueDer Streit um die Rückkopplungen The argument about the feedbacks L'argument des rétroactions Der fehlende Hotspot (warme Zone) The missing Hotspot Le 'hotspot' (point chaud) manque ERBE Earth Radiation Budget Experiment ERBE Earth Radiation Budget Experiment ERBE Earth Radiation Budget Experiment Bei Frage 4 steht:
Der Zahlenwert der bereits erwähnten Klimasensitivität des CO2 ist nicht direkt messbar.
Er kann nur aus theoretischen Rechnungen im Bereich zwischen 0,5 °C bis etwa 1,2 °C angegeben werden.
Werte bis 2 °C werden als unbedenklich angesehen.
Nur Klimamodelle mit dem hypothetischen Konstrukt der Wasserdampfrückkoppelung können Werte über 4 °C hinaus begründen.
Dieses Konstrukt ist in der Klima-Natur nicht nachweisbar.
Frage 3: Ist das heutige "Klima" extrem?
Zur Antwort muss man das Klima vor Beginn der Industrialisierung (~1850) mit dem Klima danach vergleichen.
Nur falls nach ~1850 die Zahl von Extremwetterereignisse angestiegen wäre, Gletscherschmelzen nie zuvor bekannte Ausmaße erreicht hätten und ungewöhnliche Temperatursteigerungen aufgetreten wären, könnte der Mensch als Ursache vermutet werden, wobei aber immer auch naturliche Ursachen in Frage kämen.
Die Antworten aus Fachliteratur, meteorologischen Messungen der weltweiten Messtationen und sogar vom IPCC auf diese Fragen liegen freilich bereits vor:
Es gibt keine Art von Klimaereignissen nach ~1850, die nicht mehrfach in mindestens gleicher, oft aber größerer Stärke und Geschwindigkeit vor ~1850 auftraten.
Unsere Klimavergangenheit bietet bekannte Beispiele:
• So konnten die Römer bei viel wärmeren Klima als heute ganz Europa sandalenbeschuht erobern.
In ihrer reichen Militärliteratur findet sich anlässlich unzähliger Alpenüberquerungen keine Erwähnung von Gletschern.
• Die folgende Klimaverschlechterung führte zu Völkerwanderungen und dem Untergang Roms.
• Um etwa 1100 n.Chr. waren in den heißen Sommern der mittelalterlichen Warmzeit die großen deutschen Flusse fast vollständig ausgetrocknet.
Deshalb konnte das Fundament der berühmten Regensburger Steinbrücke in der trockenen Donau gebaut werden, und zu Köln am Rhein überquerten die Leute den Fluss trockenen Fußes.
• In der sogenannten "kleinen Eiszeit" um Mitte bis Ende des 17. Jahrhunderts war die Ostsee regelmäßig über viele Monate komplett zugefroren, schwedische Truppen überquerten sie mehrfach mit schweren Planwagen und Kanonen.
Grönland (grünes Land) war vor 8000 Jahren 2,5 °C wärmer als heute, ohne dass der Grönlandgletscher kollabierte oder "Knuth" ausstarb.
Den Menschen haben Klimaänderungen stets bei Klimaabküuhlung in Form von Missernten und Hungersnöten zugesetzt.
Warmzeiten waren dagegen regelmäßig Auslöser kultureller Höhepunkte.
de en fr Klima Wandel
Klima GeschichteClimate Change
Climate HistoryClimat Changement
Histoire du climatFrage 4: Gibt es eine menschgemachte Klimagefahr?
Der Zahlenwert der bereits erwähnten Klimasensitivität des CO2 ist nicht direkt messbar.
Er kann nur aus theoretischen Rechnungen im Bereich zwischen 0,5 °C bis etwa 1,2 °C angegeben werden.
Werte bis 2 °C werden als unbedenklich angesehen.
Nur Klimamodelle mit dem hypothetischen Konstrukt der Wasserdampfrückkoppelung können Werte über 4 °C hinaus begründen.
Dieses Konstrukt ist in der Klima-Natur nicht nachweisbar.
Darüber hinaus treffen die Modellierer auf eine bemerkenswerte Lösungsmannigfaltigkeit bei solchen Modellen und sind nicht in der Lage, alle diese Lösungen physikalisch zu verstehen.
Die ab den 1970-er Jahren eingesetzten Klimamodelle, zweifellos wertvolle Forschungsinstrumente für Detailfragen, konnten noch nie zuverlässige Globalaussagen machen.
Diese nicht behebbaren Nachteile teilen Klimamodelle mit den ihnen verwandten Wettermodellen.
Bekanntlich ist eine verlässliche Wettervorhersage über einige Tage bis maximal 2 Wochen hinaus grundsätzlich unmöglich.
Auch die modernsten Klimamodelle versagen bereits bei der Erklärung der Klimavergangenheit, können nicht einmal den nächsten El Niño berechnen und fordern eine Erwärmung in mehreren km Höhe über den Tropen (Hot Spot), die bis heute nicht messbar ist.
Die Prophezeiung des bekanntesten deutschen Klimamodellieres Prof. M. Latif vom Jahre 2000, es wurde in Deutschland des anthropogenen CO2 wegen keine Winter mit Schnee mehr geben, ist vielen von uns noch eine Warnung vor Klimamodellvorhersagen.
Für Klimamodelle gilt die Richard Feynman, einem der bedeutendsten Physiker des 20. Jh. zugeschriebene sinngemäße Feststellung über physikalische Modelle bzw. Theorien:
"Egal, wie bedeutend der Mensch ist, der ein theoretisches Modell vorstellt, egal, wie elegant es ist, egal wie plausibel es klingt, egal wer es unterstützt,
wenn es nicht durch Beobachtungen und Messungen bestätigt wird, dann ist es falsch".
Unter diesem Kriterium eindeutig falsche Modelle prägen die politische Klimaschutz-Agenda der EU und insbesondere Deutschlands.
Gemäß dem heutigen wissenschaftlichen Stand ist zu konstatieren, dass eine menschgemachte Klimagefahr nicht nachweisbar ist.
Frage 5: Gibt es einen wissenschaftlichen Klima-Konsens?
Nein!
Unzählige Klimaforscher und fachnahe Naturwissenschaftler, darunter auch die beiden ehemaligen Physik-Nobelpreisträger Robert Laughlin und Ivar Giaever, kritisieren öffentlich die Hypothese von einer Klimaschädigung durch den Menschen.
Dies belegt, dass diese Hypothese wissenschaftlich zumindest umstritten ist.
Darüber wurde in den deutschen Medien noch nie berichtet.
Seit Beginn der Klimaschutz-Bewegung gab es unzählige entsprechende Deklarationen und Petitionen, die niemals bei Politik oder Medien Erwähnung oder gar Gehör fanden.
de en fr Klimawandel: Beurteilung
Manifeste, Petitionen und Koalitionen gegen die offizielle KlimapolitikClimate change: Evaluation
Manifestos, Petitions and Coalitions against the official climate policyClimat: Évaluation
Manifestations, pétitions et coalitions contre la politique officielle sur le climatFrage 6: Ist CO2 (Kohlendioxid) schädlich?
Atmosphärisches CO2 von heute 0,04% Konzentration (und damit nur ein Spurengas der Atmosphäre) ist Hauptbestandteil der Photosynthese und für die Existenz von Pflanzen, Tieren und Menschen unabdingbar.
Ohne CO2 gäbe es uns nicht.
Der vom industrialisierten Menschen verursachte Anstieg von 0,028% im Jahre 1850 auf den heutigen Wert hat den globalen Pflanzenwuchs gefördert und die Nahrungsernten weltweit verbessert.
Tritt es bei extrem hoher Konzentration wie z.B. bei Vulkaneruptionen in großen Mengen aus, ist es tödlich erstickend, denn CO2 ist schwerer als Luft und verdrängt den zum atmen nötigen Sauerstoff.
Das CO2 in unserer Atmosphäre ist allerdings infolge seiner extrem geringen Konzentration bis weit uber 15 km Höhe homogen verteilt und sammelt sich nicht am Boden an.
Der weitere Anstieg von CO2 in der Atmosphäre ist auf Grund endlicher Reserven an Kohle begrenzt.
So gibt die Bundesanstalt für Geowissenschaften und Rohstoffe die weltweiten Kohlereserven mit 1300 GtC an.
Der CO2-Gehalt der Luft kann daher somit auch bei Verbrennen aller fossiler Reserven höchstens auf 0,06% bis 0,08% ansteigen.
Frage 7: Wie relevant ist deutsche CO2-Vermeidung global?
Die CO2-Emissionen von Deutschland haben einen globalen Anteil von ~2%.
Einsparungen von diesen 2% sind dann praktisch ein Nichts.
Eine simple Dreisatzrechnung zeigt die globale Wirkung Deutschlands, falls gemäß Sigmar Gabriel unsere Kohlekraftwerke zukünftig jährlich 3,7 Millionen Tonnen CO2 weniger ausstoßen.
Diese Einsparung verringert den aktuellen jährlichen globalen CO2-Ausstoß von 34 Milliarden Tonnen, der 2 ppm atmosphärisches CO2 mehr bewirkt, um den Anteil 0,0001 also um 0,0002 ppm.
Das IPCC gibt für 400 ppm mehr CO2 (fiktiv hohe) 3 °C zusätzliche globale Erwärmung an, so dass Gabriels Plan gemäß IPCC
zu einer um 0,0000015 °C geringeren globalen Erwärmung führt.
Den CO2-Hauptverursachern Indien und China ist freilich die Hype der deutschen CO2-Vermeidung fremd.
Kohleverbrennung ist für sie überlebenswichtig, und sie gaben daher dem Klimaschutzdruck des Westens noch nie nach.
Aber auch Australien scheint noch den Dreisatz zu beherrschen, denn hier ist bei voll laufenden Kohlekraftwerken "Klimaschutz" de facto abgesagt.
 Fossil-Fuel CO2 Emissions by Nation
Frage 8: Wer profitiert vom Klimaschutz?
Durch ökoideologische Netzwerke, mithelfende Gesetzgebung und Mittelumverteilung entstand in Deutschland ein öko-industrieller Komplex, der mit den Regeln des freien Markts unvereinbar ist.
Die Energiewende wird mit der unabdingbaren Notwendigkeit von "Klimaschutz" begründet.
Sie hat Kohorten von Profiteuren wie Pilze aus dem Boden schießen lassen, von der Windradindustrie über Ökoberatungsunternehmen für Kommunen, private Subventionsprofiteure von Solardachstrom bis hin zu EmissionsZertifikate-Betrügern und nicht zuletzt dem deutschen Fiskus mit seiner CO2-Besteuerung (Besteuerung der Luft).
Politik und Wendeprofiteure schufen eine kaum noch auflösbare Verfilzung gegenseitiger Abhängigkeiten.
Das Bundnis 90/Die Grünen brauchen die Fiktionen "Klimaschutz" und das Angstgespenst der Kernenergie unabdingbar zum überleben.
Profitierende Advokaten-Klimaforscher missbrauchen unter Verletzung ihres Amtseids und von der Politik mit Wohlwollen gefördert ihre beamteten Positionen zur Verbreitung totalitärer Okoideologien.
Ihre an Zahl weit überwiegenden integeren Kollegen ducken sich weg, um keinen beruflichen Schaden zu erleiden.
"Klimaschutz" und Energiewende werden infolgedessen wohl erst dann beerdigt werden, wenn der stetig ansteigende volkswirtschaftliche Schaden auch vom Wahlbürger in seinem vollen Umfang erkannt wird.
Schlussendlich sind noch die ganz großen, global agierenden Profiteure zu nennen, welche "Klimaschutz" durch hohe finanzielle Unterstutzung vorantrieben, um ihn später in lukrativen Geschäftsmodellen zu nutzen - stellvertretend die US-Großfinanz mit zugehörigen Banken und Versicherungsgesellschaften.
Frage 9: Welches sind die Ursprunge des Klimaglaubens?
Die ab Mitte des 20. Jahrhunderts aufkommenden Umweltbewegungen sowie die Berichte des Club of Rome (1972, 1974) verstärkten massive Angste, wie sie bereits Thomas Robert Malthus (1766-1834) anfachte.
Die exponentielle Zunahme der Weltbevölkerung wurde zwangsläufig zur katastrophalen Nahrungs- und Ressourcenknappheit führen.
All dies hat sich bis heute als falsch erwiesen, selbst die Anzahl der Weltbevölkerung zeigt erste Anzeichen eines zukunftigen Stillstands.
Ressourcen sind keine Mengen sondern die technische Innovationsfähigkeit der Menschheit, die bisher jedes Ressourcenproblem durch neue Technologien lösen konnte.
Als die Ressourcen-Bedrohung durch die Entdeckung und Erschließung immer neue Lagerstätten von Erdöl, Gas und Kohle ins Abseits geriet, wurde die menschgemachte Klimaschädigung zur neuen Weltbedrohung, nun mit den deutschen Medien als lautesten Verkündern.
Insbesondere das deutsche Gutmenschentum kümmert sich nun um ein vermutetes zukunftiges Problem mit technischen Lösungen von gestern und erträumten Erfindungen von übermorgen.
TV-Bilder aus aller Welt zeigen heute in Echtzeit die entferntesten Zyklone, Überschwemmungen und Dürren.
Diese natürlichen Ereignisse, die in vorindustrieller Zeit oft häufiger und stärker auftraten, werden dem ahnungslosen Zuschauer als AGW-Folgen untergeschoben.
Mit TV-Bildern von kondensiertem Wasserdampf aus Kraftwerkskühltürmen wird wird in Verfälschung der Fakten das in Wirklichkeit unsichtbare CO2 suggeriert und schließlich als "Klimakiller" verteufelt.
Der Klimaschutz-Glaube fordert eine übergeordnete Institution als Weltregierung, also totalitäre Planwirtschaft.
Schon Albert Camus erkannte den Totalitarismus als "Politik der Massenmobilisierung für unerreichbare Ziele".
Klimaschutz ist das ideale unerreichbare Ziel!
Die aktuell Kanzlerin A. Merkel als Vorsitzende einer ehemals freien, wertekonservativen Partei folgt mit ihrer Aussage
"Die globale Erwärmung ist die größte Herausforderung des 20. Jahrhunderts"
dem Totalitarismus, denn sie widerspricht damit den Klimafakten und propagiert die Bemühung um ein unerreichbares Ziel.
Die Verspargelung unserer Landschaften mit Windrädern belegt blinden Klimaschutzglauben, denn Windräder sparen praktisch kein CO2 ein.
Mit ihrer Verbreitung haben sich die CO2-Emissionen Deutschlands sogar erhöht,
Windradstrom ist um ein Vielfaches teuer als Strom aus Kohle, Uran, Gas.
Der Windstromfluktuation wegen sind kostspielige Gaskraftwerke zum Fluktuationsausgleich erforderlich.
Nur der Bruchteil von aktuell ~17% der installierten Windstromleistung steht zur Verfügung, weil der Wind meist zu schwach oder gar nicht bläst.
Windradanrainer werden durch die dramatischen Wertverluste ihrer Häuser zwangsenteignet und durch Infraschall gesundheitlich geschädigt.
Windräder töten Fledermäuse und Greifvögel zu Hekatomben.
All dies ist bestens bekannt, und dennoch werden Windräder von fast allen deutschen Volksvertretern in blinder Gläubigkeit über ihre Klimaschutzwirkung dieser Anlagen begrüßt und propagiert.
Blinder Glaube und Rückwärtsgewandheit greifen aber nicht nur hier.
Statt in attraktive Zukunftsfelder zu investieren, werden heute schon ganze Bereiche von der Gentechnik bis zur Kernenergie einfach ausgeblendet, so als würden sie gar nicht existieren.
Unsere Kinder und Enkel werden die Leidtragenden des neuen Ökoglaubens sein.
Der Beginn eines europaweiten Ökototalitarismus ist an der 20%-Agenda der EU ablesbar, welche gesetzlich erzwingt, dass bis 2020 alle Industrieunternehmen der EU ihren Energieverbrauch um 20% einschränken müssen.
Verbraucher erkennen es inzwischen an nicht mehr erhältlichen Glühlampen, Staubsaugern usw.
Für Industrie, Arbeitsplätze und unseren Wohlstand sind die EU-20%-Agenda und ihre kommenden Steigerungen buchstäblich tödlich.
Kaufmännisch sinnvolle Energieeinsparung könnten ebenso gut durch Steueranreize unter Beibehaltung des freien Marktes und der Eigenentscheidung des Burgers erreicht werden.
Die EU und die deutsche Regierung wollen aber den Planungsstaat.
Dazu kommt die Unverfrorenheit, den uneingeschränkt notwendigen Naturschutz mit Klimaschutz gleichzusetzen.
Allein Windräder zeigen es bereits: Klimaschutz ist das genaue Gegenteil von Naturschutz.
Bereits Kinder werden in Deutschland zu Ökobotschaftern" erzogen.
Die Botschaft der Plant-for-the-planet Organisation, Kinder sollen Bäume pflanzen, ist zweifellos begrußenswert, falls es denn beim B äumepflanzen bliebe.
Schließlich wollen wir alle Naturschutz.
Sie ist aber keineswegs harmlos, weil diese Organisation weiter schreibt:
"Bei einer Plant-for-the-Planet Akademie wirst du selbst zum Botschafter für Klimagerechtigkeit.
Hier erfährst du alles Wichtige zum Thema Klimakrise und globale Gerechtigkeit.
Und du lernst, selber Vorträge zu halten und Pflanzpartys zu organisieren".
Diese missbräuchliche Instrumentalisierung jugendlicher Naturbegeisterung für ökoideologische Zwecke unterscheidet sich nicht mehr von der politischen Indoktrinierung Jugendlicher in den zwei überwundenen Diktaturen.
Man tausche lediglich "Klimagerechtigkeit" gegen "den neuen Menschen in der DDR" aus.
Fazit
Die Klimaschutzbewegung widerspricht den naturwissenschaftlichen Fakten.
Von wissenschaftlichem Konsens über eine angebliche Klimagefährlichkeit des anthropogenen CO2 kann keine Rede sein.
Bevor nicht ein sachfundierter Nachweis über den Einfluss des anthropogenen CO2 auf Klimaparameter erbracht werden kann, gebietet alle Vernunft, die kostspieligen CO2-Vermeidungsmaßnahmen einzustellen.
Die militanten Vertreter von Klimaschutzmaßnahmen streben eine planwirtschaftlich-totalitäre Politik an, wie beispielsweise eine "große Transformation".
Seine politischen Bestrebungen, Agenden und Auswirkungen verweisen "Klimaschutz" in die Reihe totalitärer Ideologien.
-
↑
g Wieviel Klimawandel macht der Mensch? -
Eine kritische Überprüfung der IPCC-Thesen
-
AfD-Fraktion Bundestag
Dr. Sebastian Lüning, Autor von "Die kalte Sonne"
2019-01-29 de
Wieviel Klimawandel macht der Mensch? -
Eine kritische Überprüfung der IPCC-Thesen
Vortrag von Dr. Sebastian Lüning
Klimamodelle scheitern dabei, die enorme vorindustrielle Klimadynamik abzubilden.
In den Simulationen scheinen wichtige Klimaeinflussfaktoren zu fehlen.
Sehen Sie dazu einen Vortrag unseres Gastredners Dr. Sebastian Lüning, Autor von "Die kalte Sonne".
-
Deutscher Bundestag
Ausschuss für Umwelt, Naturschutz und nukleare Sicherheit
2019-04-03 de Öffentliches Fachgespräch zu dem Thema "CO2-Bepreisung"
-
Deutscher Bundestag
Ausschussdrucksache
Dr. habil. Sebastian Lüning, Geowissenschaftler
2019-04-03 de Stellungnahme zum öffentlichen Fachgespräch mit dem Thema "CO2-Bepreisung" des Ausschusses für Umwelt, Naturschutz und nukleare Sicherheit im Deutschen Bundestag am 3. April 2019, Berlin
Audioausschnitt:
Das passiert mit Kritikern des IPCC
- Augusto Mangini, Universität Heidelberg, Institut für Umweltphysik
- Bundesanstalt für Geowissenschaften und Rohstoffe (BGR)
↑ h Consensus? 200+ New 2019 Papers Support A Skeptical Position On Climate Alarmism
-
NoTricksZone (Pierre L. Gosselin)
2019-06-17 en Consensus? 200+ New 2019 Papers Support A Skeptical Position On Climate AlarmismIn the first 5½ months of 2019, over 200 scientific papers have been published
that cast doubt on the position that anthropogenic CO2 emissions function as the climate's fundamental control knob
or that otherwise serve to question the efficacy of climate models
or the related "consensus" positions commonly endorsed by policymakers and mainstream media sources.
|
|
Skeptic Papers 2019 (1) A Warmer Past: Non-Hockey Stick Reconstructions Skeptic Papers 2019 (2) Skeptic Papers 2019 (3) |

⇧
2 Der offizielle Treibhauseffekt
en The official Greenhouse Effect
fr L'effet de serre officielle
↑ de Der Treibhauseffekt
de Aus der Panik-Küche en From the panic laboratory fr De la marmite des alarmistes
-
Der Treibhauseffekt bewirkt umgangssprachlich die Erwärmung eines Planeten durch Treibhausgase und Wasserdampf in der Atmosphäre.
-
Heute fasst man den Begriff viel weiter und bezeichnet den atmosphärischen Wärmestau der von der Sonne beschienenen Erde als atmosphärischen Treibhauseffekt, wegen ähnlicher physikalischer Grundlagen beider Vorgänge.
-
Der durch menschliche Eingriffe entstandene Anteil am atmosphärischen Treibhauseffekt wird anthropogener Treibhauseffekt genannt. Oft ist mit dem Begriff Treibhauseffekt verkürzt gleichzeitig die globale Erwärmung gemeint.

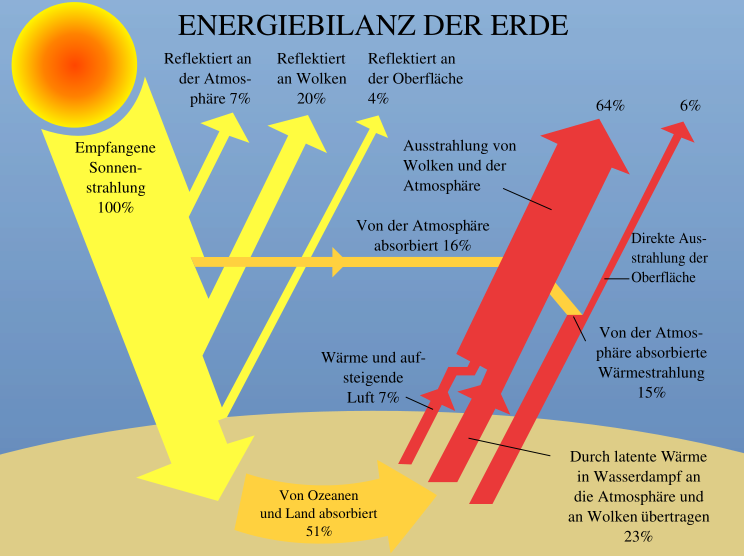
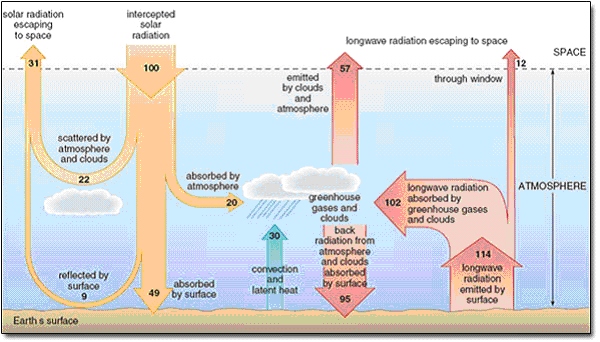
Bilanz linker (gelber) Teil:
Sonnenstrahlung: 342 W/m2 = 100 %
Reflektierte Sonnenstrahlung: 107 W/m2 = 30 %
In der Atmosphäre absorbiert: 67 W/m3 = 20%
An Oberfläche absorbiert: 168 W/m2 = 50 %
Bilanz Weltall: 342 W/m2 = 107 W/m2 + 235 W/m2
Bilanz Erdoberfläche: 168 W/m2 + 324 W/m2 = 492 W/m2 = 24 W/m2 + 78 W/m2 + 390 W/m2
![]()
![]() Energiebilanz der Erde (Wikipedia)
Energiebilanz der Erde (Wikipedia)
↑ en The Greenhouse Effect
de Aus der Panik-Küche en From the panic laboratory fr De la marmite des alarmistes
![]()
![]()
![]()
![]()
-
Barrett Bellamy Climate
en
The Greenhouse Effect
en Harder greenhouse effect
↑ fr L'effet de serre
- Pensée unique fr L'effet de serre remis en question par des physiciens théoriciens!
⇧
3 Grundlagen
en
Fundamentals
fr
Recherche fondamentale
- a Physikalische Aspekte / Der Atmosphäreneffekt
- b Wasserdampf & Wolken
- c Verstärkungseffekt & Rückkopplungen
- d Das CERN CLOUD Projekt
↑ a Physikalische Aspekte / Der Atmosphäreneffekt
|
en
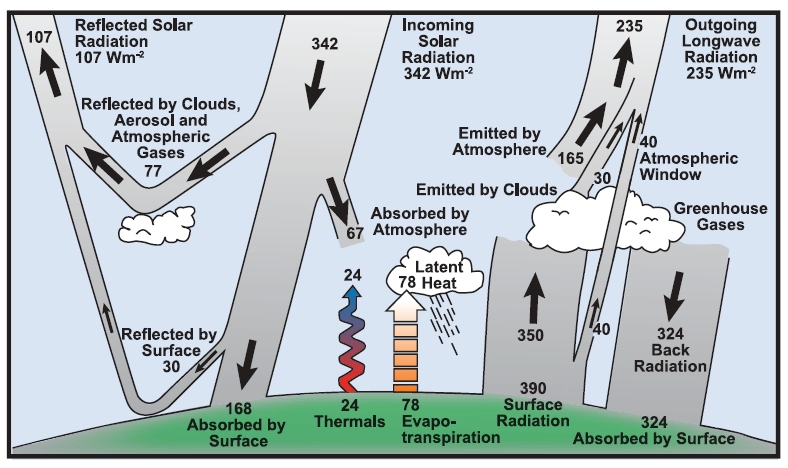
de Beachten Sie bitte, dass NASA in dieser Energiebilanz keine Gegenstrahlung erwähnt! en Please note that NASA doesn't mention any Greenhouse Effect in this Energy Budget! fr Veuillez noter que NASA ne mentionne aucun d'effet de serre dans ce bilan énergétique! |
de
|

-
NASA National Aeronautics and Space Administration / Educational Product
2003-06 en
Investigating the Climate System - Energy
-
NASA National Aeronautics and Space Administration / Earth Observatory
en Climate and Earth's Energy Budget
-
NASA National Aeronautics and Space Administration / Facts
en
The Balance of Power in the Earth-Sun System
| de | en | fr |
|---|---|---|
|
Klimawandel: Wissenschaft Physikalische Aspekte |
Climate change: Science Physical aspects |
Changement climatique: Science Aspects physiques |
| Atmosphäreneffekt | Atmosphere Effect | Effet atmosphérique |
| Das CERN CLOUD Projekt | The CERN CLOUD Project | Le projet CLOUD du CERN |
|
Grundlagen und Begriffe Physikalische Zusammenhänge Signalanalyse Glossar |
Physical basis and terms Physical correlations Signal processing Glossar |
Bases physiques et termes Corrélations physiques Traitement du signal Glossaire |
| de | en | fr |
|---|---|---|
|
Physikalische Aspekte Der Atmosphäreneffekt Forschungen |
Physical aspects The atmosphere effect Forschungen |
Aspects physiques L'effet de l'atmosphère Recherches scientifiques |
↑ b Wasserdampf & Wolken
![]()
![]()

-
Watts Up With That? (Antony Watts)
2014-05-16 en Tweaking the climate models: Researchers show emissions from forests influence very first stage of cloud formation
These clouds are almost certainly a result of evapotranspiration.
The clouds are distributed evenly across the forest, but no clouds formed over the Amazon River and its floodplain, where there is no tall canopy of trees.
While water may evaporate from the Amazon River itself, the air near the ground is too warm for clouds to form.
Trees, on the other hand, release water vapor at higher levels of the atmosphere, so the water vapor more quickly reaches an altitude where the air is cool enough for clouds to form.
When water vapor condenses, it releases heat into the atmosphere.
| de | en | fr |
|---|---|---|
|
Klimawandel: Wissenschaft Wasserdampf / Wolken |
Climate change: Science Water vapor / Clouds |
Changement climatique: Science Vapeur d'eau / nuages |
|
Wolkenforschung, Korrelation zwischen der kosmischen Strahlung und der Wolkenbildung, Korrelation zwischen Wolken und Temperatur, Der Wasserdampfverstärker für das CO2, Das Geheimnis der Wolken. |
||
↑ c Verstärkungseffekt & Rückkopplungen
de
Die Klimamodelle vs. Sichtweise der Skeptiker
Der Streit dreht sich ausschließlich um die Rückkopplungen.
en
The climate models vs. The skeptic's view
The argument is entirely about the feedbacks.
|
de
Positiver oder negativer Verstärkungseffekt |
|
|
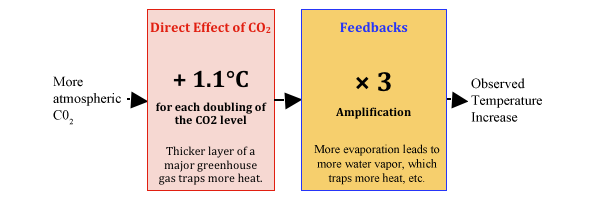
de Falls sich der CO2-Gehalt verdoppelt (was bei der gegenwärtigen Rate frühestens 2070 oder 2100 der Fall sein kann) simulieren die Klimamodelle eine Temperaturzunahme wegen dieses zusätzlichen CO2 um 1,1°C × 3 = 3,3°C. Die Klimawissenschaftler der Regierung und die Medien erzählen uns oft etwas über die direkte Auswirkung von CO2,
geben aber selten zu, dass |
de Falls sich das CO2-Niveau verdoppelt, beträgt die daraus resultierende Temperaturzunahme etwa 1,1°C × 0,5 = 0,6°C. Die seriösen skeptischen Wissenschaftler stimmten immer mit den Klimawissenschaftlern der Regierung über die direkten Auswirkungen des CO2 überein. Der Streit dreht sich ausschließlich um die Rückkopplungen. |
|
en If the CO2 level doubles (as it is on course to do by about 2070 to 2100), the climate models estimate the temperature increase due to that extra CO2 will be about 1.1°C × 3 = 3.3°C. The government climate scientists and the media often tell us about the direct effect of the CO2,
but rarely admit that |
en If the CO2 level doubles, skeptics estimates that the temperature increase due to that extra CO2 will be about 1.1°C × 0.5 = 0.6°C. The serious skeptical scientists have always agreed with the government climate scientists about the direct effect of CO2. The argument is entirely about the feedbacks. |

| de | en | fr |
|---|---|---|
|
Fehler der Klimamacher, Teil I Falscher CO2-Verstärkungseffekt des IPCC |
Errors, Part I Wrong CO2 Amplifying Effekt of the IPCC |
Erreurs, partie I Faux effet d'amplification du CO2 du GIEC |
| Der Streit um die Rückkopplungen | The argument about the feedbacks | L'argument des rétroactions |
↑
d Das CERN CLOUD Projekt
en
The CERN CLOUD Project
fr
Le projet CLOUD du CERN
| de | en | fr |
|---|---|---|
| Kosmische Strahlung | Cosmic Ray | Rayonnement cosmique |
⇧
4 Die Klimasensitivität von CO2
en
Climate sensitivity of CO2
fr
La sensibilité climatique du CO2
Mit folgenden Links wird von anderen Webseiten auf diese Seite verwiesen:
▶Die Klimasensitivität von CO₂
Siehe Klimaschau in Welt-Info
⇧ de Verzeichnis en Contents fr Sommaire
- 2020
- de
Wird die Menschheit jemals eine CO₂-Verdoppelung erreichen?
Wahrscheinlich nicht
en Will Humanity Ever Reach 2XCO₂? Possibly No - 2019
- de
Warum Wolken der Fluch aller Klimaforscher sind
Hamburger Max-Planck-Forscher Stevens: "Unsere Computer sagen nicht einmal mit Sicherheit voraus, ob die Gletscher in den Alpen zu- oder abnehmen werden" - 2018
- de
Klimasensitivität - Wer rechnet hier falsch ?
Die Milchmädchen-Rechnung, die Klima-Politiker, Journalisten und etliche Klimatologen nicht machen können oder wollen, lautet wie folgt:
Bis zur Verdoppelung des CO2-Gehaltes von heute 400 auf 800 ppm vergehen bei den aktuellen Emissionen mit einem Anstieg von ca. 2 ppm pro Jahr noch 200 Jahre.
Das bedeutet real in 100 Jahren ca. + 1,5°C - genau das, was sich Politiker bei der Pariser Konferenz so vorgestellt haben, aber ohne kostspielige und risikoreiche CO2-Verminderungsmaßnahmen.
- de Die Sonnenallergie der Klimaforscher
- 2016
- de Hamburger Max-Planck-Institut für Meteorologie hält CO2-Klimasensitivität von 2°C pro CO2-Verdopplung für möglich
- de
Ist das IPCC absichtlich blind bzgl. Wasserdampf, um einen
wissenschaftlichen Aspekt für eine politische Agenda zu beweisen?
en Does IPCC Practice Willful Blindness of Water Vapor to Prove a Scientific Point for a Political Agenda? - de
Marcel Crok:
Wie die Klimasensitivität (ECS) immer weiter schrumpft
en
Marcel Crok: Oversensitive - How Equlilibrium Climate Sensitivity
Shrinks Over Time
- de IPCC-Bericht: "Aufgrund fehlender Übereinstimmung der Werte aus den beurteilten Anhaltspunkten und Studien kann kein bester Schätzwert für die Gleichgewichts-Klimasensitivität angegeben werden"
- 2015
- de
Die vorausgesagte Erhöhung der Erdtemperatur durch
CO2 wird immer kleiner
en
Published measurements of climate sensitivity declining
- de
Späte aber wichtige Erkenntnis:
CO2-Klimasensitivität sinkt,
extreme Hitzemodelle werden verworfen, Ozeanzyklen als wichtiger
systematischer Klimafaktor anerkanntr
en
Equilibrium climate sensitivity in light of observations over
the warming hiatus
- de Studien aus 2014 geben Hoffnung: Erwärmungswirkung des CO2 wohl doch deutlich überschätzt. Offizielle Korrektur steht bevor
- 2014
- de
Was das IPCC zum Thema Klimasensitivität wusste, uns aber nicht
gesagt hat
en Climate Sensitivity: What the IPCC Knew But Didn't Tell Us - 2013
- de Zwei weitere Studien finden eine stark reduzierte CO2-Klimawirkung von 1,3 Grad pro CO2-Verdopplung
- 2012
- de
Durchgefallen: Klimakraft des Kohlendioxid hielt sich in der
geologischen Vergangenheit nicht an die IPCC-Vorgaben
en Estimate of climate sensitivity from carbonate microfossils dated near the Eocene-Oligocene global cooling - 2011
- de
Die Klimasensitivität liegt nur bei einem Siebtel der
IPCC-Behauptung
en New paper claims a value one seventh of the IPCC best estimate for Climate Sensitivity for a CO2 doubling - 2010
- de de Klimasensitivität von CO2
- 2009
- de
Geringe Klimasensitivität von CO2
en Low climate sensitivity of CO2
fr Faible sensibilité du climat de CO2
⇧ Welt-Info
|
|
de
CO2-Klimasensitivität en Climate sensitivity of CO2 fr La sensibilité climatique du CO₂ |
||||||||||||||||||||||||
| ▷Die Kalte Sonne Blog‑Themen Vahrenholt/Lüning ▶Die kalte Sonne | de ▷CO2-Klimasensitivität | ||||||||||||||||||||||||
| NoTricksZone | en 60 Papers Find Extremely Low CO2 Climate Sensitivity | ||||||||||||||||||||||||
| Max-Planck-Institut für Meteorologie | de Klimasensitivität - Ein Maß für den Klimawandel und eine große wissenschaftliche Herausforderung | ||||||||||||||||||||||||
| Wikipedia |
de
Klimasensitivität en Climate sensitivity fr Sensibilité climatique |
||||||||||||||||||||||||
| Vademecum |
▶Die Klimasensitivität von CO₂
▶Welt-Info |
||||||||||||||||||||||||
Siehe auch
|
|||||||||||||||||||||||||
⇧ de Allgemein en General fr Générale
Bezeichnungen
ECS = equilibrium climate sensitivity
de Die Temperaturerhöhung bei dauernd doppelt so hoher CO₂ Konzentration
Die ECS beschreibt den Temperaturanstieg, der zu beobachten ist, nachdem das Klimasystem nach einer Veränderung des Strahlungsantriebs den neuen Gleichgewichtszustand erreicht hat, wofür Jahrtausende nötig sind.
en Refers refers to the equilibrium change in global mean near-surface air temperature that would result from a sustained doubling of the atmospheric carbon dioxide concentration.
TCR = transient climate response
de
Bedeutet die Temperaturerhöhung über 20 Jahre bei 1% pro Jahr
Änderung der CO2 Konzentration um den
Mittelwert der verdoppelten Konzentration herum
(1% ist nicht unrealistisch).
Diese ist definiert als der Temperaturanstieg, der zum Zeitpunkt einer Verdoppelung der CO2-Konzentration in einem Szenario beobachtet wird, bei dem diese pro Jahr um 1% anwächst.
TCR ist wegen der Trägheit der Ozeane geringer als ECS.
Um den Einfluss des Menschen auf das Klima zu quantifizieren, ist die Transient Climate Response besser geeignet.
en defined as the average temperature response over a twenty-year period centered at CO2 doubling in a transient simulation with CO2 increasing at 1% per year
The transient response is lower than the equilibrium sensitivity, due to the "inertia" of ocean heat uptake.
![]()
![]()
de Die veröffentlichten Werte für beide Größen sind mit den Jahren kontinuierlich gesunken.
en The ECS and TCR estimates have both declined in the last 15 years, with the ECS declining from 6C to less than 2C.
Quellen /Sources:
- de
Ist das IPCC absichtlich blind bzgl. Wasserdampf, um einen
wissenschaftlichen Aspekt für eine politische Agenda zu beweisen?
en
Does IPCC Practice Willful Blindness of Water Vapor to Prove a
Scientific Point for a Political Agenda?
- de IPCC-Bericht: "Aufgrund fehlender Übereinstimmung der Werte aus den beurteilten Anhaltspunkten und Studien kann kein bester Schätzwert für die Gleichgewichts-Klimasensitivität angegeben werden"
| de | en | fr |
|---|---|---|
|
Klima: Wissenschaft Rückkopplung |
Climate: Science Feedback |
Clima: Science Rétroaction |
⇧ de Text en Text fr Texte
⇧ 2020
↑
Wird die Menschheit jemals eine CO₂-Verdoppelung erreichen?
Wahrscheinlich nicht
en
Will Humanity Ever Reach 2XCO₂? Possibly No
-
EIKE Europäisches Institut für Klima und Energie
Roy Spencer
2020-02-10 de Wird die Menschheit jemals eine CO₂-Verdoppelung erreichen? Wahrscheinlich nichtSummary
Die Energy Information Agency (IEA) projiziert eine Zunahme der auf Energie basierenden CO₂-Emissionen um 0,6% bis zum Jahr 2050.
Aber wenn man diese zukünftigen Emissionen auf die atmosphärische CO₂-Konzentration übertragen will, braucht man ein globales Kohlenstoff-Budget-Modell, und häufig akzeptieren wir einfach, dass sich die UN auf derartige Modelle stützen, wenn sie uns sagen, wie viel CO₂ sich in der Atmosphäre befindet bei irgendeinem CO₂-Emissions-Szenario.
Mittels eines einfachen, zeitabhängigen CO₂-Budget-Modells mit Schätzungen der jährlichen anthropogenen CO₂-Emissionen und optimiert, um zu den Messungen am Mauna Loa zu passen, zeige ich, dass die EIA-Emissionsprojektionen nur zu überraschend geringen CO₂-Konzentrationen bis zum Jahr 2050 führen.
Tatsächlich ergibt sich unter der Annahme konstanter Emissionen nach dem Jahr 2050, dass sich der atmosphärische CO₂-Gehalt unter 2 X CO₂ stabilisiert.
-
Watts UP With That? (Anthony Watts) / Roy Spencer
2020-02-02 en Will Humanity Ever Reach 2XCO₂? Possibly NoSummary
The Energy Information Agency (EIA) projects a growth in energy-based CO₂ emissions of +0.6%/yr through 2050.
But translating future emissions into atmospheric CO₂ concentration requires a global carbon budget model, and we frequently accept the United Nations reliance on such models to tell us how much CO₂ will be in the atmosphere for any given CO₂ emissions scenario.
Using a simple time-dependent CO₂ budget model forced with yearly estimates of anthropogenic CO₂ emissions and optimized to match Mauna Loa observations, I show that the EIA emissions projections translate into surprisingly low CO₂ concentrations by 2050.
In fact, assuming constant CO₂ emissions after 2050, the atmospheric CO₂ content eventually stabilizes at just under 2XCO₂.
| Roy W. Spencer |
Ph.D. is a principal research scientist for the University of Alabama
in Huntsville and the U.S. Science Team Leader for the Advanced
Microwave Scanning Radiometer (AMSR-E) on NASA's Aqua satellite.
▶Roy W. Spencer: Who is who (Skeptiker) ▶Roy W. Spencer: Video (Präsentationen) ▶Roy W. Spencer: Websites (English) ▶Ausschluss und Maulkorb für Kritiker (The mission of NASA) |
⇧ 2019
↑
Warum Wolken der Fluch aller Klimaforscher sind
Hamburger Max-Planck-Forscher Stevens:
"Unsere Computer sagen nicht einmal mit Sicherheit voraus, ob die
Gletscher in den Alpen zu- oder abnehmen werden"
-
Spiegel (Printausgabe) / Johann Grolle
2019-03-22 de Warum Wolken der Fluch aller Klimaforscher sindVorhersagen zur Erderwärmung sind noch immer erstaunlich ungenau.
Supercomputer und künstliche Intelligenz sollen helfen.
Die Klimasensitivität
Es ist eine schlichte Zahl, doch wird sie das Schicksal dieses Planeten bestimmen.
Sie ist leicht zu beschreiben, doch vertrackt schwierig zu berechnen.
Die Forscher nennen sie: "Klimasensitivität".
Sie gibt an, um wie viel sich die Durchschnittstemperatur auf der Erde erwärmt, wenn sich die Konzentration der Treibhausgase in der Atmosphäre verdoppelt.
Schon in den Siebzigerjahren wurde sie mithilfe primitiver Computermodelle ermittelt.
Die Forscher kamen zu dem Schluss, dass ihr Wert vermutlich irgendwo zwischen 1,5 und 4,5 Grad liegen dürfte.
An diesem Ergebnis hat sich bis heute, rund 40 Jahre später, nichts geändert.
Und genau darin liegt das Problem.
Die Rechenleistung der Computer ist auf das Vielmillionenfache gestiegen, aber die Vorhersage der globalen Erwärmung ist so unpräzise wie eh und je.
"Es ist zutiefst frustrierend", sagt Bjorn Stevens vom Hamburger Max-Planck-Institut für Meteorologie.
Seit mehr als 20 Jahren forscht er nun schon auf dem Feld der Klimamodellierung.
Kommentar und weitere Auszüge:
-
Die kalte Sonne (Fritz Vahrenholt & Sebastian Lüning)
2019-03-30 de Hamburger Max-Planck-Forscher Stevens:
"Unsere Computer sagen nicht einmal mit Sicherheit voraus, ob die Gletscher in den Alpen zu- oder abnehmen werden"Die Klimamodelle stehen weiter in der Kritik.
Sie haben weder die Abbremsung der Erwärmung zu Beginn der Jahrtausendwende kommen sehen,
noch gelingt es ihnen, die Temperaturentwicklung der letzten Jahrtausende zu reproduzieren.
Die Print-Ausgabe des Spiegel brachte am 22. März 2019 einen ausgezeichneten Beitrag über die Probleme der Klimamodelle.
Der Artikel von Johann Grolle ist leider nur für Abonnenten zugänglich, aber er ist es wert, den Gratismonat zu aktivieren bzw. das Heft zu bestellen.
Hier einige Auszüge:
Warum die Vorhersagen zur Erderwärmung so schwierig sind
Vorhersagen zur globalen Erwärmung sind noch immer erstaunlich ungenau. Supercomputer und künstliche Intelligenz sollen helfen.
Zur Klimasensitivität
Schon in den Siebzigerjahren wurde [die Klimasensitivität] mithilfe primitiver Computermodelle ermittelt.
Die Forscher kamen zu dem Schluss, dass ihr Wert vermutlich irgendwo zwischen 1,5 und 4,5 Grad liegen dürfte.
An diesem Ergebnis hat sich bis heute, rund 40 Jahre später, nichts geändert.
Und genau darin liegt das Problem.
Die Rechenleistung der Computer ist auf das Vielmillionenfache gestiegen, aber die Vorhersage der globalen Erwärmung ist so unpräzise wie eh und je.
"Es ist zutiefst frustrierend", sagt Bjorn Stevens vom Hamburger Max-Planck-Institut für Meteorologie.
Stevens hat selbst viel beigetragen zum Fortschritt. Und doch musste er sich immer wieder aufs Neue eingestehen, dass seine Zunft, was die Vorhersage des Klimawandels betrifft, auf der Stelle tritt.
Um sich jedoch konkret auf das Kommende vorzubereiten, taugten die Modelle der Klimaforscher nicht.
Als Entscheidungshilfe beim Bau von Deichen und Entwässerungskanälen seien sie ungeeignet.
"Unsere Computer sagen nicht einmal mit Sicherheit voraus, ob die Gletscher in den Alpen zu- oder abnehmen werden", erklärt Stevens.
Die Schwierigkeiten, denen sich er und seine Forscherkollegen gegenübersehen, lassen sich in ein Wort fassen:
Wolken.
Die träge über den Himmel ziehenden Gebirge aus Wasserdampf
sind der Fluch aller Klimaforscher.
Die Forscher können in ihren Modellen das Wasser nicht verdunsten, aufsteigen und kondensieren lassen, so wie es dies in der Wirklichkeit tut.
Sie müssen sich mit mehr oder weniger plausiblen Faustregeln behelfen.
"Parametrisierung" heißt das Verfahren, doch die Forscher wissen:
In Wirklichkeit ist das der Name einer chronischen Krankheit, von der all ihre Klimamodelle befallen sind.
Oft liefern sie drastisch voneinander abweichende Ergebnisse.
Die Temperaturen in der Arktis zum Beispiel klaffen in den verschiedenen Modellen um teilweise mehr als zehn Grad auseinander.
Das lässt jede Prognose der Eisbedeckung wie bloße Kaffeesatzleserei erscheinen.
Einstweilen allerdings ist nur gewiss, dass die Menschheit noch einige Zeit auf handfestere Klimaprognosen wird warten müssen.
Und selbst wenn sich die Wolken irgendwann den Gleichungen der Forscher fügen,
wird die Welt dann sicher vor Überraschungen sein?
Keiner der beiden Forscher mag da Entwarnung geben.
"Wir betreten unkartiertes Terrain", sagt Schneider.
"Da gibt es keine Gewissheiten."
|
|
⇧ 2018
↑ Klimasensitivität - Wer rechnet hier falsch ?
-
EIKE Europäisches Institut für Klima und Energie
Dr. D.E. Koelle
2018-12-17 de Klimasensitivität - Wer rechnet hier falsch?Der IPCC basiert seine Hypothese der Klimasensitivität immer noch auf der alten Charney-Studie von 1979:
Eine CO2-Verdoppelung soll demnach einen Temperaturanstieg um 3°C bewirken.
Diese Annahme wird auch bei den Klimamodellen verwendet.


Neuere Studienergebnisse zu diesem Thema mit einem wesentlich geringeren Anstieg
wurden vom IPCC ignoriert.
Wie auch jüngst wieder durch PIK Professor Anders Levermann beim öffentlichen Fachgespräch im Umweltausschuss des Deutschen Bundestages am 28.11.18.
Doch auch Prof. Marotzke (MPI) gab kürzlich zu, dass die bisherige Annahme offenbar zu hoch ist.
Dies wird durch den Vergleich des berechneten Temperaturanstieges mit der Realität der letzten 20 Jahre bestätigt.
Bis heute konnte der angebliche CO2-Effekt auf die Globaltemperatur nicht durch historische Fakten belegt werden,
sondern ist laut IPCC-Bericht eine Sache von "confidence", d.h. von Glauben oder Vertrauen.
Die Milchmädchen-Rechnung, die Klima-Politiker, Journalisten und etliche Klimatologen nicht machen können oder wollen, lautet wie folgt:
Bis zur Verdoppelung des CO2-Gehaltes von heute 400 auf 800 ppm vergehen bei den aktuellen Emissionen mit einem Anstieg von ca. 2 ppm pro Jahr noch 200 Jahre.
Das bedeutet real in 100 Jahren ca. + 1,5°C - genau das, was sich Politiker bei der Pariser Konferenz so vorgestellt haben, aber ohne kostspielige und risikoreiche CO2-Verminderungsmaßnahmen.
Das international anerkannte Modtran-Programm der Atmosphärenphysik
zeigt zwischen 400 und 800 ppm einen Temperaturanstieg von nur 1,7°C (anstelle von den 3°C des IPCC) mit Berücksichtigung des Sättigungseffektes, der ansonsten oft ignoriert wird.
Das wäre dann in 100 Jahren nur ein Anstieg um ca. +0,85°C.

Tatsächlich ist aber kein weiterer Anstieg der mittleren Globaltemperatur zu erwarten, sondern das Gegenteil:
sie wird in den nächsten 400 Jahren aller Wahrscheinlichkeit nach wieder um ca. 1,5°C absinken
- so, wie dies schon seit 8000 Jahren regelmäßig alle 1000 Jahre der Fall war,
zuletzt in der mittelalterlichen Kaltzeit (auch " Little Ice Age" genannt).
Dieser natürliche Klimazyklus basiert auf solaren und astrophysikalischen Faktoren und kann von Menschen nicht beeinflusst werden - genauso wenig wie andere Natur-Ereignisse wie Erdbeben und Vulkanausbrüche.
|
|
Klimasensitivität - Wer rechnet hier falsch? Der CO2-Treibhauseffekt: Die Klimasensitivität von CO2 Wenn die CO2-Konzentration zunimmt, ist die Erwärmung wegen der Sättigung kleiner Fehler der "Klimamacher", Teil I: Falscher CO2-Verstärkungseffekt des IPCC Neuste Informationen über den Klimawandel: Die Erwärmungspause |
↑ Die Sonnenallergie der Klimaforscher
-
EIKE Europäisches Institut für Klima und Energie
Ulli Kulke
2018-06-29 de Die Sonnenallergie der KlimaforscherDie Klimaforschung meidet die Sonne wie der Teufel das Weihwasser.
Aktuelle Studien zeigen jedoch:
Sie könnte eine größere Rolle im Klimageschehen spielen, als die herkömmlichen Modelle uns sagen wollen.
Womöglich auch eine größere als das Kohlendioxid.
Und deshalb würde man das am liebsten ignorieren.
Wie lange noch?
Es bleibt spannend und die Debatte ist alles andere als beendet.
Kosmische Strahlung
Ionisierende Partikel, die permanent auf die Erdatmosphäre einprasseln.
Dabei handelt es sich um einen Teilchenstrom, der von explodierenden Supernovae stammt,
durch die Galaxie fließt
und schließlich, in der Erdatmosphäre angekommen, Einfluss auf die Wolkenbildung ausübt, sie verstärkt.
Hier kommt nun die Sonne ins Spiel:
Sie ist es nämlich, die diesen Teilchenstrom entscheidend moduliert.
Deshalb, so sagt Svensmark, sei sie der hauptsächliche Akteur des irdischen Klimageschehens.
Nicht das CO2.
Der Mechanismus ist seit vielen Jahren im Gespräch.
Längst unbestritten ist der Einfluss der Sonne auf die galaktische Strahlung.
Der Teilchenstrom trifft auf die Erdatmosphäre,
ionisiert dort vorhandene mikroskopisch kleine Schwebstoffe, sogenannte "Aerosole",
sorgt so dafür, dass diese sich vergrößern,
dass Wasserdampf an ihnen kondensiert und sich so Wolken bilden.
Und zwar in den unteren Schichten der Atmosphäre, also dort, wo sie kühlend auf die Erdtemperatur einwirken, weil sie die wärmenden Strahlen der Sonne wieder zurückwerfen.
Wolken in den oberen Schichten dagegen halten die auf die Erde eingestrahlte Wärme in der Atmosphäre zurück, erhitzen sie also eher, als dass sie sie kühlen.
-
Die kalte Sonne (Fritz Vahrenholt & Sebastian Lüning)
2018-06-30 de Die Sonnenallergie der KlimaforscherEinfluss der Sonne auf die Klimaschwankungen
Auch wenn der Einfluss der Sonne auf die Klimaschwankungen in den letzten Jahrzehnten etwas in den Hintergrund gerückt ist:
Es gibt sie, die Forscher, die die schwankende Wirkkraft unseres Zentralgestirns auf das Geschehen in der Erdatmosphäre untersuchen, damit auch auf den Klimawandel - und die dabei überraschende Ergebnisse erzielen. Henrik Svensmark, Leiter der Sonnenforschung an der Technischen Universität Dänemarks in Kopenhagen, ist einer von ihnen.
Und er wagt sich weit vor in der Klimadebatte, dem Diskurs mit der womöglich bedeutendsten Tragweite unserer Zeit.
Er erhält Widerspruch, natürlich.
Dabei sind sich Svensmark und seine Fachkritiker einig:
Das Thema "Sonne" verdient in der Klimaforschung mehr Aufmerksamkeit.Dabei geht es den Beteiligten vor allem um das komplexe Zusammenspiel zwischen unserem Zentralgestirn und ionisierenden Sendboten aus den Tiefen der Galaxie - der "kosmischen Strahlung".
Die "Klimasensitivität"
Svensmark sagt: "Das Klima wird stärker durch Veränderungen der kosmischen Strahlung beeinflusst als durch das Kohlendioxid."
CO2 habe zwar auch eine Wirkung, klar, "aber sie ist weit geringer, als die meisten heutigen Klimamodelle vorgeben, und auch geringer als der Einfluss der kosmischen Strahlung".
So werde, seiner Einschätzung nach, eine Verdoppelung des Treibhausgases in der Atmosphäre eine Erhöhung der globalen Temperatur
um höchstens ein Grad bewirken, und nicht um zwei Grad, wie es heute als "Common sense" hingestellt wird.
Mit anderen Worten: Die "Klimasensitivität" von Kohlendioxid sei nur halb so groß wie angenommen.
Und, was die Veränderungen im natürlichen CO2-Haushalt der Erdatmosphäre und diejenigen der Temperatur über Zeiträume von Millionen Jahren angeht:
Da sei das Treibhausgas eher "ein Sklave der kosmischen Strahlung sowie der durch sie bewirkten Erderwärmung, und eben nicht ihr Herrscher".
Die Höhe des CO2-Anteils sei dabei im Großen und Ganzen der Erwärmung gefolgt, nicht umgekehrt.
Wie unser Klima- und Wettergeschehen durch jene kosmische Strahlung beeinflusst wird
Im vergangenen Dezember hat Svensmark erneut eine wissenschaftliche Studie in der Fachzeitschrift "Nature Communications" ("Nature"-Gruppe) veröffentlicht, mit der er seine These untermauern will.
In der Arbeit geht es - zunächst - weniger um die Sonne selbst, als darum, wie unser Klima- und Wettergeschehen durch jene kosmische Strahlung beeinflusst wird, ionisierende Partikel, die permanent auf die Erdatmosphäre einprasseln.
Dabei handelt es sich um einen Teilchenstrom, der von explodierenden Supernovae stammt, durch die Galaxie fließt und schließlich, in der Erdatmosphäre angekommen, Einfluss auf die Wolkenbildung ausübt, sie verstärkt.
Quelle / Source:
-
Achtgut / Ulli Kulke
2018-06-26 de Die Sonnenallergie der Klimaforscher
⇧ 2016
↑ Hamburger Max-Planck-Institut für Meteorologie hält CO2-Klimasensitivität von 2°C pro CO2-Verdopplung für möglich
-
Die kalte Sonne (Fritz Vahrenholt & Sebastian Lüning)
2016-08-14 de Hamburger Max-Planck-Institut für Meteorologie hält CO2-Klimasensitivität von 2°C pro CO2-Verdopplung für möglichDas Thema CO2-Klimasensitivität ist der Schlüssel zur Entwirrung der Klimadebatte.
Wie die meisten von unseren Lesern wissen, steuert die Wissenschaft derzeit auf deutlich niedrigere Werte zu.
Während der IPCC lange Jahre 3,0°C Erwärmung pro CO2-Verdopplung annahm, geht die Reise in den jüngeren begutachteten Publikation stark in Richtung 2 Grad.
Dem Hamburger Max-Planck-Institut für Meteorologie (MPIM), und speziell dessen Leiter Björn Stevens, gebührt hier große Anerkennung.
Er sprach aus was viele bereits ahnten:
Die Aerosole kühlen gar nocht so stark, wie in den Klimamodellen angenommen.Im Umkehrschluss kann auch das CO2 nicht so stark wärmen wie behauptet, um schlussendlich nicht über die aktuellen Temperaturen hinauszuschießen.
Eine erstaunliche Aussage:
Die CO2-Klimasensitivität könnte durchaus bei 2°C liegen, sagen die Hamburger Forscher.
Eine kleine Sensation, zu der die Medien schweigen, zu unbequem ist das Ergebnis für die Klimadebatte.
Nicht auszuschließen, dass Stevens in 10 Jahren dafür den Nobelpreis bekommt.
-
MPIP Max-Planck-Institut für Meteorologie
Dr. Thorsten Mauritsen
2016 de Klimasensitivität - Ein Maß für den Klimawandel und eine große wissenschaftliche Herausforderung
↑
Ist das IPCC absichtlich blind bzgl. Wasserdampf, um einen
wissenschaftlichen Aspekt für eine politische Agenda zu beweisen
en
Does IPCC Practice Willful Blindness of Water Vapor to Prove a
Scientific Point for a Political Agenda?
![]()
![]()
-
EIKE Europäisches Institut für Klima und Energie
Dr. Tim Ball
2016-07-21 de Ist das IPCC absichtlich blind bzgl. Wasserdampf, um einen wissenschaftlichen Aspekt für eine politische Agenda zu beweisen?
-
Watts Up With That? (Antony Watts)
Dr. Tim Ball
2016-07-16 en Does IPCC Practice Willful Blindness of Water Vapor to Prove a Scientific Point for a Political Agenda?
↑
Marcel Crok: Wie die Klimasensitivität (ECS) immer weiter schrumpft
en
Marcel Crok: Oversensitive - How Equlilibrium Climate Sensitivity
Shrinks Over Time
-
Marcel Crok
2016-06-08 en
Oversensitive - How Equlilibrium Climate Sensitivity Shrinks Over Time
-
EIKE Europäisches Institut für Klima und Energie
2016-07-23 de EIKE 9. IKEK Marcel Crok: Oversensitive - How Equlilibrium Climate Sensitivity Shrinks Over TimeWie die Klimasensitivität (ECS) immer weiter schrumpft
de Marcel Crok, investigativer Wissenschaftsjournalist aus den Niederlanden und Autor von "Der Stand des Klimas (De Staat van het Klimaat)" sowie expert reviewer des AR5 spricht zum Thema "Übersensitiv - Die treibende Kraft des CO2".
en Marcel Crok, Dutch investigative scientific journalist and author of "The State of the Climate (De Staat van het Klimaat)" as well as expert reviewer of AR5 talks about "Oversensitive - How Equlilibrium Climate Sensitivity Shrinkes Over Time".
Nachdem Marcel Crok, der jahrelang für ein bekanntes niederländisches Wissenschaftsmagazin schrieb, auf die berüchtigte "Hockeyschläger-Kurve" stieß und zusammen mit anderen Wissenschaftlern einen Artikel darüber erarbeitete, wurde er plötzlich als Klimaskeptiker abgetan.
Er forschte weiter und schrieb dann sein Buch, "De Staat van het Klimaat" (leider nur auf niederländisch erhältlich).
Hier stellt er die Frage: Wie empfindlich reagiert das Klima auf CO2? Bzw: Wie viel CO2 erwärmt das Klima wie stark?
Das IPCC hält diese Sensitivität für sehr hoch - aber seine Modelle zeigen beim näheren Hinsehen große Probleme.
So enthalten sie veraltete Daten oder verdrehte Zahlenreihen.
Korrigiert zeigen die Modelle natürlich ganz andere - weniger bedrohliche - Ergebnisse.
Das IPCC jedoch versteckt anscheinend systematisch solche "guten Nachrichten" in Fußnoten oder ganz.
Marcel Crok zeigt dies beispielhaft an einem Rechenbeispiel, das IPCC-Formeln verwendet.
Viele angesehene Wissenschaftler sind bei eigenen Messungen auf Basis der IPCC-Methoden zu anderen Ergebnissen als das IPCC gekommen.
Doch auch wenn sie diese Ergebnisse in Fachzeitschriften veröffentlichen, passt das IPCC seine Modelle nicht an diese unabhängige Messungen an - warum nicht?
Tatsächlich kann gezeigt werden, dass das Klima weitaus weniger auf einen CO2-Anstieg reagiert, als das IPCC weis machen will.
Die Beobachtungen stimmen nicht mit den Modellen überein.
Wahrscheinlicher als die Schreckensszenarien des IPCC, die auf den falschen Modellen basieren, ist eine weitaus geringere Erwärmung -
selbst ohne verringerte CO2-Emissionen sprechen wir von höchsten 2°C bis 2100.
Das sind gute Nachrichten, aber warum will sie niemand hören?
↑ IPCC-Bericht: "Aufgrund fehlender Übereinstimmung der Werte aus den beurteilten Anhaltspunkten und Studien kann kein bester Schätzwert für die Gleichgewichts-Klimasensitivität angegeben werden"
-
Die kalte Sonne (Fritz Vahrenholt & Sebastian Lüning)
2016-06-02 de IPCC-Bericht: "Aufgrund fehlender Übereinstimmung der Werte aus den beurteilten Anhaltspunkten und Studien kann kein bester Schätzwert für die Gleichgewichts-Klimasensitivität angegeben werden"Der Trend ist klar: Die CO2-Klimasensitivitäten sinken immer weiter.
⇧ 2015
↑
Die vorausgesagte Erhöhung der Erdtemperatur durch
CO2 wird immer kleiner
en
Published measurements of climate sensitivity declining
![]() de(1)
de(1)
![]() de(2)
de(2)
![]() en
en
![]() fr
fr
![]()
-
EIKE Europäisches Institut für Klima und Energie
2015-07-25 de Die vorausgesagte Erhöhung der Erdtemperatur durch CO2 wird immer kleiner
-
Niche Modeling
2015-06-20 en Published measurements of climate sensitivity declining
↑
Späte aber wichtige Erkenntnis:
CO2-Klimasensitivität sinkt,
extreme Hitzemodelle werden verworfen, Ozeanzyklen als wichtiger
systematischer Klimafaktor anerkannt
en
Equilibrium climate sensitivity in light of observations over
the warming hiatus
-
Die kalte Sonne (Fritz Vahrenholt & Sebastian Lüning) / Frank Bosse
2015-05-18 de Späte aber wichtige Erkenntnis: CO2-Klimasensitivität sinkt, extreme Hitzemodelle werden verworfen, Ozeanzyklen als wichtiger systematischer Klimafaktor anerkanntIPCC AR4 Climate Change 2007: Synthesis Report
Der Mittelwert im AR4 betrug 3°C Erwärmung pro CO₂-Verdopplung.
IPCC AR5 Climate sensitivity
Im 5. IPCC-Bericht (AR5) wollte man sich offensichtlich nicht die Blöße geben, einen verringerten Wert anzugeben - also gab man einfach gar keinen an und nannte nur die weite Spanne von 1,5-4,5°C.
Einzige Neuerung war die Herabsetzung der unteren Grenze der Spanne von 2,0 auf 1,5°C.
Daniel Johannson und seine Kollegen sprachen nun aus, was eigentlich der IPCC schon vor zwei Jahren hätte einräumen müssen.
Die mittlere Klimasensitivität liegt nun ein halbes Grad niedriger als zuvor, nämlich bei 2,5°C.
Hätte man dies zur Zeit der AR5-Herausgabe transparent berichtet, so hätte dies politisch sicher "das falsche Signal" ausgesandt, hatte man sich sicher gedacht.
Also verfiel man in Trickserei.
Quelle / Source:
-
Nature Climate Change
Daniel J. A. Johansson, Brian C. O'Neill, Claudia Tebaldi & Olle Häggström
2015-03-30 de Equilibrium climate sensitivity in light of observations over the warming hiatus... We also find that the hiatus is primarily attributable to El Niño/Southern Oscillation-related variability and reduced solar forcing.
↑ Studien aus 2014 geben Hoffnung: Erwärmungswirkung des CO2 wohl doch deutlich überschätzt. Offizielle Korrektur steht bevor
-
Die kalte Sonne (Fritz Vahrenholt & Sebastian Lüning)
2015-01-19 de Studien aus 2014 geben Hoffnung: Erwärmungswirkung des CO2 wohl doch deutlich überschätzt. Offizielle Korrektur steht bevorDie Klimadiskussion ist nicht so schwarz-weiß wie einige Beobachter es gerne hätten.
Im Grunde geht es vor allem um die Höhe eines bestimmten Klimawertes, nämlich der sogenannten CO2-Klimasensitivität:
Um wieviel erhöht sich die Erdtemperatur, wenn sich die CO2-Konzentration in der Atmosphäre verdoppelt?
Der IPCC geht von einem Mittelwert von 3°C pro CO2-Verdopplung aus.
Allerdings weisen mittlerweile immer mehr wissenschaftliche Studien darauf hin, dass man hier zu hoch gegriffen hat und der Wert wohl deutlich niedriger liegt.
In unserem Buch "Die kalte Sonne" hatten wir zwei Szenarien mit 1,5°C und 1,0°C vorgestellt - und bekamen dafür reichlich mediale Prügel vom Establishment.
Mittlerweile kommen jedoch etliche Studien den 1,5°C ziemlich nahe.
So ändern sich die Zeiten.
↑ 2014
↑
Was das IPCC zum Thema Klimasensitivität wusste, uns aber nicht
gesagt hat
en
Climate Sensitivity: What the IPCC Knew But Didn't Tell Us
-
GWPF The Global Warming Policy Foundation Report 12
Nicholas Lewis and Marcel Crok, Foreword by Professor Judith Curry
2014 en
OVERSENSITIVE: HOW THE IPCC HID THE GOOD NEWS ON GLOBAL WARMING
-
Cato At Lyberty
2014-03-05 en Climate Insensitivity: What the IPCC Knew But Didn't Tell UsThe IPCC AR5 footnote 16 states:
No best estimate for equilibrium climate sensitivity can now be given because of a lack of agreement on values across assessed lines of evidence and studies.
-
Weltwoche 11/2014 / Markus Schär
2014-03-13 de Das Schweigen der Klimaforscher*
* (Ganzer Inhalt nur registrierten Abonnenten der Weltwoche zugänglich)
EIKE Europäisches Institut für Klima und Energie
2014-03-18 de Das Schweigen der KlimaforscherDer Uno-Klimarat, geführt vom Berner Professor Thomas Stocker, versteckte in seinem Bericht gute Nachrichten.
Denn aufgrund neuer Erkenntnisse müsste er beim Klimawandel Entwarnung geben.
Dies behauptet das Gutachten zweier Experten, das letzte Woche herauskam.
Seit siebzehn Jahren erwärmt sich weltweit das Klima nicht mehr.
Das mögen die Schweizer nach einem milden Nichtwinter zwar kaum glauben.
In Kairo aber fiel seit einem Jahrhundert erstmals wieder Schnee.
In Amerika herrschte eine Rekordkälte.
Und in der Antarktis hat sich das Eis so weit wie selten ausgedehnt.
Vor allem zeigen die Messungen der Meteorologen:
Seit 1997 ist die Durchschnittstemperatur kaum noch gestiegen -
bei den Prognosemodellen der Klimaforscher kann also etwas nicht stimmen.
-
NoTricksZone (Pierre L. Gosselin)
2014-03-18 en Switzerland's 'WeltWoche' Features "The Silence Of The Climate Scientists" How The IPCC "Concealed Good News"
-
EIKE Europäisches Institut für Klima und Energie
2014-03-11 de Mehr Reaktionen auf die Studie von Lewis und Crok: Was das IPCC zum Thema Klimasensitivität wusste, uns aber nicht gesagt hatIn einem bemerkenswerten Beispiel von wissenschaftlicher Pflichtverletzung ist offenbar geworden, dass das IPCC viel mehr wusste, als es in seinem Klimakompendium 2013 hat verlauten lassen, und zwar darüber, wie niedrig die Klimasensitivität der Erde tatsächlich ist.
Die Bedeutung dieser Enthüllung kann gar nicht übertrieben werden.
Wenn die UN ehrlich gewesen wären, hätte sich die "Dringlichkeit" der globalen Erwärmung in Luft aufgelöst, aber in der Erkenntnis, dass dies zu Problemen geführt hätte, zogen sie es vor, die politischen Führer der Welt in die Irre zu führen.
Die Klimasensitivität der Erde ist der wichtigste Klimafaktor bei der Bestimmung, wie stark die globale Erwärmung als Folge unserer Treibhausgasemissionen ausfallen wird
(hauptsächlich durch das Verbrennen fossiler Treibstoffe, um zuverlässig billige Energie zu erzeugen).Das IPCC konnte nicht gut aufgrund der wissenschaftlichen Beweise zu dem Ergebnis kommen, dass der wirkliche Wert irgendwo unter 2°C liegt -
falls es das so gesagt hätte, hätte es die Klimamodelle ungültig gemacht und damit den Gehalt des ganzen Berichtes (das heißt seiner Projektionen der Klimaänderung).
-
Watts Up With That? (Antony Watts)
2014-03-06 en More reax to Lewis and Crok: What the IPCC Knew But Didn't Tell UsClimate Insensitivity: What the IPCC Knew But Didn't Tell Us
Quelle/Source:
-
GWPF The Global Warming Policy Foundation
Nicholas Lewis and Marcel Crok, Foreword by Professor Judith Curry
en
GWPF Report 12: OVERSENSITIVE How the IPCC hid the good news on global warming
Foreword
The sensitivity of our climate to increasing concentrations of carbondioxide is at the heart of the scientific debate on anthropogenic climate change, and also the public debate on the appropriate policy response to increasing carbon dioxide in the atmosphere.
Climate sensitivity and estimates of its uncertainty are key inputs into the economic models that drive cost-benefit analyses and estimates of the social cost of carbon.
...
↑ 2013
↑ Zwei weitere Studien finden eine stark reduzierte CO₂-Klimawirkung von 1,3 Grad pro CO2-Verdopplung
-
Die kalte Sonne (Fritz Vahrenholt & Sebastian Lüning)
2013-12-19 de Zwei weitere Studien finden eine stark reduzierte CO₂-Klimawirkung von 1,3 Grad pro CO2-Verdopplung
↑ 2012
↑
Durchgefallen: Klimakraft des Kohlendioxid hielt sich in der
geologischen Vergangenheit nicht an die IPCC-Vorgaben
en Estimate of climate sensitivity from carbonate microfossils dated near
the Eocene-Oligocene global cooling
-
Die kalte Sonne (Fritz Vahrenholt & Sebastian Lüning)
2012-12-10 de Durchgefallen: Klimakraft des Kohlendioxid hielt sich in der geologischen Vergangenheit nicht an die IPCC-Vorgaben
-
Watts Up With That? (Antony Watts)
2012-10-05 en New paper on climate sensitivity estimates 1.1 ± 0.4 °C for a doubling of CO2
-
Climate of the Past
2012 en Estimate of climate sensitivity from carbonate microfossils dated near the Eocene-Oligocene global cooling
↑ 2011
↑
Die Klimasensitivität liegt nur bei einem Siebtel der IPCC-Behauptung
en New paper claims a value one seventh of the
IPCC best estimate for Climate Sensitivity for a CO2 doubling
-
Klimaskeptiker Info
2011-03-02 de Die Klimasensitivität liegt nur bei einem Siebtel der IPCC-BehauptungDie Klimasensitivität des CO2 ist ein Maß dafür, wie viel Erwärmung bei einer Verdopplung der CO2-Konzentration in der Atmosphäre zu erwarten ist.
Dieser Wert wird vom IPCC mit 3,2 °C eingeschätzt.
Dieser Wert liegt nach den Ergebnissen einer neuen Studie um den Faktor 7 zu hoch
Diese neuen Erkenntnisse bieten eine weitere Erklärung dafür, daß die alarmistischen Prognosen (z.B. von James Hansen vor dem US-Kongress) keinen Bezug zur Realität haben.
Prognosen, die mit siebenfach überhöhten Werten erstellt werden, kommen kaum zu richtigen Ergebnissen.
Was bedeutet nun dieser neue Wert für die Bewertung der CO2-Konzentration?
Als vordindustrieller Wert wird meist 280 ppm angenommen, die aktuelle CO2-Konzentration liegt bei 390 ppm.
Bei einer Klimasensitivität von 0,45 °C pro Verdoppelung des CO2 ergibt sich eine durch CO2 rechnerisch hervorgerufene Erwärmung von (log2 390 - log2 280 ) · 0,45 °C ≈ 0,22 °C seit Mitte des 19. Jahrhunderts.
Die tatsächlich beobachteten Temperaturschwankunegn waren aber erheblich größer.
Allein für das 20. Jahrhundert wird eine Erwärmung um 0,7 °C behauptet.
Selbst wenn die Hälfte davon auf Hitzeinsel-Effekte entfällt (und daher nicht die globale Realität wiedergibt), kann CO2 für die Temperaturentwicklung der letzten 150 Jahre nicht der wesentliche oder gar allein entscheidende Faktor gewesen sein.
CO2 spielt für die Temperaturentwicklung allenfalls eine äußerst nachrangige Rolle.
In der Zukunft ist bei einer derart geringen Klimasensitivität des CO2 auch keine wesentliche Erwärmung durch CO2 zu erwarten, selbst wenn die Konzentration in der Atmosphäre auf unrealistische Werte wie 560 ppm ansteigen würde, denn selbst dann wäre nur mit einer Erwärmung um 0,45 °C zu rechnen.
Das ist weit weniger als der politisch propagierte Grenzwert von 2 °C, den anzustreben die Alarmisten der Politik eingeredet haben.
-
Whatts Up With That? (Antony Watts)
2011-03-02 en New paper claims a value one seventh of the IPCC best estimate for Climate Sensitivity for a CO2 doublingThe climate sensitivity CS as a measure for the temperature increase found, when the actual CO2-concentration is doubled, assumes CS = 0.41 °C for the tropical zone, CS = 0.40 °C for the moderate zones and CS = 0.92 °C for the polar zones.
The weighted average over all regions as the global climate sensitivity is found to be CS = 0.45 °C with an estimated uncertainty of 30%, which mostly results from the lack of more precise data for the convection between the ground and atmosphere as well as the atmospheric backscattering....
The values for the global climate sensitivity published by the IPCC cover a range from 2.1 °C - 4.4 °C with an average value of 3.2 °C, which is seven times larger than that predicted here.
Quelle / Source:
-
Hermann Harde, Helmut-Schmidt-Universität Hamburg, Germany
2011 en
How much CO2 really contributes to global
warming? Spectroscopic studies and modelling of the influence of
H2O, CO2 and
CH4 on our climate
↑ 2010
↑ Die Klimasensitivität von CO2
-
EIKE Europäisches Institut für Klima und Energie
2010-07-22 de Die Klimasensitivität von CO2Der direkte Einfluss von CO2 auf die Erdtemperatur beträgt nur einen kleinen Bruchteil von 1 Grad Celsius und ist damit praktisch völlig unwichtig.
Hierin stimmen fast alle Wissenschaftler überein.
Die Alarmmeldungen über Erderwärmung basieren auf ANNAHMEN (keineswegs Kenntnissen) über die Wirkung von Wolken.
In den Modellen auf die sich die Voraussagen des UN-Klimarates stützen wird (recht willkürlich) ANGENOMMEN, dass Wasserdampf und Wolken die geringfügigen Temperaturerhöhungen durch CO2 in katastrophaler Weise verstärken, und somit die "Klimakrise" hervorrufen.
Dies wird als "positive Rückkopplung" bezeichnet.
"Negative Rückkopplung" dagegen wirkt irgendwelchen Temperaturerhöhungen ENTGEGEN.
Die Klimasensitivität von CO2 - Zusammenfassung
-
Rainer Link, Physiker
de
Klimasensitivität des CO2
↑ 2009
↑
Geringe Klimasensitivität von CO2
en Low climate sensitivity of CO2
fr Faible sensibilité du climat de CO2
-
EIKE Europäisches Institut für Klima und Energie
2009-11-12 de Das wissenschaftliche Ende der Klimakatastrophe? -
CO2 allein kann aus allgemein anerkannten physikalischen Gründen nicht zu dieser großen Temperaturerhöhung führen.
Eine Verdopplung des CO2 Anteils in der Atmosphäre vom vorindustriellen Wert 280 ppmV auf 560 ppmV, was der Verbrennung sämtlicher fossiler Energiereserven der Erde entspräche, führt gemäß IPCC-Bericht vom Jahre 2001 nur zu einer Temperaturerhöhung von 0,8 °C.
Dies liegt innerhalb der natürlich bedingten Klimaschwankungen des letzten Jahrtausends und bietet keinerlei Anlass zu katastrophalen Zukunftsszenarien.
-
Das IPCC und seine Klimamodelle sagen allerdings aus, dass durch eine positive Rückkopplung vermittels erhöhter Wasserdampfkonzentration in der Atmosphäre durchaus alarmierende Temperaturen erzeugt werden könnten.
Hierbei soll die zunächst relativ geringfügige, allein durch den Beitrag des CO2 bewirkte Erwärmung vermehrt Wasserdampf ausgasen lassen, dessen wesentlich stärkerer Treibhauseffekt dann für weit höhere Temperatursteigerungen sorgt.
Es gibt allerdings auch negative Rückkoppelungen (Gegenkoppelungen).
Ein Beispiel: Zunehmender Wasserdampf führt zu stärkerer Wolkenbildung, die Wolken schirmen die Sonneneinstrahlung ab und wirken abkühlend. Gegenkoppelungen wurden allerdings bisher auf Grund fehlender Messdaten in den Klimamodellen nicht berücksichtigt.
-
Ein negativer Rückkopplungseffekt, gleichbedeutend mit Abschwächung bzw. einem Rückkoppelungsfaktor kleiner als Null, würde zu einer geringeren Anhebung der globalen Temperatur als die oben genannten 0,8 °C bei Verdopplung der CO2 Konzentration in der Atmosphäre führen.
-
Mit dem nunmehr durch Messungen belegten, korrekten Rückkopplungsfaktor aus dem ERBE-Projekt von f = -1 ergibt sich dagegen nur die Temperaturerhöhung DT = 0,5 °C für eine Verdopplung der CO2 Konzentration in der Atmosphäre.
Die Messungen zeigen daher klar und eindeutig, dass eine Erhöhung der CO2-Konzentration auf das Doppelte (Verbrauch aller fossilen Brennstoffreserven) bis zum Ende dieses Jahrhunderts keinerlei Gefahr für das Erdklima bedeuten kann.
Selbst eine noch unrealistischere Verdopplung, also Vervierfachung der CO2 Emission (Verbrennung der doppelten Menge der Reserven) würde wegen der logarithmischen Abhängigkeit der Globaltemperatur von der CO2-Konzentration und der nunmehr nachgewiesenen negativen Rückkoppelung nur zu einer globalen Temperaturerhöhung von 1 °C führen.
-
Klimaskeptiker Info
2009-07-23 de Beobachtungsdaten sprechen für geringe Klimasensitivität
Die AGW-Anhänger sprechen einer Verdopplung des atmosphärischen CO2 gegenüber dem sogenannten "vorindustriellen Niveau" von ca. 280 ppmV einen globalen Temperatureffekt von +2°C bis +6°C zu - die sogenannte Klimasensitivität.
Ein Großteil dieser Klimasensitivität soll sich nach den AGW-Hypothesen aus positiven Rückkopplungen ergeben (die Auswirkungen von Wärme erzeugen mehr Wärme).
Bei der Untersuchung von Beobachtungsdaten (im Gegensatz zur Standard-Methode der AGW-Anhänger, das Klima anhand von Modellen zu untersuchen) kamen jetzt Richard S. Lindzen und Yong-Sang Choi zu anderen Ergebnissen.
Sie haben bei der Analyse von Daten aus dem Earth Radiation Budget Experiment (ERBE) Hinweise auf schwächere oder sogar negative Rückkopplungen gefunden, als sie in den IPCC-Klimamodellen angenommen werden.
"Das beobachtete Verhalten der Strahlungsflüsse impliziert negative Rückkopplungen, verbunden mit relativ geringer Klimasensitivität.
Dies steht im Gegensatz zu dem Verhalten von 11 Atmosphäremodellen.
Daher zeigen die Modelle eine weit größere Klimasensitivität als es von ERBE nahegelegt wird."
Andere Ergebnisse aus den letzten Monaten deuten in dieselbe Richtung:
Die AGW-Anhänger haben die Klimasensitivität von CO2 überschätzt oder übertrieben
-
Whatts Up With That? (Antony Watts)
2009-07-23 en New paper from Lindzen demonstrates low climate sensitivity with observational data
The observed behavior of radiation fluxes implies negative feedback processes associated with relatively low climate sensitivity.
This is the opposite of the behavior of 11 atmospheric models forced by the same SSTs.
Therefore, the models display much higher climate sensitivity than is inferred from ERBE, though it is difficult to pin down such high sensitivities with any precision.
Results also show, the feedback in ERBE is mostly from shortwave radiation while the feedback in the models is mostly from longwave radiation.
Although such a test does not distinguish the mechanisms, this is important since the inconsistency of climate feedbacks constitutes a very fundamental problem in climate prediction.
-
Richard S. Lindzen and Yong-Sang Choi
2009-07-14 en
On the determination of climate feedbacks from ERBE data
-
NASA
2005-05-10 de The Earth Radiation Budget Experiment (ERBE)The radiation budget represents the balance between incoming energy from the Sun and outgoing thermal (longwave) and reflected (shortwave) energy from the Earth.
|
Richard S. Lindzen *1940-02-08 |
Alfred P. Sloan Professor of Meteorology, Department of Earth,
Atmospheric and Planetary Sciences US-Klimatologe, Massachussets Institute of Technology (MIT), Membre de l'Académie des sciences américaine et ex-représentant auprès du GIEC ▶Richard S. Lindzen: Who is who (Skeptiker) ▶Richard S. Lindzen: Who is who (Skeptische Wissenschaftler des IPCC) ▶Richard S. Lindzen: Video (Präsentationen) ▶Ausschluss und Maulkorb für Kritiker (Richard Lindzen und das IPCC) ▶Ausschluss und Maulkorb für Kritiker (Das renommierte amerikanische Museum für nationale Geschichte (AMNH) in New York Opfer des Klimakriegs) |
↑ c Resultate einiger Berechnungen
Resultate einiger Berechnungen:
Die Klimasensitivität dT des CO2
[Temperaturanstieg bei Verdoppelung der
CO2-Konzentration]
-
Lüdecke/Link ΔT = 1 K
-
Lindzen ΔT = 0,95 K
-
Dietze ΔT ≈ 0,6 K
-
IPCC ΔT = 1,2 K
-
Harde ΔT = 0,43 K
-
Hug ΔT = 0,7 K
-
Gray ΔT = 0,2 - 0,3 K
-
Legendre ΔT = 0,4 K
-
Dittrich ΔT = 0,03 K
-
Reinhart ΔT = 0,24 K
⇧
5 Berechnung der Klimasensivität von CO2
en
Calulation of the Climate Sensivity of CO2
fr
Calcul de la sensivité du CO2
- a Allgemein
- Studien
- de
→ Über 60 Studien, welche eine geringe
CO2-Klimasensitivität (<1 °C)
nachweisen
- a Heller
- de Der Treibhauseffekt
- b Penner
- de Atmosphäreneffekt des Kohlendioxids
- c Lüdecke & Link
- de Der Treibhauseffekt
- d Harde
- de Was trägt CO2 wirklich zur globalen Erwärmung bei?
- de Abschätzung der globalen Erwärmung durch CO2 und solaren Einfluss
- e Blaser
- de Überlegungen zum 'Treibhauseffekt'
- f Hug
- de Die Klimakatastrophe - ein spektroskopisches Artefakt?
- de Der anthropogene Treibhauseffekt - eine spektroskopische Geringfügigkeit
- g Legendre
- fr Principes du calcul de l'élévation de température en effet de serre par augmentation du taux de CO2
- h Gray
- de
Ein Weihnachtsgeschenk von Bill Gray
en A Christmas Gift From Dr. Bill Gray - i Dittrich
- de Klimaerwärmung durch Kohlendioxid?
- j Schmithüsen
- de In der Zentralantarktis besitzt der CO2-Treibhauseffekt offenbar keine erwärmende Wirkung
- k Stehlik
- de Warum die "Treibhausgase" die Atmosphäre kühlen
- l Tscheuschner
- de
Widerlegung des CO2-Treibhauseffektes
en Falsification of the CO2 Greenhouse Effect - m Thoenes
- de Meine Ansichten zum Einfluss von CO2 auf das Klima
- n Dietze
- de Zur CO2 Klimasensitivität
- o Reinhart
- de Infrared absorption of atmospheric carbon dioxide
↑ Studien
↑ Über 60 Studien, welche eine geringe CO2-Klimasensitivität (<1 °C) nachweisen
Studien
Über 60 Studien, welche eine geringe CO2-Klimasensitivität (<1 °C) nachweisen
Unter diesem Link findet man eine Zusammenstellung von über 60 wissenschaftlichen Studien mit "extrem niedrigen" Schätzungen numerische Bandbreite 0,02 °C bis <1 °C) der Klimasensitivität bei einer Zunahme der CO2-Konzentrationen um 100%.
2017-07-17 en 60 Papers Find Extremely Low CO2 Climate Sensitivity
Quelle / Source: NoTricksZone (Pierre L. Gosselin)
(a) Quantified Low Climate Sensitivity to CO2
Florides and Christodoulides, 2009
(2x CO2 = ~0.02 °C)
A very recent development on the greenhouse phenomenon is a validated
adiabatic model, based on laws of physics, forecasting a maximum
temperature-increase of 0.01 - 0.03 °C for a value doubling the present
concentration of atmospheric CO2.
Newell and Dopplick, 1979
(2x CO2 = ~0.25 °C )
Estimates of the atmospheric temperature changes due to a doubling of
CO2 concentration have be with a standard
radiative flux model.
The conclusion is that at low latitudes the influence of doubling
CO2 on surface temperatures is less than 0.25 K
Idso, 1998 (2x CO2 = ~0.4 °C)
These studies all suggest that a 300 to 600 ppm doubling of the
atmosphere's CO2 concentration could raise
the planet's mean surface air temperature by only about 0.4 °C.
Chylek et al., 2007 (2x CO2 = 0.39 °C)
We find the empirical climate sensitivity to be between 0.29 and
0.48 K/Wm-2 when aerosol direct and indirect radiative forcing is
included.
Gates et al., 1981 (2x CO2 = 0.3 °C)
In January the globally averaged tropospheric temperature is increased
with respect to the control mean by 0.30 °C for doubled
and 0.48 °C for quadrupledled CO2.
Gray, 2009 (2x CO2 = ~0.4 °C)
Assuming a doubling of CO2 by the late 21st
century (assuming no positive water vapor feedback), we should likely
expect to see no more than about 0.3 - 0.5 °C global surface warming.
Harde, 2014 (2x CO2 = 0.6 °C)
Simulations including an increased solar activity over the last century
give a CO2 initiated warming of 0.2 °C
and a solar influence of 0.54 °C over this period,
corresponding to a CO2 climate sensitivity
of 0.6 °C (doubling of CO2).
Ollila, 2012 (2x CO2 = 0.51 °C)
A doubling of the present level of CO2
would increase the global temperature by only 0.51 °C without water
feedback.
Zdunkowski et al., 1975., 1975 (2x CO2 = 0.5 °C)
It is found that doubling the carbon dioxide concentration increases
the temperature near the ground by approximately one-half of one degree
[0.5 °C] if clouds are absent.
(A sevenfold [700%] increase of the present normal carbon dioxide
concentration increases the temperature near the ground by approximately
one degree.)
Idso, 1980 (2x CO2 = ≤0.26 °C )
The mean global increase in thermal radiation received at the surface
of the earth as a consequence of a doubling of the atmospheric carbon
dioxide content ... a value of ≤0.26 K for the resultant change in
the mean global surface air temperature.
Schuurmans, 1983 (2x CO2 = ~0.3 °C )
From his review we may conclude that there is some general agreement
amongst different modellers that the transient response of global mean
temperature to increased CO2 concentration
of the atmosphere at present amounts to less than 0.5 K
(estimates of [temperature response] now varying between 0.2 and 0.4 K).
Weare and Snell, 1974 (2x CO2 = 0.7 °C )
a doubling of CO2 increase the mean
annual global surface temperature according to our dynamical model
by about 0.7 K,
(A sixfold increase only increases the temperature 1.7 K.
The nonlinearity is due to saturation of the 15 µm band).
Lindzen and Choi, 2011 (2x CO2 = 0.7 °C)
As a result, the climate sensitivity for a doubling of
CO2 is estimated to be 0.7K
(with the confidence interval 0.5 K - 1.3 K at 99% levels).
Kimoto, 2015 (2x CO2= ~0.16 °C)
The surface climate sensitivity is 0.14 - 0.17 K in this study
with the surface radiative forcing of 1.1 W/m2.
Ollila, 2014 (2x CO2 = ~0.27 °C)
According to the analyzed results, the equilibrium CS (ECS) is at
maximum 0.6 °C and the best estimate of l is 0.268 K/(Wm-2 )
without any feedback mechanisms.
Harde, 2016 (2x CO2 = 0.7 °C)
Including solar and cloud effects as well as all relevant feedback
processes our simulations give an equilibrium climate sensitivity of
CS = 0.7 °C (temperature increase at doubled
CO2)
Bates, 2016 (2x CO2 = ~1nbsp;°C)
When applied using satellite radiation data, these give low and
tightly-constrained EfCS values, in the neighbourhood of 1 °C.
Evans, 2016 (2x CO2 = <0.5 °C)
We find that the equilibrium climate sensitivity is most likely less
than 0.5 °C, increasing CO2 most likely
caused less than 20% of the global warming from the 1970s, and the
CO2 response is less than one-third as strong
as the solar response.
Gervais, 2016
[
full] (2x CO2 = <0.6 °C)
To be at most 0.6 °C once the natural component has been removed,
consistent with latest infrared studies
Soon, Connolly, and Connolly, 2015
[
full] (2x [400 ppm]
CO2 = 0.44 °C)
If atmospheric carbon dioxide concentrations were to increase
by ~400 ppmv, this would contribute to at most 0.0011 × 400 =
0.44 °C warming. That is, the climate sensitivity to atmospheric carbon
dioxide is at most 0.44 °C.
Reinhart, 2017 (2x [400 ppm] CO2 =
0.24 °C)
A doubling [to 800 ppm] of the present level of
CO2 [400 ppm] results in [temperature change]
< 0.24 K.
Balling Jr, 1994 (2x CO2 = <1.0 °C)
The temperature record of the past century suggests that a doubling
of carbon dioxide will produce a global temperature response at the
lowest end of the model predictions - probably not more than 1.0 °C.
Bellamy, 2007 (2x CO2= <1.0 °C)
This paper demonstrates that the widely prophesied doubling of
atmospheric carbon dioxide levels from natural, pre-industrial
values will enhance the so-called 'greenhouse effect' but will amount
to less than 1 °C of global warming.
(b) Non-Quantified 'Practically No Effect', 'Close To Zero' CO2 Climate Sensitivity
Chillingar, 2009
Even significant releases of the anthropogenic carbon dioxide into
the atmosphere do not change average parameters of the Earth's heat
regime and the atmospheric greenhouse effect.
Dunbar, 1976
If the concentration were to increase from the present level of
320 parts per million to about 400 by the year 2000, the predicted
increase in surface global temperature would be about 0.1 °C.
![]() Miskolczi, 2010
Miskolczi, 2010
(AGW) estimates based on the classic greenhouse theory and
CO2 doubling experiments (usually
conducted by general circulation models) are totally wrong.
The observed true infrared optical thickness of the clear atmosphere
is 1.87 and this value proved to be very stable in the last 61 years.
Möller, 1963
The effect of an increase in CO2 from
300 to 330 ppm can be compensated for completely by a change
in the water vapor content of 3 per cent or by a change in
the cloudiness of 1 per cent of its value without the
occurrence of temperature changes at all.
Thus the theory that climatic variations are affected by variations
in the CO2 content becomes very questionable.
Singer, 2006
This finding is shown to put constraints on surface trend and Climate
Sensitivity, limiting them to values close to zero.
Willett, 1974
"Either doubling or halving the present amount of carbon dioxide could
alter but little the total amount of radiation actually absorbed by the
atmosphere, and, therefore, seemingly, could not appreciably change
the average temperature of the earth, or be at all effective in the
production of marked climatic changes."
Recent increases of atmospheric carbon dioxide have contributed
much less than 5 % of the recent changes of atmospheric temperature,
and will contribute no more than that in the foreseeable future.
Sagan and Mullen, 1972
Major variations in the CO2 abundance will
have only minor greenhouse effects because the strongest bands are
nearly saturated.
Oliver, 1976
Neither tropospheric particulates [anthropogenic pollution] nor
atmospheric CO2, in concert or separately,
could have accounted for the major part of the observed temperature
changes of the past century.
Clark, 2010 (
full paper)
It is impossible to show that changes in CO2
concentration have caused any climate change
Ramanathan et al., 1989
The greenhouse effect of clouds may be larger than that resulting from
a hundredfold increase in the CO2
concentration of the atmosphere.
Khilyuk and Chilingar, 2006 (
full)
Humans may be responsible for less than 0.01 °C
(of approximately 0.56 °C (1 °F) total average atmospheric
heating during the last century
Newell and Dopplick, 1970
The greenhouse theory as usually discussed puts such a "heating"
interpretation on the CO2 changes even
though the actual effect of a CO2 increase
is to diminish the cooling rate.
The term greenhouse is of dubious applicability.
Manabe and Möller, 1961
The heating due to the absorption of solar radiation by carbon dioxide
is still small compared with the effects of other processes.
Libby, 1970
Though dire effects on climate of an increase in
CO2 have been predicted, they are far from
being established.
Gervais, 2014
The anthropogenic CO2 additional warming
extrapolated in 2100 is found lower than 0.1 °C in the absence
of feedbacks.
The tiny anthropogenic warming appears consistent with the absence
of any detectable change of slope of the 130-year-long linear
contribution to the temperature data before and after the onset
of large CO2 emissions.
Rasool and Schneider, 1971
It is found that even an increase by a factor of 8 in the amount of
CO2, which is highly unlikely in the next
several thousand years, will produce an increase in the surface
temperature of less than 2 K.
Chilingar et al., 2014
Even significant releases of anthropogenic carbon dioxide and
methane into the atmosphere do not change average parameters of the
Earth's heat regime and have no essential effect on the Earth's climate.
Thus, petroleum production and other anthropogenic activities
resulting in accumulation of additional amounts of methane and
carbon dioxide in the atmosphere have practically no effect on
the Earth's climate.
Ludwig et al., 1973
There have been a number of theoretical models developed in which the
effect of the CO2 increase is linked with a
mean global temperature increase.
In general, these models have not been too successful because the end
results were unreasonably sensitive to minor changes in some critical
assumptions.
Singer, 1976
Water vapor is about 10 times more important than carbon dioxide,
both for radiative heating by absorbing solar radiation and for
radiative cooling.
In the stratosphere, however, radiative heating by the absorption
of solar radiation by ozone is dominant.
Kauppinen et al., 2014
In the time periods mentioned before the contribution of the
CO2 increase was less than 10 % to
the total temperature change.
Lightfoot and Mamer, 2014
Each method shows that, on average, water vapour contributes
approximately 96 % of current greenhouse gas warming.
CO2 accounts for 2.7 % of the global
warming while all of the other gases account for approximately
0.7 % for a total of approximately 3.4 %
Water molecules are 1.6 times more effective at warming than
CO2 molecules.
Using this value and the ratio of 22.7:1, the contribution of
CO2 to warming of the atmosphere is
approximately (1/22.7)/1.6 = 2.8 % of that of water vapour.
Arrak, 2011
Arctic Warming is Not Greenhouse Warming
After two thousand years of slow cooling Arctic, warming suddenly
began more than a century ago.
It has continued, with a break in the middle, until this day.
The rapid start of this warming rules out the greenhouse effect as
its cause.
All observations of Arctic warming can be accounted for as
consequences of these flows of warm water to the Arctic.
This explains why all attempts to model Arctic warming have failed:
Models set up for greenhouse warming are the wrong models for
non-greenhouse warming.
Kahl et al., 1993
Absence of evidence of greenhouse warming over the Arctic Ocean in the
past 40 years.
The lack of widespread significant warming trends leads us to conclude
that there is no strong evidence to support model simulations of
greenhouse warming over the Arctic Ocean for the period 1950-1990.
Robock, 1979
Carbon dioxide produced by fossil fuel burning does not seem to have had
a significant effect on climatic change as yet.
Fang et al., 2011
The dominant role of the increase in the atmospheric concentration of
greenhouse gases (including CO2) in the
global warming claimed by the Intergovernmental Panel on Climate
Change (IPCC) is questioned by the scientific communities because of
large uncertainties in the mechanisms of natural factors and
anthropogenic activities and in the sources of the increased
atmospheric CO2 concentration.
Hertzberg et al., 2017
This study examines the concept of 'greenhouse gases' and various
definitions of the phenomenon known as the 'Atmospheric Radiative
Greenhouse Effect'.
It is shown that none of the above descriptions can withstand the
rigours of scientific scrutiny when the fundamental laws of physics
and thermodynamics are applied to them.
Sawyer, 1972
man-made energy is still small compared with the energy of meteorological
systems.
The total mass of the atmosphere is more than 500 times the mass of
the known coal reserves, for example, and human activities will not
change its chief constituents.
Even a doubling of the amount of carbon dioxide in the atmosphere,
which would probably require the burning of a large part of the
known fuel reserves, would appear to result in a rise of temperature
little above that experienced in the climatic optimum which followed
the last ice age.
Gerlich and Tscheuschner, 2009
Falsification Of The Atmospheric CO2
Greenhouse Effects Within The Frame Of Physics.
Global climatologists claim that the Earth's natural greenhouse effect
keeps the Earth 33°C warmer than it would be without the trace gases
in the atmosphere.
About 80 percent of this warming is attributed to water vapor and
20 percent to the 0.03 volume percent CO2.
If such an extreme effect existed, it would show up even in a laboratory
experiment involving concentrated CO2 as a
thermal conductivity anomaly.
It would manifest itself as a new kind of 'superinsulation' violating
the conventional heat conduction equation.
However, for CO2 such anomalous heat
transport properties never have been observed.
Miskolczi, 2014
Many authors have proposed a greenhouse effect due to anthropogenic
carbon dioxide emissions.
The present analysis shows that such an effect is impossible.
Ollila, 2013
The analysis also reveals that IPCC's scenario presentation contains
choices, which make the warming results look higher than they should be.
All the climate sensitivity values above 1.7 °C conflict with the
explanation given by IPCC for the 1750 - 2005 periods.
Dyson, 1977
In summary, there is insufficient evidence to decide whether the
carbon content of the biosphere has decreased, increased or remained
stationary in response to the manifold human activities of recent decades.
Hertzberg and Schreuder, 2016
Nothing in the data supports the supposition that atmospheric
CO2 is a driver of weather or climate, or
that human emissions control atmospheric CO2.
Avakyan, 2013
The contribution of the greenhouse effect of carbon-containing gases to
global warming turns out to be insignificant.
Zhao, 2011
We find little evidence in support of the notion that recent global
warming is mainly due to CO2 emissions.
(c) Rising CO2 Causes Surface Cooling
Choudhury and Kukla, 1979
Impact of CO2 on cooling of snow and water surfaces
CO2 significantly reduces the shortwave
energy absorbed by the surface of snow and water.
The energy deficit, when not compensated by downward atmospheric
radiation, may delay the recrystallisation of snow and dissipation
of pack-ice and result in a cooling rather than a warming
effect.
Idso, 1984
The true climatic effect of increasing the
CO2 content of the atmosphere may be
to cool the Earth and not warm it.
This finding suggests that we will not suffer any great climatic
catastrophe but will instead reap great agricultural benefits from
the rapid increase in atmospheric CO2
which we are currently experiencing and which is projected to continue
for perhaps another century or two into the future.
Ellsaesser, 1984
If the top of this CO2 greenhouse blanket
were to be raised by the addition of CO2
and maintained at constant temperature, this would have little or no
effect on the temperature at the surface and, if anything,
might cause the surface to cool.
Bryson and Dittberner, 1976
We calculate an expected slight decrease in surface temperature with
an increase in CO2 content.
Schmithüsen et al., 2015
For this Central Antarctica the emission to space is higher than the
surface emission; and the greenhouse effect of
CO2 is around zero or even
negative.
↑ a Heller
↑
Der Treibhauseffekt
(Peter Heller)
|
|
|

-
Science Skeptical Blog
Peter Heller
2010-02-04 de Der TreibhauseffektVorbemerkung:
Nun ja, "Treibhauseffekt" ist halt der eingeführte Begriff, obwohl er mit den Vorgängen in einem realen Treibhaus nicht viel gemein hat.
"Atmosphäreneffekt" wäre vielleicht angemessener.
Egal, ich will verstanden werden und passe mich daher dem Mainstream an. Bleiben wir also bei "Treibhauseffekt".
Aus dem Inhalt
- Erde und Sonne
- Warum ist die Luft am Erdboden wärmer, als in der Höhe?
- Die Treibhausgase
- Der Treibhauseffekt
- Der Treibhausprozeß - Worüber wird gestritten?
↑ b Penner
↑
Atmosphäreneffekt des Kohlendioxids
(Hans Penner)
-
Dr. Hans Penner
2011-12-28 de
Atmosphäreneffekt des Kohlendioxids
Aus dem Inhaltsverzeichnis
- Entstehung der Treibhaus-Hypothese
- Ablehnung der Treibhaus-Hypothese
- Infrarotabstrahlung der Erdoberfläche
- Infrarot-Absorption durch Kohlendioxid in der unteren Troposphäre
- Infrarot-Absorption durch Kohlendioxid in der oberen Troposphäre
- Energieübergänge in der Atmosphäre
- Sättigung der IR-Absorption durch Kohlendioxid
- Thermalisierung der absorbierten Energie
- Wärmetransport
↑ c Lüdecke & Link
↑
Der Treibhauseffekt
(Horst-Joachim Lüdecke & Rainer Link)
-
Prof. Dr. Horst-Joachim Lüdecke & Dr. Rainer Link
2010-01 de
Der Treibhauseffekt
Resultate einiger Berechnungen:
Die Klimasensitivität dT des CO2
[Temperaturanstieg bei Verdoppelung der
CO2-Konzentration]
-
Lüdecke/Link ΔT = 1 K
-
Lindzen ΔT = 0,95 K
-
Dietze ΔT ≈ 0,6 K
-
IPCC ΔT = 1,2 K
-
Harde ΔT = 0,43 K
-
Hug ΔT = 0,7 K
-
Gray ΔT = 0,2 - 0,3 K
-
Legendre ΔT = 0,4 K
-
Dittrich ΔT = 0,03 K
-
Reinhart ΔT = 0,24 K
| Horst-Joachim Lüdecke |
Prof. a.D. Dr., Dipl.-Physiker, Heidelberg Hochschule für Technik und Wirtschaft des Saarlandes Pressesprecher des Europäischen Instituts für Klima und Energie (EIKE) ▶Horst-Joachim Lüdecke:Who is who (Skeptiker) ▶Horst-Joachim Lüdecke: Video (Präsentationen) ▶Ausschluss und Maulkorb für Kritiker (Gleichschaltung des Direktoriums vom Alfred-Wegener-Institut in der Klima-Berichtserstattung) ▶Ausschluss und Maulkorb für Kritiker (Das renommierte amerikanische Museum für nationale Geschichte (AMNH) in New York Opfer des Klimakriegs) |
↑ d Harde
↑
Was trägt CO2 wirklich zur globalen
Erwärmung bei?
(Hermann Harde)
de
![]() Was trägt CO2 wirklich zur globalen
Erwärmung bei?
(
Quelle)
Was trägt CO2 wirklich zur globalen
Erwärmung bei?
(
Quelle)
↑
Abschätzung der globalen Erwärmung durch
CO2 und solaren Einfluss
(Hermann Harde)
-
EIKE Europäisches Institut für Klima und Energie
Dr. Heinz Hug
2014-09-30 de Abschätzung der globalen Erwärmung durch CO2 und solaren EinflussDie Klimasensitivität wurde vom IPCC auf im Mittel 3,0 K (AR4) als wahrscheinlichstem Wert bestimmt, andere ermitteln Werte von 1,73 oder 1 oder auch nur 0,43 K.
Darüber wird sehr heftig gestritten.
Unser Autor Prof. Hermann Harde, anerkannter Physiker und Spektralanalytiker, hat seine Ergebnisse hierzu aufgeschrieben.
Sein Wert ist 0,43 K
↑ e Blaser
↑
Überlegungen zum 'Treibhauseffekt'
(Jean-Pierre Blaser)
-
J.P. Blaser
2012-01-30 de
Überlegungen zum 'Treibhauseffekt'
| Jean-Pierre Blaser |
Dr. Professor of physics at ETH-Zurich, Former Director of the Paul Scherrer Institute PSI |
↑ f Hug
↑
Die Klimakatastrophe - ein spektroskopisches Artefakt?
(Heinz Hug
-
Dr. rer. nat. Heinz Hug
1998-07-31 de Die Klimakatastrophe - ein spektroskopisches Artefakt?
↑
Der anthropogene Treibhauseffekt - eine spektroskopische Geringfügigkeit
(Heinz Hug)
-
EIKE Europäisches Institut für Klima und Energie
Dr. Heinz Hug
2012-08-20 de Der anthropogene Treibhauseffekt - eine spektroskopische Geringfügigkeit
2012-08-10 de
Der anthropogene Treibhauseffekt - eine spektroskopische Geringfügigkeit
Im Februar 2011 brachten wir unter dem Titel "Die Klimakatastrophe - ein spektroskopisches Artefakt!" einen Beitrag des Chemikers und Spektralanalysten - Dr. Heinz Hug zum genannten Thema.
Die dort dargestellten Ergebnisse regte viele Kommentatoren an, sich überwiegend sachlich, ebenso zustimmend wie ablehnend, zu äußern.
Weil Dr. Hug, die Kommentare zum Anlass nahm seinen Aufsatz nochmals zu überarbeiten, haben wir die Kommentarfunktion nach über 200 Kommentaren am alten Beitrag abgestellt und den Beitrag selbst (vom Februar 2011) vom Netz genommen.
Stattdessen erscheint hier der vollständig überarbeitete neue Beitrag in voller Länge. Zusammengefasst gesagt.
Vieles ist jetzt genauer dargestellt, jedoch bleibt die Botschaft unverändert: Der anthropogene Treibhauseffekt bleibt eine spektroskopische Geringfügigkeit.
Resultat:
Die Klimasensitivität dT des CO2
[Temperaturanstieg bei Verdoppelung der CO2-Konzentration]- Hug: Δ T = 0,7 K
Die Wasserdampfverstärkung
Da eine Erwärmung von lediglich 0,7 °C bei 100 % mehr CO2 zu wenig erscheint, hat man sich vor Jahren darauf geeinigt, dass diese geringfügige Temperaturerhöhung gemäß der altbekannten Clausius-Clapeyronschen-Gleichung deutlich mehr Wasser aus den Ozeanen verdunsten lasse.
Originalton IPCC:
Weil Wasserdampf ein Treibhausgas ist, fällt deshalb Temperaturerhöhung durch CO2 wesentlich höher aus.
"Der 'Wasserdampf-Feedback' ist nach wie vor der durchweg wichtigste Rückkopplungseffekt, der die von den allgemeinen Zirkulationsmodellen als Reaktion auf eine CO2-Verdopplung vorhergesagte globale Erwärmung verursacht."
Prozentuale Abweichung des Wasserdampfgehalts über dem Atlantik

Wenn dies richtig ist, muss besonders in einer kälteren Periode, während der die direkte Solarstrahlung nicht so viel Wasser verdunsten lässt, dennoch der Wasserdampfgehalt (Balken) über den Ozeanen parallel mit dem atmosphärischen CO2-Gehalt ansteigen (rote Strich-Punkt-Linie).
Dies ist eindeutig nicht der Fall.
Deshalb können sich die Klimamodellierer auf keinen Fall auf den durchaus einleuchtenden, hypothetischen Wasserdampf-Verstärkungsmechanismus berufen, der eine viel zu große Temperatursteigerung prophezeit.
| de | en | fr |
|---|---|---|
|
Fehler der Klimamacher, Teil I Falscher CO2-Verstärkungseffekt des IPCC |
Errors, Part I Wrong CO2 Amplifying Effekt of the IPCC |
Erreurs, partie I Faux effet d'amplification du CO2 du GIEC |
| Der Streit um die Rückkopplungen | The argument about the feedbacks | L'argument des rétroactions |
| de | en | fr |
|---|---|---|
| Physikalische Aspekte | Physical aspects | Aspects physiques |
| Kritik am Treibhauseffekt und an der Gegenstrahlung | Criticism of the Greenhouse Effect and of the back-radiation | Critiques de l'effet de serre et du forçage radiatif (back-warming) |
| ⇒ Google Web | de | treibhauseffekt eike |
↑ g Legendre
↑
fr
Principes du calcul de l'élévation de température en effet de serre
par augmentation du taux de CO2
(André Legendre)
-
André Legendre
L'homme est-il responsable du réchauffement climatique?
Principes du calcul de l'élévation de température en effet de serre
par augmentation du taux de CO2
Conclusion:
- L'effet de serre additionnel résultant de l'émission anthropogénique de CO2 ne peut avoir qu'un effet limité et les prévisions alarmistes des modèles actuels du GIEC (Elévation de température comprise entre 1,5°C et 4,5°C pour un doublement du taux de CO2) ne sont pas justifiées par les lois de la physique.
- Celles-ci ne permettent en l'état actuel des connaissances de ne justifier qu'une élévation de température de 0,4 °C.
Resultat:
Die Klimasensitivität dT des CO2
[Temperaturanstieg bei Verdoppelung der CO2-Konzentration]- Legendre: Δ T = 0,4 K
↑ h Gray
↑
Ein Weihnachtsgeschenk von Bill Gray
en A Christmas Gift From Dr. Bill Gray
-
EIKE Europäisches Institut für Klima und Energie
2014-12-30 de Ein Weihnachtsgeschenk von Bill GraySchlussfolgerung:
Hiermit sollten wir erwarten, dass die wirkliche Größenordnung der globalen Erwärmung aufgrund einer CO2-Verdoppelung höchstens 0,2°C bis 0,3°C betragen muss, das sind 5 bis 10 Prozent der Erwärmung, die von vielen globalen Modellen mit 2°C bis 4°C simuliert worden ist.
Die AGW-Bedrohung und vor allem die katastrophale AGW (CAGW) kann keine realistische Abbildung dessen sein, wie das Klimasystem des Planeten funktioniert.
-
Real Science (Steven Goddard)
2014-12-24 en A Christmas Gift From Dr. Bill GrayConclusion:
We show that there is a very modest degree of negative water-vapor feedback of 0.1 to 0.2oC. With this occurring we should expect that the real amount of global warming that will occur from a doubling of CO2 would be only about 0.2-0.3°C or about 5-10 percent the amount projected by the many global models of 2-4°C.
The AGW threat and especially the catastrophic AGW (or CAGW) threat cannot be a realistic assertion of how the planet's climate system functions.
↑ i Dittrich
↑ Klimaerwärmung durch Kohlendioxid?
-
EIKE Europäisches Institut für Klima und Energie
Dr. S. Dittrich
2015-03-05 de Klimaerwärmung durch Kohlendioxid?Das Ganze geht alles auf neueste Rückstrahlungsmessungen zurück, die kürzlich in einem Aufsatz der Zeitschrift "Nature" veröffentlicht worden sind.
Aber hat denn überhaupt keiner der Interpreten gemerkt, dass durch diese Messungen genau das Gegenteil des oben Gesagten bewiesen wurde, nämlich nichts anderes als das, was seriöse Klimakritiker immer schon über den anthropogenen Treibhauseffekt ausgesagt haben.
Die von "Nature" bekanntgegebene Zahl für die CO2-bedingte Zunahme der Rückstrahlung von 0,2 Watt/m2 pro Jahrzehnt ist doch in Wirklichkeit nicht mehr als eine Lappalie.
Wie soll sich davor eigentlich die Erde erschrecken, wenn auf den umlaufenden Äquatorboden zur Mittagszeit ständig 1367 Watt pro Quadratmeter niederprasseln.
Die wechselnden Abweichungen von diesem als "Solarkonstante" bezeichneten Mittelwert sind sogar deutlich größer als die o.g. 0,2 Watt/m2.
Laut dem sog. Weltklimarat IPCC beträgt die Rückstrahlungszunahme im Falle einer Verdoppelung des CO2-Gehalts genau 3,7 Watt/m2, was inzwischen durch neutrale Gegenprüfung mehrfach bestätigt wurde.
Im letzten Jahrzehnt hat sich der CO2-Gehalt der Atmosphäre um ca. 20 ppm erhöht (Millionstel Volumenanteile).
Z.Z. liegt er bei 400 ppm. Hieraus kann schon jeder Oberschüler ermitteln, dass sich daraus ein Rückstrahlungszuwachs von ca. 0,2 Watt/m2 ergibt, was durch die o.g. Messungen nur noch nachtäglich bestätigt wird.
Auch die dadurch bedingte globale Temperaturerhöhung kann recht genau mit einer auch vom IPCC benutzten Formel errechnet werden, die sich aus dem Strahlungsgesetz von Stefan-Boltzmann widerspruchsfrei ableiten lässt.
dT = mittlere Globaltemperatur x Rückstrahlungszuwachs / mittlere Erdabstrahlung x 4
dT = 288 K x 0,2 Watt/m2 : 240 Watt/m2 x 4 = 0,06 K = 0,06°C
In "Nature" ist ausdrücklich vermerkt, dass die gemessene Differenz der Rückstrahlung von 0,2 Watt/m2 sich nur auf wolkenfreie Zonen der Erde bezieht.
Bei 40% durchschnittlicher Wolkenbedeckung und einer 30%-igen Überlappung des CO2-Absorptionsspektrums durch den allgegenwärtigen Wasserdampf ist der oben errechnete Temperaturwert daher noch von 0,06°C auf 0,03°C zu reduzieren.
Es handelt sich hier also in Wirklichkeit um einen kaum messbaren Effekt, der auch zusammen mit einer fiktiven Wasserdampfrückkoppelung nichts Dramatisches bewirken kann, womit die immer schon überflüssig gewesene Energiewende endgültig ad absurdum geführt ist.
Dass der Focus alle oben beschriebenen Fehlinterpretationen völlig unkritisch weitergegeben hat, ist mehr als bedauernswert und sollte daher dringend einer Korrektur unterzogen werden.
-
Watts Up With That? (Antony Watts)
2015-02-25 en Almost 30 years after Hansen's 1988 "alarm" on global warming, a claim of confirmation on CO2 forcing
↑ j Schmithüsen
↑ In der Zentralantarktis besitzt der CO2-Treibhauseffekt offenbar keine erwärmende Wirkung
-
Die kalte Sonne (Fritz Vahrenholt & Sebastian Lüning) / Frank Bosse
2015-06-21 de Unerwartete Entdeckung im Rahmen einer Doktorarbeit an der Universität Bremen: In der Zentralantarktis besitzt der CO2-Treibhauseffekt offenbar keine erwärmende WirkungDer Treibhauseffekt ist Zentralpunkt der Klimadiskussion.
Der WWF erklärt ihn wie folgt:
Sonnenstrahlen treffen als ultraviolette Strahlung (UV) auf die Erdoberfläche und erwärmen diese.
Ein Teil dieser Energie wird in Form von langwelliger infraroter Strahlung reflektiert, also wieder Richtung Weltraum zurückgeworfen.
Von dieser reflektierten infraroten Strahlung wiederum wird ein Teil in der Atmosphäre von Gasen wie Wasserdampf, Ozon, Kohlendioxid (CO2) und anderen quasi zurückgehalten.
Diese langwellige infrarote Sonnenstrahlung fällt zur Erde zurück und erwärmt sie wie ein Treibhaus.
Dieser natürliche Treibhauseffekt ist damit so etwas wie eine gigantische, erdumspannende Temperaturregelung, die Leben unter den herrschenden Bedingungen ermöglicht.
Gibt es diese Verstärker wirklich?
Mehr CO2 bedeutet mehr Rückstrahlung Richtung Boden, also Erwärmung.
Im Normalfall erhöht sich die Temperatur um 1,1°C pro CO2-Verdopplung, wie theoretische Berechnungen zeigen.
Nun hat der IPCC jedoch eine ganze Reihe von fragwürdigen "Verstärkerprozessen" in die Gleichungen eingebaut, was letztendlich dreifach überhöhte Werte für die Klimasensitivität des CO2 geliefert hat.
Gibt es diese Verstärker wirklich?
An der Universität Bremen wurde im Dezember 2014 eine hochinteressante Doktorarbeit zur Treibhauswirkung des CO2 fertiggestellt.
Holger Schmithüsen ging dabei der Frage nach, ob der Treibhauseffekt wirklich stets erwärmt, oder ob es regionale Unterschiede gibt. Das Ergebnis von Schmithüsens Dissertation ist spektakulär:
In der zentralen Antarktis gilt die pauschale Annahme offenbar nicht. Mehr CO2 bewirkt hier nämlich rein gar nichts. Und noch überraschender:
Zu bestimmten Jahrezeiten hat das CO2 sogar einen kühlenden Effekt.
Quelle / Source
-
Staats- und Universitätsbibliothek Bremen
Holger Schmithüsen
2015-03-05 de Antarctic Specific Features of the Greenhouse Effect : A Radiative Analysis Using Measurements and ModelsVolltext
2014-12-10 de
Antarctic Specific Features of the Greenhouse Effect:
A Radiative Analysis Using Measurements and Models
Siehe auch / See also
-
Die kalte Sonne (Fritz Vahrenholt & Sebastian Lüning)
2015-06-17 de Klimamodellierer haben ein riesiges Problem: Modelle können Zunahme des antarktischen Meereises nicht reproduzieren
↑ k Stehlik
↑ Warum die "Treibhausgase" die Atmosphäre kühlen
-
Gerhard Stehlik
Home de CO2 kühlt und wärmt nicht! VDI
Kolloqium
2011-05-19de "Die physikalischen und chemischen Eigenschaften von Erdoberflächenkomponenten"
1
2
de
"Die physikalischen und chemischen Eigenschaften von
Erdoberflächenkomponenten"
en
"Physical and Chemical Properties of Earth Surface Components"
| Gerhard Stehlik |
Diplomchemiker Dr. rer. nat.
▶Gerhard Stehlik: Who is who (Skeptiker) ▶Gerhard Stehlik: Video (Präsentationen) ▶Gerhard Stehlik: Webseiten (Deutsch) |
↑ l Tscheuschner
↑
Widerlegung des CO2-Treibhauseffektes
en Falsification of the
CO2 Greenhouse Effect
-
-
Ralf Tscheuschner, Gerhard Gerlich, sowie den Meteorologen Wolfgang Thüne.
2018-06-10 de
LÜCKENLOS entlarvt - Klimawandel - Klimaschwindel -
Lehrfilm über die Treibhauseffekt- und CO₂-Lüge
"LÜCKENLOS entlarvt" ist ein Lehrfilm über die Treibhauseffekt- und CO₂-Lüge, sowie über die Lüge des menschengemachten Klimawandels.
In diesem Video sehen und hören Sie den unabhängigen Physiker Ralf Tscheuschner, Gerhard Gerlich, sowie den Meteorologen Wolfgang Thüne.
Die drei Naturwissenschaftler entlarven den Klimaschwindel lückenlos und führen sämtliche gängigen Klimalügen ad absurdum.
Der Film "LÜCKENLOS entlarvt" wird für den Schulunterricht, wie auch zu Studienzwecken an Universitäten empfohlen.
-
|
Ralf D. Tscheuschner *1956 †2020-08-21 |
Dr. Dipl.-Phys. D-22237 Hamburg
▶Ralf D. Tscheuschner: Who is who (Skeptiker) ▶Ralf D. Tscheuschner: Video (Präsentationen) ▶Ralf D. Tscheuschner: Websites (Deutsch) ▶Ralf D. Tscheuschner: Websites (English) |
↑ m Thoenes
↑ Meine Ansichten zum Einfluss von CO2 auf das Klima
-
EIKE Europäisches Institut für Klima und Energie
Dick Thoenes, Professor em. für Chemie-Ingenieurwesen an der Eindhoven University
2015-06-23 de Meine Ansichten zum Einfluss von CO2 auf das KlimaDer Treibhauseffekt von CO2 ist bisher weder in Laborexperimenten noch über realen Beobachtungen bestätigt worden.
Tatsächlich ist nicht schlüssig gezeigt worden, dass eine CO2-Zunahme in der Atmosphäre einen definitiven Einfluss auf das Klima hat.
Wir wissen, dass von der Infrarotstrahlung, die durch CO2 absorbiert werden kann, bereits über 90% schon absorbiert und in Wärme umgewandelt worden sind.
Wenn der CO2-Gehalt steigt, kann die Absorption natürlich niemals über 100% steigen.
Dies wird zu einer Erwärmung unter 2°C führen.
Wir wissen jedoch auch, dass dies mehr Vorteile als Nachteile hätte.
↑ n Dietze
↑ Zur CO2 Klimasensitivität
-
EIKE Europäisches Institut für Klima und Energie
Peter Dietze
2016-10-22 de Zur CO2 KlimasensitivitätDurch die vielen unterschiedlichen Werte der Klimasensitivität in der Fachliteratur (Equilibrium Climate Sensitivity ECS), welche über die Jahre stetig abnahmen, entsteht der Eindruck, der richtige Wert sei noch unbekannt.
Diese Verwirrung macht sich das IPCC zunutze und rechnet noch immer mit dem absurd falschen, weil viel zu hohen "best guess" von 3 Grad,
anstatt mit dem korrekten Wert von 0,6 Grad.
Mit 0,6 Grad wird das CO2-Problem nunmehr zum kompletten "Nonproblem" (Zitat: Physiknobelpreisträger Ivar Giaever).
Die Aufmerksamkeit von Forschung und Öffentlichkeit sollte sich daher endlich wieder den echten Problemen zuwenden.
Dipl.-Ing. Peter Dietze
2016-10-19 de
Berechnung der CO2-Klimasensitivität
↑ o Reinhart
↑ Infrared absorption capability of atmospheric carbon dioxide
-
EIKE Europäisches Institut für Klima und Energie
2017-07-23 de Schweizer Physiker: IPCC-Hypothesen 'vergewaltigen die Realität' ... CO2 nur ein 'sehr schwaches Treibhausgas'Einleitung
Ein Schweizer Wissenschaftler, der bekannt ist für die Veröffentlichung hunderter physikalischer Studien in Physik-Journalen war Autor einer neuen wissenschaftlichen Studie, welche ernsthafte Zweifel hinsichtlich der Effektivität von CO2 als Treibhausgas bzgl. des Einflusses auf die globale Temperatur aufwirft.
Die Studie fügte sich ein in den zunehmenden Umfang begutachteter wissenschaftlicher Studien, welche die Schätzungen einer hohen Klimasensitivität deutlich erhöhter CO2-Konzentrationen ernsthaft in Zweifel zieht.
Kernthesen
CO2 ist ein sehr schwaches Treibhausgas: löste eine Erwärmung der globalen Temperaturen seit 1850 um nur 0,12 °C aus.
-
Unsere Ergebnisse lassen nur den Schluss zu, dass CO2 EIN SEHR SCHWACHES TREIBHAUSGAS ist und nicht als Haupttreiber von Klimawandel in Frage kommen kann.
-
Die Annahme einer konstanten Temperatur und Schwarzkörperstrahlung VERLETZT DEFINITIV DIE WIRKLICHKEIT UND SOGAR DIE GESETZE DER THERMODYNAMIK.
-
Wir folgern, dass der im IPCC-Bericht AR5 prophezeiten Erwärmung JEDE ROBUSTE WISSENSCHAFTLICHE RECHTFERTIGUNG fehlt.
-
Eine Verdoppelung des gegenwärtigen CO2-Niveaus (von 400 auf 800 ppm) würde zu einer Erwärmung lediglich von weniger als 0,24 °C führen.
-
Die wissenschaftliche Gemeinschaft muss nach Gründen für den Klimawandel suchen, die fest auf den Gesetzen von Physik und Chemie beruhen.
Eine zusammenfassende Schlussfolgerung der Berechnungen könnte sein,
dass falls wir die heutige CO2-Konzentration von 400 ppm auf 800 ppm verdoppeln, die daraus folgende Reaktion der Temperatur eine Änderung um weniger als ein Viertelgrad Celsius ist.
Selbst bei einer Verzehnfachung der heutigen CO2-Konzentration auf 4000 ppm würde die daraus resultierende Temperaturänderung lediglich 0,8 °C betragen.
Infrared absorption of atmospheric carbon dioxide
F. K. Reinhart, Swiss Federal Institute of Technology, Lausanne CH-1015 Lausanne, Switzerland
Abstract
The well-known absorption properties of CO2 and the physics of thermal radiation permit to estimate the infrared absorption of the atmospheric CO2.
The earth is considered as a homogeneous spherical black body emitter with a temperature of 288 K.
An idealized atmosphere, the CO2 content of which is the only infrared absorber, surrounds the emitter.
The CO2 concentration at sea level amounts to 400 ppm and the density exponentially tapers off with height.
Accordingly, the average black body temperature contains the so-called greenhouse contribution.
Over 200'000 discrete absorption lines of CO2 are used for the numerical calculations.
If the absorbed energy is converted entirely into heat, we deliberately overestimate the heat retention capability of CO2.
The thermal occupation statistics of the CO2 energy states plays a key role in these calculations.
The calculated heat retention is converted into a temperature increase, ΔT.
Doubling the present CO2 concentration only results in ΔT < 0.24 K.
At the present rate of CO2 concentration increase of 1.2% per year,
it will take almost two hundred years to reach ten times the present concentration resulting in ΔT < 0.80 K.
-
NoTricksZone (Pierre L. Gosselin)
2017-07-17 en Swiss Physicist Concludes IPCC Assumptions 'Violate Reality'... CO2 A 'Very Weak Greenhouse Gas'A Swiss scientist known to have published hundreds of scientific papers in physics journals has authored a new scholarly paper that casts serious doubts on the effectiveness of CO2 as a greenhouse gas influencing Earth's temperatures.
This paper has been added to a growing volume of peer-reviewed scientific papers that seriously question estimates of a high climate sensitivity to significant increases in CO2 concentrations.
⇧
6 Treibhausgas
en
The CO2 Greenhouse Gas
fr Gaz à effet de serre
- Sättigung / Saturation
- de
Wenn die CO2-Konzentration zunimmt,
hat es einen kleineren Erwärmungseffekt
en As Carbon Dioxide increases it has less Warming Effect
fr Lorsque la concentration du CO2 augmente, son effet de réchauffement diminue - Kein Einfluss von CO2 / No Impact of CO2
- de
CO2 kann keinen Klimawandel
verursachen
en CO2 cannot cause a Climate Change
fr CO2 ne peut pas causer un changement climatique - Infrarot / Infrared
- de Infrarot Absorption von Kohlendioxid
↑ Sättigung / Saturation
↑
Die CO2-Sättigung:
Wenn die CO2-Konzentration zunimmt,
ist die Erwärmung wegen der Sättigung kleiner
en As Carbon Dioxide increases it has less Warming Effect
fr Lorsque la concentration du
CO2 augmente,
son effet de réchauffement diminue
- a de
Kohlendioxid absorbiert schon nahezu soviel es kann
en Carbon dioxide is already absorbing almost all it can
fr Le dioxyde de carbone absorbe déjà presque toute l'énergie possible - b en The MODTRAN calculations
- c en We are pretty close to saturation
- d en CO2 Cannot Cause Any More "Global Warming"
↑
a Kohlendioxid absorbiert schon nahezu soviel es kann
en Carbon dioxide is already absorbing almost all it can
fr Le dioxyde de carbone absorbe déjà presque toute l'énergie possible
de Wenn die CO2-Konzentration zunimmt, hat es einen kleineren Erwärmungseffekt
en As Carbon Dioxide increases it has less Warming Effect
fr Lorsque la concentration du CO2 augmente, son effet de réchauffement diminue
 de Diese Balken zeigen den zusätzlichen Erwärmungseffekt von je 20 ppm mehr CO2 in der Atmosphäre. en This graph shows the additional warming effect of each extra 20 ppm of atmospheric CO2. fr Ce graphique montre l'effet induit par chaque 20 ppm supplémentaires de CO2 sur la température de l'air. |
de Kohlendioxid absorbiert schon nahezu soviel es kann. Wir zeigen Ihnen, warum eine Verdoppelung von CO2 nicht viel Änderung bewirkt. Der Effekt heute ist vernachlässigbar, er ist nicht messbar. en Carbon dioxide is already absorbing almost all it can. Here's why it's possible that doubling CO2 won't make much difference. And the effect is already so small, it's unmeasurable. fr Le dioxyde de carbone absorbe déjà presque toute l'énergie possible. Voici pourquoi le doublement de la teneur en CO2 ne changera pas grand chose. L'effet est tellement faible qu'il n'est pas mesurable. |
|
de Diese Abbildung zeigt den Beitrag des CO2 zum Gesamttreibhauseffekt: Die Steigerung des CO2 vom vorindustriellen Niveau bis zum heutigen Tag und seine Extrapolation in die Zukunft ("Verdopplung gegenüber vorindustriellem Niveau") haben praktisch keine Auswirkung. en The logarithmic heating effect of carbon dioxide relative to atmospheric concentration: The first 20 ppm accounts for over half of the heating effect to the pre-industrial level of 280 ppm, by which time carbon dioxide is tuckered out as a greenhouse gas. |
de Die natürliche Erwärmung durch CO2 wird durch die blauen Säulen dargestellt, der vom IPCC projizierte anthropogene Effekt durch die roten Säulen. Jede Erhöhung des CO2-Niveaus um 20 ppm über das vorindustrielle Niveau bringt einen Temperaturanstieg von etwa 0,03°C natürliche Erwärmung und 0,43°C antropogener Erwärmung - das Dreizehnfache! Um an diese globale Erwärmung zu glauben, ist ein "Sprung in den Glauben" nötig. en The natural heating effect of carbon dioxide is the blue bars and the IPCC projected anthropogenic effect is the red bars.
Each 20 ppm increment above 280 ppm provides about 0.03° C of
naturally occurring warming and
0.43°C of anthropogenic warming. This is the leap of faith required to believe in global warming. |
-
Klimaskeptiker Info
2010-03-08 de Der logarithmische Effekt des CO2IPCC:
Zum Konzept der sogenannten Treibhausgase gehört es, daß die Erde ohne die Anwesenheit dieser Gase in der Atmosphäre eine um rund 30°C niedrigere Durchschnittstemperatur aufwiese.
Kohlendioxid (CO2) trägt zu diesem Effekt 10% bei, also etwa 3°C.
Vor der Industrialisierung betrug der CO2-Anteil in der Atmosphäre etwa 280 ppm.
Wenn Erwärmung und CO2-Anteil in einer linearen Beziehung zueinander stünden, würde also je 100 ppm CO2 eine Erwärmung von etwa 1°C zu erwarten sein.
Bei der gegenwärtigen CO2-Zunahme von 2 ppm pro Jahr würde es alle 50 Jahre um 100 ppm steigen und wir alle würden nach den IPCC-Vorhersagen gebraten.
Aber der Zusammenhang ist nicht linear, sondern logarithmisch.
Wir halten also fest: Die Treibhauswirkung von zusätzlichem CO2 in der Atmosphäre ist praktisch gleich Null.
Wo ist das Platz für hysterische CO2-Klimaschutz-Propaganda? Es gibt ihn nicht!
-
Watts Up With That? (Antony Watts)
2010-03-08 en The Logarithmic Effect of Carbon DioxideIPCC:
The greenhouse gasses keep the Earth 30° C warmer than it would otherwise be without them in the atmosphere, so instead of the average surface temperature being -15° C, it is 15° C.
Carbon dioxide contributes 10% of the effect so that is 3° C.
The pre-industrial level of carbon dioxide in the atmosphere was 280 ppm. So roughly, if the heating effect was a linear relationship, each 100 ppm contributes 1° C.
With the atmospheric concentration rising by 2 ppm annually, it would go up by 100 ppm every 50 years and we would all fry as per the IPCC predictions.
But the relationship isn't linear, it is logarithmic.
The whole AGW belief system is based upon positive water vapour feedback starting from the pre-industrial level of 280 ppm and not before.
To paraphrase George Orwell, anthropogenic carbon dioxide molecules are more equal than the naturally occurring ones. Much, much more equal.
↑ b en The MODTRAN calculations
|
|
This is a plot of some MODTRAN results for the temperature of the atmosphere in which the CO2 concentration varies from zero to 1000 ppmv. The intention is to show the logarithmic nature of the relationship between CO2 and surface temperature, i.e., the temperature rises non-linearly with every successive addition of CO2 causing smaller effects.
|

-
One method of estimating the contribution made by the presence of CO2 to the total 34.5°C of global warming is by the use of the MODTRAN programme and database, which contains all the spectral information about greenhouse gases and allows the calculation of fluxes at any altitude, looking downwards to the surface or upwards towards space.
-
Keeping everything constant except for the CO2 concentration and considering the transfer of energy across the troposphere at an altitude of 15 km, the results of Modtran calculations are shown in the graph.
For each point the temperature was reduced until radiative balance was re-established.
-
The widely prophesied doubling in CO2 concentration from the pre-industrial value of 285 ppmv to 570 ppmv would be associated with an increase of just 1.5°C.
-
As ever, these figures are to be considered with caution since they represent the instantaneous effects of CO2 changes.
They do not include the ameliorating effects of clouds, nor do they include the eventual global consequences of the instantaneous changes.
| Jack Barrett |
PhD in physical chemistry for research into the Photolysis of Liquid
Water
▶Jack Barrett: Who is who (Skeptiker) ▶Jack Barrett: Video (Präsentationen) |
| David J. Bellamy |
Prof. OBE., BSc., PhD., Hon FLS,. DSc., DUniv.,
C.Biol., FIBiol., FRIN
▶David J. Bellamy: Who is who (Skeptiker) ▶David J. Bellamy: Video (Präsentationen) |
↑ c We are pretty close to saturation
en S. I. Rasool and S. H. Schneider
It is found that even an increase by a factor of 8 in the amount of CO2 which is highly unlikely in the next several thousand years, will produce an increase on the surface temperature of less than 2°K.
-
S. I. Rasool and S. H. Schneider
1971-07-09 en
Atmospheric Carbon Dioxide and Aerosols: Effects of Large
Increases on Global Climate
-
Science
1971-07-09 en Atmospheric Carbon Dioxide and Aerosols: Effects of Large Increases on Global Climate - S. I. Rasool and S. H. SchneiderEffects on the global temperature of large increases in carbon dioxide and aerosol densities in the atmosphere of Earth have been computed.
It is found that, although the addition of carbon dioxide in the atmosphere does increase the surface temperature, the rate of temperature increase diminishes with increasing carbon dioxide in the atmosphere.
For aerosols, however, the net effect of increase in density is to reduce the surface temperature of Earth.
Because of the exponential dependence of the backscattering, the rate of temperature decrease is augmented with increasing aerosol content. An increase by only a factor of 4 in global aerosol background concentration may be sufficient to reduce the surface temperature by as much as 3.5 ° K.
If sustained over a period of several years, such a temperature decrease over the whole globe is believed to be sufficient to trigger an ice age.
|
We are pretty close to saturation 
|
August 2008 was 0.3 °C below June 1988 rather than projected 0.5 °C above. 
|
↑ d en CO2 Cannot Cause Any More "Global Warming"
-
SPPI Science & Public Policy Institute
en CO2 Cannot Cause Any More "Global Warming"
-
Ference Miskolczi (written by Miklos Zagoni)
en
CO2 Cannot Cause Any More "Global Warming"
↑ Kein Einfluss von CO2
↑
CO2 kann keinen Klimawandel verursachen
en CO2 cannot cause
a Climate Change
fr CO2 ne peut pas
causer un changement climatique
- a The Single Most Important Point
- b Relationships that hold for CO2 and warming in the future must hold in the past
- c IPCC AR4 Chapter 9 Figure 1
- d Hansen Scenario vs. Reality
↑ a The Single Most Important Point
|
From Climate Positive Feedback Theory
From Greenhouse Gas Theory |
|

↑ b Relationships that hold for CO2 and warming in the future must hold in the past
Those who control the past control the future.
Those who control the present control the past. - George Orwell
|
From Climate Positive Feedback Theory
From Greenhouse Gas Theory |
|
|
And, if one assumes the actual warming is less than 0.6C, and only a part of that is from anthropogenic CO2, then the actual warming forecast justified is one of negative feedback, showing less than 1C per century warming from manmade CO2 - which is EXACTLY the case that most skeptics make. |
|

| Warren Meyer |
MBA, with High Distinction, Harvard Business School. BSE Magna Cum Laude, Mechanical Engineering, with emphasis in control theory, Princeton University. ▶Warren Meyer: Who is who (Skeptiker) ▶Warren Meyer: Präsentationen (Bilder & Grafiken) ▶Warren Meyer: Video (Präsentationen) ▶Warren Meyer: Websites (English) |
-
Whats Up With That? (Antony Watts)
2011-04-26 en The climate sensitivity and the surface temperature record question - answers from major players
↑ c IPCC AR4 Chapter 9 Figure 1
|
|
|
|
Decadal mean global near surface temperature over the 20th century
from
observations (black), and showing the approcimate 5-95% range
from IPCC AR4 model simulations
with natural and antrhropogenic forcings (red). |
Also shown is the corresponding temperature range when models are driven by natural forcings only (blue). |
↑ d Hansen Scenario vs. Reality
|
We are pretty close to saturation
|
August 2008 was 0.3 °C below June 1988 rather than projected 0.5 °C above.
|
↑ Infrarot / Infrared
↑
Infrarot Absorption von Kohlendioxid
en Infrared absorption of carbon dioxide
fr Absorption infrared du dioxyde de carbon
-
Dr. Hans Penner
2011-11-24 en
Argumente gegen die Klimakatastrophen-Hypothese
Kohlendioxid ist kein Schadstoff
Kohlendioxid ist der wichtigste Pflanzennährstoff ohne klimaschädigende Wirkung
-
Die Infrarot-Absorption durch das Kohlendioxid der Luft ist praktisch gesättigt.
-
Die Klimasensitivität des Kohlendioxids beträgt nur wenige Zehntel Grad.
-
Die technischen Kohlendioxid-Emissionen betragen nur 1 Prozent der biologischen.
-
Die Globaltemperatur korreliert nicht mit der Kohlendioxid-Konzentration.
-
Das Absinken der Globaltemperatur seit 1998 wurde nicht prognostiziert.
-
Der Klimawandel entsteht durch die Änderungen der Sonnenaktivität.
-
⇧
7 Kritik am Treibhauseffekt und an der Gegenstrahlung
en Criticism of the Greenhouse Effect
fr Critiques de l'effet de serre
Mit folgenden Links wird von anderen Webseiten auf diese Seite verwiesen:
▶Aspekt: Kritik am Treibhauseffekt und an der Gegenstrahlung
▶Effekt: Kritik am Treibhauseffekt und an der Gegenstrahlung
| de | en | fr |
|---|---|---|
| Physikalische Aspekte | Physical aspects | Aspects physiques |
| Kritik am Treibhauseffekt und an der Gegenstrahlung | Criticism of the Greenhouse Effect and of the back-radiation | Critiques de l'effet de serre et du forçage radiatif (back-warming) |
⇧ de Verzeichnis en Contents fr Sommaire
- 2011
- de Neues wissenschaftliches Experiment widerlegt "Treibhauseffekt"
- 2004
- de Brief von Ernst-Georg Beck an das UBA
⇧ Welt-Info
|
|
Kritik am Treibhauseffekt und an der Gegenstrahlung |
| ►Der Wasserplanet (Ernst-Georg Beck) | de ▷Dichtung und Wahrheit (Wayback ohne Bilder) |
| Wikipedia |
de
Meeresspiegel en Sea level fr Niveau de la mer |
| Vademecum |
▶Aspekt: Kritik am Treibhauseffekt und an der Gegenstrahlung
▶Effekt: Kritik am Treibhauseffekt und an der Gegenstrahlung ▶Welt-Info |
| Siehe auch |
▶Physikalische Aspekte
▶ CO₂-Treibhauseffekt ▶Der offizielle Treibhauseffekt ▶Treibhausgase |
⇧ de Allgemein en General fr Générale
Topics
- a de Wissenschaftler widerlegen Treibhauseffekt (Gerhard Gerlich & Ralf D. Tscheuschner)
- b de Treibhauseffekt im Widerspruch zur Thermodynamik (Heinz Thieme)
- c de Treibhauseffekt - ein forscher Irrtum (Heinz Thieme)
- d de Zum Phänomen der atmosphärischen Gegenstrahlung (Heinz Thieme)
- e de Argumente gegen die Klimakatastrophen-Hypothese (Hans Penner)
- f de Atmosphäreneffekt des Kohlendioxids (Hans Penner)
- g de Kritik am Graßl-Schirm (Walter Lüftl)
- h de Verschmutzungsgrad der Luft (Kritik an den Aussagen von Stadtklima Stuttgart)
- i de Ansprache an Frau Merkel (Wolfgang Thüne)
- j
en
Regrets over the CO₂ Theory
fr Les regrets au sujet de la théorie du CO₂
(Thomas C Chamberlin vs. Svante August Arrhenius) - k de Argumente gegen die Klimalüge (Klimaskeptiker.info)
- l de In der Zentralantarktis besitzt der CO2-Treibhauseffekt offenbar keine erwärmende Wirkung
↑
a Wissenschaftler widerlegen Treibhauseffekt
(Gerhard Gerlich & Ralf D. Tscheuschner)
en Scientists prove that there is no
Greenhouse Effect
fr Des scientifics prouvent qu'il n'y a pas
d'effet de serre
Gerhard Gerlich |
Gerhard Gerlich: Prof. Dr., Dipl.-Phys. TU Braunschweig (links/left) Ralf D. Tscheuschner: Dr. Dipl.-Phys. D-22237 Hamburg (rechts/right) |
|---|

Mit folgendem Link wird von anderen Webseiten auf diese Seite verwiesen.
|
Gerhard Gerlich * 1942-04-06 †2014-11-08 |
Prof. Dr., Dipl.-Phys. TU Braunschweig
▶Gerhard Gerlich: Who is who (Skeptiker) ▶Gerhard Gerlich: Video (Präsentationen) |
|
Ralf D. Tscheuschner *1956 †2020-08-21 |
Dr. Dipl.-Phys. D-22237 Hamburg
▶Ralf D. Tscheuschner: Who is who (Skeptiker) ▶Ralf D. Tscheuschner: Video (Präsentationen) ▶Ralf D. Tscheuschner: Websites (Deutsch) ▶Ralf D. Tscheuschner: Websites (English) |
-
Ralf D. Tscheuschner
de/en Homepage
de/en Veröffentlichungen/Publications
-
Pensée unique (Jean Martin)
fr Les fondements de la théorie de l'effet de serre critiqués par deux physiciens allemands
... D'autre part, comme l'affirment G. Gerlich et R.D. Tscheuschner, il n'existe, à ce jour, aucune démonstration scientifique de la réalité de "l'effet de serre du CO2 dans l'atmosphère", qui parte des lois fondamentales de la physique, dans toute la littérature scientifique internationale.
2020-08-21
-
EIKE Europäisches Institut für Klima und Energie
Michael Limburg
2020-09-11 de Dr. Ralf Tscheuschner ist tot - wir trauern um einen hochkompetenten MitstreiterRalf Tscheuchner starb wohl um den 21.8.20 allein in seiner Wohnung.
Er wurde nur 64 Jahre alt.
Vielen ist Dr. Ralf Tscheuschner noch als Co-Autor der berühmten - und heftig umstrittenen Studie - "zur Falsifikation der atmosphärischen Treibhauseffekte im Rahmen der Physik" bekannt.
Der andere Autor, Prof. Gerhard Gerlich - Inhaber des Lehrstuhls für theoretische Physik in Braunschweig, ging ihm um Jahre voraus.
Diese Studie aber hat Bestand.
Doch auch danach wirkte er unermüdlich bei der Aufklärung der Öffentlichkeit über die Ursachen der Erderwärmung mit.
Wir wissen wenig über Ralf Tscheuschner, aber wir wissen, dass er nicht nur ein hochkompetenter Physiker war, sondern auch jemand, der für seine Überzeugungen kämpfte.
Und immer mit offenem Visier.
Dabei schonte er weder Freund noch Feind.
Diplomatie oder eine gewisse freundliche Zurückhaltung gegenüber Positionen, die er nicht untersützte, waren seine Sache nicht.
Das brachte ihm nicht nur Freunde ein, sondern auch viel Ablehnung.
Auch innerhalb des Lagers der Klimarealisten.
Trotzdem loben alle, die mit ihm näheren Umgang hatten, sein freundliches nettes Wesen und seine immerwährende Hilfsbereitschaft.
Privat und beruflich hat er es aber - gerade weil er fachlich brillant war - nie leicht gehabt.
Ein so brillanter Kopf wie er hinterlässt eine sehr große Lücke.
Um dessen nun fehlenden Beiträge es wirklich schade ist, ganz abgesehen von der menschlichen Tragödie mit 64 Jahren schon dem Leben Adieu sagen zu müssen.
Viele von uns werden ihm ein gutes Andenken bewahren.
Ruhe in Frieden.
2018
-
Ralf Tscheuschner, Gerhard Gerlich, sowie den Meteorologen Wolfgang Thüne.
2018-06-10 de
LÜCKENLOS entlarvt - Klimawandel - Klimaschwindel -
Lehrfilm über die Treibhauseffekt- und CO₂-Lüge
"LÜCKENLOS entlarvt" ist ein Lehrfilm über die Treibhauseffekt- und CO₂-Lüge, sowie über die Lüge des menschengemachten Klimawandels.
In diesem Video sehen und hören Sie den unabhängigen Physiker Ralf Tscheuschner, Gerhard Gerlich, sowie den Meteorologen Wolfgang Thüne.
Die drei Naturwissenschaftler entlarven den Klimaschwindel lückenlos und führen sämtliche gängigen Klimalügen ad absurdum.
Der Film "LÜCKENLOS entlarvt" wird für den Schulunterricht, wie auch zu Studienzwecken an Universitäten empfohlen.
2009
-
Gerhard Gerlich and Ralf D. Tscheuschner
2009-01-06
Version 4en
Falsifcation Of The Atmospheric CO2
Greenhouse Effects Within The Frame Of Physics
-
de Zusammenfassung
Der atmosphärische Treibhauseffekt, eine Idee, die die Autoren bis zu den traditonellen Arbeiten von Fourier 1824, Tyndall 1861 und Arrhenius 1896 zurückverfolgen, und die immer noch in der globalen Klimatologie unterstützt wird, beschreibt im wesentlichen einen fiktiven Mechanismus, in dem eine planetarische Atmosphäre wie eine Wärmepumpe arbeitet, angetrieben durch eine Umgebung, die mit Strahlung auf das atmosphärische System einwirkt, sich aber mit dem System im Strahlungsgleichgewicht befindet.
Nach dem zweiten Hauptsatz der Thermodynamik kann eine solche planetarische Maschine nicht existieren.
Gleichwohl wird die Existenz und die solide wissenschaftliche Begründung dieses Mechanismus' in fast allen Texten der globalen Klimatologie und in der vielfältigen Sekundärliteratur angenommen.
In diesem Papier werden die populäre Ansicht analysiert und die grundlegenden physikalischen Prinzipien geklärt.
Indem gezeigt wird, dass
- es keine gemeinsamen physikalischen Gesetze zwischen dem Erwärmungsphänomen in einem Glasgewächshaus und dem fiktiven atmosphärischen Treibhauseffekt gibt,
- es keine Berechnungsmethode gibt, die die durchschnittliche Oberflächentemperatur eines Planeten bestimmen könnte,
- die oft zitierte Temperaturdifferenz von 33°C eine sinnlose und falsch berechnete Zahl ist,
- Formeln zur Berechung der Strahlung falsch angewandt werden,
- die Annahme eines Strahlungsgleichgewichts unphysikalisch ist,
- Wärmeleitung und Reibung nicht auf Null gesetzt werden dürfen,
wird die Behauptung eines atmosphärischen Treibhauses widerlegt.
-
en Abstract
The atmospheric greenhouse effect, an idea that authors trace back to the traditional works of Fourier 1824, Tyndall 1861, and Arrhenius 1896, and which is still supported in global climatology, essentially describes a fictitious mechanism, in which a planetary atmosphere acts as a heat pump driven by an environment that is radiatively interacting with but radiatively equilibrated to the atmospheric system.
According to the second law of thermodynamics such a planetary machine can never exist.
Nevertheless, in almost all texts of global climatology and in a widespread secondary literature it is taken for granted that such mechanism is real and stands on a firm scientific foundation.
In this paper the popular conjecture is analyzed and the underlying physical principles are clarified.
By showing that
- there are no common physical laws between the warming phenomenon in glass houses and the fictitious atmospheric greenhouse effects,
- there are no calculations to determine an average surface temperature of a planet,
- the frequently mentioned difference of 33°C is a meaningless number calculated wrongly,
- the formulas of cavity radiation are used inappropriately,
- the assumption of a radiative balance is unphysical,
- thermal conductivity and friction must not be set to zero,
the atmospheric greenhouse conjecture is falsified.
-
Prof. Dr. G. Gerlich : Vortrag auf dem Herbstkongress der Europäischen
Akademie für Umweltfragen, Leipzig, 9./10. Nov. 1995
de Die physikalischen Grundlagen des Treibhauseffektes und fiktiver Treibhauseffekte
de
Die physikalischen Grundlagen des Treibhauseffektes und
fiktiver Treibhauseffekte
-
Prof. Dr. G. Gerlich
de Zur Physik und Mathematik globaler Klimamodelle
de
Zur Physik und Mathematik globaler Klimamodelle
-
klimaskeptiker.info de/en
Wissenschaftler widerlegen Treibhauseffekt
2011
-
Vortrag Dr. Tscheuschner 2011-04-09 2011-08-10 de
CO₂ Auswirkungen auf das Klima
Widerlegung des Treibhauseffekts anhand der physikalischen Gesetze.
↑
b Treibhauseffekt im Widerspruch zur Thermodynamik
(Heinz Thieme)
-
Heinz Thieme
de Treibhauseffekt im Widerspruch zur Thermodynamik und zu Emissionseigenschaften von GasenDass dieser "Treibhauseffekt" bisher nicht nachgewiesen werden konnte, ist eine Zwangsläufigkeit; es gibt diesen nämlich überhaupt nicht, es kann ihn nicht geben.
Die Behauptung, dass sogenannte "Treibhausgase" wie z. B. CO2 zur Erwärmung am Boden der Erdatmosphäre beitragen, steht im krassen Widerspruch zu sämtlichen bekannten physikalischen Gesetzmässigkeiten für Gase und Dämpfe sowie der Wärmelehre insgesamt.
-
Heinz Thieme
en Greenhouse Gas Hypothesis Violates Fundamentals of Physics... This is no surprise, because in fact there is no such thing as the greenhouse effect: it is an impossibility.
The statement that so-called greenhouse gases, especially CO2, contribute to near-surface atmospheric warming is in glaring contradiction to well-known physical laws relating to gas and vapour, as well as to general caloric theory.
↑
c Treibhauseffekt - ein forscher Irrtum
(Heinz Thieme)
-
Heinz Thieme
de Treibhauseffekt - ein forscher IrrtumZitat: (Schlusssatz)
Die Temperaturbedingungen in unserem Lebensraum haben wir - neben der durch die Sonne zugeführten Energie - allein dem Vorhandensein und den Eigenschaften der Lufthülle einschliesslich der Präsenz des Wassers zu verdanken.
Solange die Luft in trockenem Zustand 79% Stickstoff und 21% Sauerstoff und unter Normalbedingungen ausserdem Feuchtigkeit enthält, der Luftdruck in Meereshöhe weiterhin bei ungefähr 1 bar bleibt, können die Spurengase keine anderen Qualitäten und Wirkungen erzeugen.
Nach dem Wissensstand der Physik, insbesondere der Thermodynamik (Wärmelehre), ist es ausgeschlossen, dass es durch Spurenanteile von CO2 und/oder anderen vergleichbaren Gasen in der Luft zu einer Erwärmung bzw. zu einem Klimaproblem kommen kann.
Lediglich der Wassergehalt der Atmosphäre ist klimawirksam. Die Wirkungen unterschiedlicher Wassergehalte dürften jedoch im Bereich der bisher beobachteten Klimavariationen in der Spanne von trockenen und feuchten Jahren liegen, also keine katastrophalen Ausmasse annehmen.
↑
d Zum Phänomen der atmosphärischen Gegenstrahlung
(Heinz Thieme)
-
Bedenkt man, dass in der Troposphäre die Temperatur nach oben hin abnimmt und erinnert sich gleichzeitig noch an den Zweiten Hauptsatz der Thermodynamik:
"Es kann nie Wärme aus einem kälteren in einen wärmeren Körper übergehen, wenn nicht gleichzeitig eine andere damit zusammenhängende Änderung eintritt", oder, - noch leichter verständlich - "Wärme kann nie von selbst von einem Körper niederer Temperatur auf einen Körper höherer Temperatur übergehen" , so kommen Zweifel, wie denn die "Gegenstrahlung" funktionieren könnte.
-
Bereits allein unter Würdigung des Zweiten Hauptsatzes der Thermodynamik entpuppt sich die "Gegenstrahlung" als nichts anderes als ein Phantasieprodukt.
![]() de
de
![]() en
en
![]()

-
Heinz Thieme
de Zum Phänomen der atmosphärischen Gegenstrahlung
| Heinz Thieme |
Dipl.-Ing. Heinz Thieme ist Diplomingenieur und war als Gutachter viele Jahre lang mit komplexen physikalischen Problemstellungen im Energiebereich befaßt. Ab 1997 veröffentlichte er im Internet eine Reihe von Aufsätzen, in denen er erstmals auch die tatsächliche Rolle der "Treibhausgase" bei der Kühlung der Erde analysierte. ▶Heinz Thieme: Who is who (Skeptiker) |
↑
e Argumente gegen die Klimakatastrophen-Hypothese
(Hans Penner)
-
Dr. Hans Penner
2011-11-24 de
Argumente gegen die Klimakatastrophen-Hypothese
Kohlendioxid ist kein Schadstoff
Kohlendioxid ist der wichtigste Pflanzennährstoff ohne klimaschädigende Wirkung
- Die Infrarot-Absorption durch das Kohlendioxid der Luft ist praktisch gesättigt.
- Die Klimasensitivität des Kohlendioxids beträgt nur wenige Zehntel Grad.
- Die technischen Kohlendioxid-Emissionen betragen nur 1 Prozent der biologischen.
- Die Globaltemperatur korreliert nicht mit der Kohlendioxid-Konzentration.
- Das Absinken der Globaltemperatur seit 1998 wurde nicht prognostiziert.
- Der Klimawandel entsteht durch die Änderungen der Sonnenaktivität.
↑
f Atmosphäreneffekt des Kohlendioxids
(Hans Penner)
-
Dr. Hans Penner
2011-12-28 de
Atmosphäreneffekt des Kohlendioxids
Aus dem Inhaltsverzeichnis
- Entstehung der Treibhaus-Hypothese
- Ablehnung der Treibhaus-Hypothese
- Infrarotabstrahlung der Erdoberfläche
- Infrarot-Absorption durch Kohlendioxid in der unteren Troposphäre
- Infrarot-Absorption durch Kohlendioxid in der oberen Troposphäre
- Energieübergänge in der Atmosphäre
- Sättigung der IR-Absorption durch Kohlendioxid
- Thermalisierung der absorbierten Energie
- Wärmetransport
↑
g Kritik am Graßl-Schirm
(Walter Lüftl)
Aussage von Graßl:
-
Die Strahlen der Sonne, die ungehindert von diesen Gasen (allen voran Kohlendioxid) durch die Atmosphäre der Erde dringen und die Oberfläche des Planeten so wohltuend erwärmen bleiben, wenn sie als Wärmestrahlen entweichen wollen, unter einem Schirm von Spurengasmolekülen wie in einem Glashaus gefangen.
Je mehr davon in den Atmosphäre schweben, desto wärmer wird es auf der Erde. Das ist ein Naturgesetz.
In der folgenden Website wird folgende Antwort gegeben:
-
Das ist kein Naturgesetz, das ist wissenschaftlicher Schwachsinn.
-
Die Erde ist kein Glashaus, auch Treibhaus genannt.
Die Wirkung eines Glashauses beruht auf der Erwärmung der eingeschlossenen Luft durch Sonneneinstrahlung.
Bis daher kein Einwand.
Die erwärmte Luft muss aber durch die Wände vor der Advektion und durch die Decke vor der Konvektion geschützt werden, sonst funktioniert die Sache nicht.
Und nach Sonnenuntergang wird es ohne Heizung sehr rasch kalt im "Glashaus".
Das weiss jeder, der sich schon einmal den Temperaturgang in einem in der Sonne geparkten PKW verinnerlicht hat.
Und der schon bei Plustemperaturen (der Aussenluft) in der Früh das Eis von der Windschutzscheibe, die an klaren Nächten gegen das Weltall (Null Kelvin = -273,4 °C) strahlt kratzen musste.
-
Ein Quadrat von 50 cm Seitenlänge hat eine Fläche von 2500 cm2. In der Mitte befindet sich eine Fläche von 1 cm2, diese entspricht dem Anteil des CO2 am "Graßlschirm". Was glauben Sie, welche Schutzwirkung ein solcher Schirm haben kann? Erraten: Null.
-
Und wenn Sie dann noch erfahren, dass lediglich 3% des (marginalen!) CO2-Gehaltes der Luft antropogen, also vom Menschen verursacht sind, dann wird Ihnen klar, was vom "drohenden Klimawandel" durch CO2-Ausstoss zu halten ist.
-
Klimaskeptiker Info
de Baurat h.c. Dipl.-Ing. Walter Lüftl: Der Graßlschirm
↑
h Verschmutzungsgrad der Luft
(Kritik an den Aussagen von Stadtklima Stuttgart)
Aussage von stadtklima-stuttgart.de:
-
Ausser der Globalstrahlung kommt auch der atmosphärischen Gegenstrahlung eine wichtige Bedeutung zu.
Als Gegenstrahlung bezeichnet man die von der Atmosphäre auf die Erde auftreffende langwellige Wärmestrahlung.
Diese Gegenstrahlung wird stark durch den Verschmutzungsgrad der Luft beeinflusst.
So bewirkt eine hohe Luftverschmutzung einen hohen Anteil an Gegenstrahlung.
70 % der Gegenstrahlung werden in den ersten 100 m der Atmosphäre erzeugt, dabei liefert die Gegenstrahlung etwa gleich viel Energie, wie die Sonnenstrahlung an einem heiteren Tag.
Wenn obige Aussagen stimmen würden:
-
Wäre es nach den grossen Vulkanausbrüchen wärmer und nicht kälter geworden.
-
Würde es nach der Abnahme der Luftverschmutzung kälter und nicht wärmer, wie auch von der ETH in Zürich festgestellt wurde.
-
Wenn die Gegenstrahlung etwa gleich viel Energie, wie die Sonnenstrahlung an einem heiteren Tag liefert, müsste man das ja spüren. Dies wurde auch mit dem Effekt des Bodenfrostes widerlegt, da ja solche Wärmestrahlen den Boden aufheizen müssten.
| de | en | fr |
|---|---|---|
| Einflüsse auf das Klima | Impacts of Climate Change | Impacts climatiques |
| "Globale Verdunkelung" und "Globale Aufhellung" | "Global Dimming" and "Global Brightening" | "Assombrissement global (ou obscurissement planétaire)" |
- stadtklima-stuttgart.de: Klima und Luft als Planungsfaktoren
↑ i Ansprache an Frau Merkel (Wolfgang Thüne)
-
de
Dr. Wolfgang Thüne deckt die Hintergründe des Klimaschwindels
und der Klimahysterie unserer Tage auf.
Dr. Wolfgang Thüne - Ansprache an Frau Merkel
| Wolfgang Thüne |
Dipl.-Met. Dr. phil.
▶Wolfgang Thüne:Who is who (Skeptiker) ▶Wolfgang Thüne: Video (Präsentationen) |
↑
en
j Regrets over the CO2 Theory
(Thomas C Chamberlin vs. Svante August Arrhenius)
fr
Les regrets au sujet de la théorie du CO2
-
Historical perspectives on climate change
en Regrets over the CO2 TheoryI greatly regret that I was among the early victims of Arrhenius'error.
-
Skyfall / Changement Climatique
2010-06-17 fr Les regrets au sujet de la théorie du CO2Deux décennies après les travaux initiaux de Chamberlin sur le sujet, la théorie sur le rôle du CO2 sur le climat était tombée en défaveur. Chamberlin exprima à de multiples reprises ses regrets d'avoir suivi Arrhenius et d'avoir adopté la théorie trop hâtivement.
Il écrivit ceci dans une longue lettre à Charles Schuchert du Peabody Museum de Yale, en 1913 :
Je n'ai aucun doute que vous ayiez raison en pensant que ceux qui acceptent la théorie du CO2 [sur le climat] sont moins nombreux par rapport à il y a quelques années. La suggestion originale de Tyndall, selon laquelle un déficit de CO2 pourrait avoir été la cause de l'âge glaciaire reçut peu d'intérêt et sembla avoir été oublié au point que, lorsque Arrhenius formula la même théorie, celle-ci sembla nouvelle et originale et, comme elle semblait fondée sur des déductions mathématiques des observations de Langley et issue d'une grande autorité, elle attira un large public.
Malheureusement, les déductions d'Arrhenius à partir des observations de Langley semblent avoir été infondées et dès que cela fut découvert, une réaction fut inévitable...
Je regrette profondément d'avoir été parmi les premières victimes de l'erreur d'Arrhenius.
↑ k Argumente gegen die Klimalüge (Klimaskeptiker.info)
-
Klimaskeptiker.info de Argumente gegen die Klimalüge
Physikalische Tatsache: Die realen "Treibhäuser" (besser "Gewächshäuser") in der Landwirtschaft funktionieren nicht durch das Zurückhalten langwelliger Wärmestrahlung, sondern nur weil sie wirksam den Abtransport der Wärme durch Luftbewegung verhindern.
Bereits ein oder zwei kaputte Scheiben im Gewächshaus machen es sehr schwer, die für die Pflanzen benötigten Temperaturen zu halten - da nützt der von den Klimalügnern behauptete Unsinn vom Zurückhalten der Wärmestrahlung gar nichts mehr.
↑ l In der Zentralantarktis besitzt der CO2-Treibhauseffekt offenbar keine erwärmende Wirkung
-
Die kalte Sonne (Fritz Vahrenholt & Sebastian Lüning) / Frank Bosse
2015-06-21 de Unerwartete Entdeckung im Rahmen einer Doktorarbeit an der Universität Bremen: In der Zentralantarktis besitzt der CO2-Treibhauseffekt offenbar keine erwärmende WirkungDer Treibhauseffekt ist Zentralpunkt der Klimadiskussion.
Der WWF erklärt ihn wie folgt:
Sonnenstrahlen treffen als ultraviolette Strahlung (UV) auf die Erdoberfläche und erwärmen diese.
Ein Teil dieser Energie wird in Form von langwelliger infraroter Strahlung reflektiert, also wieder Richtung Weltraum zurückgeworfen.
Von dieser reflektierten infraroten Strahlung wiederum wird ein Teil in der Atmosphäre von Gasen wie Wasserdampf, Ozon, Kohlendioxid (CO2) und anderen quasi zurückgehalten.
Diese langwellige infrarote Sonnenstrahlung fällt zur Erde zurück und erwärmt sie wie ein Treibhaus.
Dieser natürliche Treibhauseffekt ist damit so etwas wie eine gigantische, erdumspannende Temperaturregelung, die Leben unter den herrschenden Bedingungen ermöglicht.
Gibt es diese Verstärker wirklich?
Mehr CO2 bedeutet mehr Rückstrahlung Richtung Boden, also Erwärmung.
Im Normalfall erhöht sich die Temperatur um 1,1°C pro CO2-Verdopplung, wie theoretische Berechnungen zeigen.
Nun hat der IPCC jedoch eine ganze Reihe von fragwürdigen "Verstärkerprozessen" in die Gleichungen eingebaut, was letztendlich dreifach überhöhte Werte für die Klimasensitivität des CO2 geliefert hat.
Gibt es diese Verstärker wirklich?
An der Universität Bremen wurde im Dezember 2014 eine hochinteressante Doktorarbeit zur Treibhauswirkung des CO2 fertiggestellt.
Holger Schmithüsen ging dabei der Frage nach, ob der Treibhauseffekt wirklich stets erwärmt, oder ob es regionale Unterschiede gibt. Das Ergebnis von Schmithüsens Dissertation ist spektakulär:
In der zentralen Antarktis gilt die pauschale Annahme offenbar nicht. Mehr CO2 bewirkt hier nämlich rein gar nichts. Und noch überraschender:
Zu bestimmten Jahrezeiten hat das CO2 sogar einen kühlenden Effekt.
Quelle / Source
-
Staats- und Universitätsbibliothek Bremen
Holger Schmithüsen
2015-03-05 de Antarctic Specific Features of the Greenhouse Effect : A Radiative Analysis Using Measurements and ModelsVolltext
2014-12-10 de
Antarctic Specific Features of the Greenhouse Effect:
A Radiative Analysis Using Measurements and Models
Siehe auch / See also
-
Die kalte Sonne (Fritz Vahrenholt & Sebastian Lüning)
2015-06-17 de Klimamodellierer haben ein riesiges Problem: Modelle können Zunahme des antarktischen Meereises nicht reproduzieren
⇧ de Text en Text fr Texte
⇧ 2011
↑ Neues wissenschaftliches Experiment widerlegt "Treibhauseffekt"!
-
EIKE Europäisches Institut für Klima und Energie
Limburg, John O'sullivan
2011-07-22 de Neues wissenschaftliches Experiment widerlegt "Treibhauseffekt"!Der Vergleich mit einem Treibhaus
In vielen Veröffentlichungen weltweit wird zur Erklärung der These vom "Treibhauseffekt" immer wieder der Vergleich - genau - mit einem Treibhaus herangezogen.
Daher ja auch der Name.
Der Medienliebling und inzwischen wegen seiner Fehlprognosen berüchtigte Klimaforscher des IFM Geomar Prof. Dr. Mojib Latif behauptet in der Bildzeitung (Bild-Zeitung vom 20.09.07 Seite 13) gar: "Die Skeptiker verstehen nicht warum CO₂ überhaupt klimawirksam ist.
Die Atmosphäre ist wie ein riesiges Treibhaus, wobei das CO₂ die Rolle des Glases übernimmt - es lässt die Wärme nicht entweichen.
Je mehr CO₂, desto dichter oder dicker das Glas und umso größer die Erwärmung."
Nun ist das nichts weiter als wissenschaftlicher verbrämter Unsinn,
was seriösen Wissenschaftlern, auch solchen die überzeugt dem IPCC zuarbeiten, seit langem bekannt ist.
Trotzdem darf dieser Unsinn heute in keinem Schulbuch fehlen.
Doch schon vor über 100 Jahren hat der amerikanische Experimentalphysiker Robert W. Wood an der Hopkins Universität nachgewiesen,
dass dies alles nicht stimmt und einer wissenschaftlichen Überprüfung nicht standhält.
Jetzt hat Professor Nahle im mexikanischen Monterrey mit Unterstützung eines Teams von internationalen Wissenschaftlern originalgetreu sein berühmtes Experiment aus dem Jahr 1909 wiederholt,
um zu belegen, dass der "Treibhauseffekt" nicht der Grund für eine globale Erwärmung sein kann!
Erstaunlicherweise wurde das Treibhausexperiment, das 1909 zum ersten Mal von Prof. Robert W. Wood an der John Hopkins University durchgeführt worden war, ein Jahrhundert lang nicht wiederholt*.
Und das, obwohl inzwischen über 100 Milliarden Dollar durch die Industrie der anthropogen verursachten globalen Erwärmung ausgegeben worden sind, um zu beweisen, dass Kohlendioxid ein gefährlicher atmosphärischer Verschmutzer ist.
Die verwendete und eingängig plausible Analogie war, dass sog. Treibhausgase (z. B. CO₂) sich wie das Glas in einem Treibhaus verhalten, die die Wärme in der Erdatmosphäre gefangen halten und (wegen der menschlichen industriellen Emissionen) den Planeten gefährlich überhitzen.
An den Biology Cabinet Laboratories konnte Professor Nahle nun Woods erstaunliche Ergebnis bestätigen:
Dieser hatte die ganze Zeit recht!
Nach der wissenschaftlichen Begutachtung bestätigen die Ergebnisse, dass der sog. "Treibhauseffekt" allein durch die Blockierung des konvektiven Wärmetransfers innerhalb der Umgebung, in der er sich abspielt, verursacht wird.
In diesem Fall war das ein Laborkasten aus Karton.
Mit einem Deckel aus unterschiedlichen lichtdurchlässigen Materialien.
Aber undurchlässig bzw. durchlässig für Infrarot.
Sie sind in jedem Zubehörhandel zu bekommen.
Zitat Tatsächlich ist es nur das Bedeckung der Laborbox (umfunktioniert zum 'Treibhaus'), dass die Wärme die ganze Zeit "eingefangen" hat.
Die Box (oder "Treibhaus") ist etwas, das die Wissenschaftler ein 'geschlossenes System' nennen; wohingegen die Erdatmosphäre überhaupt nicht geschlossen ist, sondern ziemlich weit zum Weltraum hin offen ist, so dass die Wärme frei entweichen kann.
Die Ergebnisse von Nahle zertrümmern nicht die Phantastereien eines Latif sondern z.B. auch die Behauptungen eines Professor Pratt von der Stanford University, dessen eigene Wiederholung von Woods Experiment, als die erste offizielle Rekonstruktion von Woods Test seit einem Jahrhundert beworben worden ist.
Pratt hatte behauptet, dass er Woods Ergebnisse widerlegt hat.
"Das ist der Grund für meinen Entschluss, das Experiment von Professor Pratt zu wiederholen, um seine Ergebnisse und damit die von Professor Wood zu bestätigen oder zu widerlegen", sagt Nahle von Biology Cabinet.
ABSTRACT
Through a series of controlled experiments, I demonstrate that the warming effect in a real greenhouse is not due to longwave infrared radiation trapped inside the greenhouse, but to the blockage of convective heat transfer with the surroundings, as proven by Professor Wood in his 1909 experiment.
INTRODUCTION
In 1909, Professor Wood conducted an experiment consisting of testing the effect of the longwave infrared radiation trapped inside a greenhouse with respect to the elevated temperature inside a greenhouse during insolation.
His experiment was described in an article that he published in the journal Philosophical Magazine, in 1909. (See reference [1]).
From his experiment, Professor Wood found that the increase in temperature inside a greenhouse was not due to trapped radiation but to the blockage of convective heat transfer between the interior of the greenhouse and the open atmosphere.
Given that there are no other documents by other scientists who have tried to repeat the experiment of Professor Wood, except the experiment by Professor Pratt [8], which contradicted the results of Professor Wood's experiment, another science investigation by a third arbitrator is not only recommendable, but necessary.
This is the reason that I decided to repeat the experiment of Professor Pratt to either falsify or verify his results and those of Professor Wood.
...
GENERAL CONCLUSIONS:
The greenhouse effect inside greenhouses is due to the blockage of convective heat transfer with the environment and it is not related, neither obeys, to any kind of "trapped" radiation.
Therefore, the greenhouse effect does not exist as it is described in many didactic books and articles.
The experiment performed by Prof. Robert W. Wood in 1909 is absolutely valid and systematically repeatable.
In average, the blockage of convective heat transfer with the surroundings causes an increase of temperature inside the greenhouses of 10.03 °C with respect to the surroundings temperature.
Kurzfassung:
Durch diese kontrollierte Experiment demonstriere ich, dass die wärmende Wirkung in einem echten Treibhaus nicht durch langwellige Infrarot-Strahlung die im Inneren des Treibhauses eingeschlossen wird, erzeugt wird, sondern durch die Blockade der konvektiven Wärmeübertragung mit der Umgebung, wie von Professor Wood in seinem 1909 Experiment bewiesen.
⇧ 2004
↑ Brief von Ernst-Georg Beck an das UBA
-
Dimag / Ernst-Georg Beck
2004-04-26 de Brief von Ernst-Georg Beck an das UBASehr geehrter Herr W.,
ich habe von Ihrem Brief bezüglich Äußerungen auf der "Spatzenseite" Kenntnis erhalten.
Erlauben Sie mir kurz auf die von Ihnen gemachten Äußerungen und Hinweisen einige Bemerkungen zu machen.
Ich kenne die Internetseiten des UBA, die wichtigste Grundlagenliteratur zum Thema Klima und beschäftige mich beruflich wie privat seit 35 Jahren mit Naturwissenschaft (Biologie, Chemie, Physik, Elektrotechnik usw.).
-
Zunächst sind mir aus allen anderen naturwissenschaftlichen Fachbereichen keine Diskussionen mit "Skeptikern" bekannt.
Naturwissenschaft beruht auf logisch jederzeit nachvollziehbaren und beweisbaren Fakten.
Diese Aussage können wir leicht an Ihren "Wissenschaftlichen Grundlagen Klima(Schutz)Politik "http: //www.umweltbundesamt.de/klimaschutz/kww-ngk.htm überprüfen.
-
Weiterhin ist mir kein Physikbuch in irgendeiner Sprache bekannt, das Naturphänomene wie
"Treibhauseffekt",
"Gegenstrahlung";
"Strahlungsgleichgewicht" u.a. enthält.
-
Klima ist Wetter/Zeit.
Wetterprognosen sind heute nur innerhalb ca. 1 Woche seriös.
Sie machen Aussagen über das künftige Wetter bis 2100.
Nun zu Ihrer Internetseite "Naturwissenschaftliche Grundlagen der Klima(Schutz)Politik".
Die Seite ist voll von fachlichen Fehlern, unbeweisbaren Voraussetzungen, Spekulationen und jederzeit widerlegbaren Falschaussagen.
Besonders beschämend ist die Tatsache, dass für die hier kritisierten Aussagen so genannte "renommierte Wissenschaftler" verantwortlich sind, ein Zeichen für die mangelhafte fachliche Qualität dieser sog. Fachleute.
Meine Kommentare dagegen finden Sie in allen einschlägigen Fachlehrbüchern der Chemie, Biologie und Physik.
Sie schreiben:
"Die Konzentrationen der Treibhausgase nimmt seit dieser Zeit in der gesamten Atmosphäre zu.
So stiegen die Konzentrationen von Kohlendioxid (CO₂) um über 30 %, die des Methan (CH4) um 150 % und die des Distickstoffoxid (N2O) um 17 % weltweit gegenüber den Werten vorindustrieller Zeiten."
Kommentar:
Der Ausdruck "Treibhausgase" ist irreführend.
Die von Ihnen erwähnten Bestandteile der Atmosphäre sind <0,04 %, bei CO₂ kommt z.B. auf ca. 2.700 Luftteilchen ein CO₂-Molekül.
Also 99,96% d.h. die gesamte Atmosphäre hat sich nicht geändert.
Bitte nennen Sie mir eine wissenschaftlich verifizierbare Messung irgendwo auf der Erde, wo CO₂-Moleküle (oder Methan oder Stickoxide) der Atmosphäre nachweislich die 99,96 % Luft (N2, O2, Ar) erwärmen!!!
Sie werden keine finden!
Sie schreiben:
"Alle diese Stoffe und Gase, zu denen auch Wasserdampf und Ozon gehören, haben eine besondere Eigenschaft.
Sie lassen die von der Sonne (vor allem im sichtbaren, kurzwelligen Bereich) auf die Erde fallende, energiereiche Strahlung nahezu ungehindert passieren, absorbieren teilweise aber die im Gegenzug von der erwärmten Erde ausgehende langwellige Strahlung.
Kommentar:
Bis hierher ist noch alles richtig
Weiter:
Hierdurch werden sie in einen so genannten energetisch angeregten Zustand versetzt, um nach kurzer Zeit unter Aussendung infraroter Strahlung wieder in den ursprünglichen Grundzustand zurückzukehren. "
Kommentar:
Genau diese Aussage ist bezogen auf Erdnähe falsch und sie wird nicht besser, wenn man sie tausenden von Artikeln wiederholt.
Offensichtlich ignorieren Sie seit Jahrzehnten anerkanntes Wissen der Quantenphysik!
Die Abgabe der absorbierten Energie als infrarote Strahlung erfolgt nur, wenn Bedingungen wie Druck, Konzentration usw. es zulassen.
Unterhalb 10 km Höhe sind diese Bedingungen nicht gegeben (siehe Lehrbücher).
In unzähligen Forschungsarbeiten und Lehrbüchern (auch für CO₂) ist bekannt, dass angeregte Zustände bei Atomen und Molekülen eine Verweildauer haben.
Ist die Verweildauer länger als die Zeit zwischen 2 Teilchenkollisionen, so wird die Energie durch Kollision abgegeben (ohne Strahlung).
Da in der Atmosphäre 99 % andere nicht absorbierende Moleküle als z.B. CO₂ vorhanden sind, wird die absorbierte Energie des CO₂ gequencht, d. h. thermalisiert d.h. auf die anderen Gasteilchen übertragen.
Bitte erklären Sie mir, wie 1 CO₂ Molekül 2700 andere Luftmoleküle (N2,O2) so anstößt, das diese sich schneller bewegen (= erwärmen)???
Sie schreiben:
"Die Aussendung von Wärmestrahlung erfolgt gleichwertig in alle Raumrichtungen, d.h. zu einem erheblichen Anteil auch zurück zur Erdoberfläche ("thermische Gegenstrahlung").
Damit diese zusätzlich zugeführte Energiemenge dennoch abgestrahlt werden kann (dies muß erfolgen aus Gründen des dynamischen, energetischen Gleichgewichts , in dem sich Erde und Atmosphäre im Mittel befinden), muß die Erde eine entsprechend höhere Temperatur aufweisen."
Kommentar:
Die Erde befindet sich in einem zyklischen Ungleichgewicht.
Durch zyklische Sonnenbestrahlung werden ständig sämtliche Gleichgewichte verschoben.
Eine Abstrahlung muss nicht zwangsläufig erfolgen.
Es gibt kein Strahlungsgleichgewicht.
Diese künstliche Definition beschreibt nicht die realen energetischen Vorgänge.
Es gibt nur ein Energiegleichgewicht, bei dem z.B. Strahlungsenergie in kinetische Energie oder chemische Energie umgewandelt wird und darin gespeichert wird.
Eine Gegenstrahlung aus den obigen Gründen existiert nicht und kann nicht beobachtet werden.
Bitte legen Sie ein Emissionsspektrum atmosphärischen CO₂s vor, das durch Messung zweifelsfrei größere Dosen an IR-Emission aus atmosphärischem CO₂ nachweist.
Sie schreiben:
"Dies ist, kurz und vereinfacht gesagt, die Natur des Treibhauseffektes.
Die dabei beteiligten Gase werden allgemein als "Treibhausgase" bezeichnet."
Kommentar:
Es gibt keinen Treibhauseffekt.
Effekte wirken.
Die Emission von Spurengasen ist derart minimal, dass sie gegenüber anderen Wärmewirkungen vernachlässigbar sind.
Sie schreiben:
"Obwohl die Auslöser des Treibhauseffektes mengenmäßig kaum ins Gewicht fallen, ist die Wirkung dieses Effektes erheblich.
Ohne die natürlicherweise vorkommenden Treibhausgase wäre ein Leben auf unserem Planeten gar nicht möglich.
Statt einer globalen Erdmitteltemperatur von ca. 15 °C, wie wir sie heute messen, würde eine mittlere Temperatur von etwa -18 °C auf der Erde zu verzeichnen sein.
Der natürliche Treibhauseffekt sichert also unser irdisches Leben."
Kommentar:
Diese Aussagen sind nachweislich falsch, bzw. nicht beweisbar.
-
Das Leben ist vor Jahrmilliarden im Wasser, unter einer völlig anderen Atmosphäre entstanden.
Bis vor ca. 600 Millionen Jahre, nachdem die Natur schon alle wichtigen biologischen Erfindungen, samt Wirbeltiere gemacht hat fand alles Leben im Wasser, ohne "Treibhausgase" statt.
-
Sie können keine globale Erdmitteltemperatur messen, sie wurde errechnet!!!
Wo gibt es bitte 15 °C im Mittel?
Erzählen Sie das mal den Bewohnern von Key West, die bei mittleren Temperaturen von 23 °C leben mit Schwankungen um 3 °C, oder denen in Sibirien bei -18 °C mit Schwankungen um 60 °C.
-
Die Behauptung einer Atmosphäre ohne "Treibhausgase" ist nicht beweisbar,
oder zeigen Sie mir eine Erde ohne Atmosphäre!
Sie schreiben:
"Durch die Zunahme der Treibhausgaskonzentrationen kommt es zu einer Verstärkung des natürlichen Treibhauseffektes und zu einem Anstieg der bodennahen Lufttemperatur.
Der natürliche Treibhauseffekt ist lebensnotwendig - seine Verstärkung durch menschlichen Eingriff gibt Anlaß zur Sorge.
Jede Veränderung eines Klimafaktors (hier der Zusammensetzung der Atmosphäre) kann über vielseitige Wechselwirkungen zu weitreichenden und raschen Änderungen im gesamten Klimasystem führen.
Da die Ökosysteme und auch unsere derzeitige Zivilisation an die derzeitigen Klimabedingungen angepaßt sind, können solche Änderungen bedrohliche Folgen haben."
Kommentar:
Wie leicht jedem Gymnasiasten erklärbar, können sich die bodennahen Lufttemperaturen durch die oben genannten Spurengase nicht erwärmen.
Ihre Schlussfolgerungen sind Unsinn und da sie politisch umgesetzt werden Propaganda!
Sie schreiben:
"Welche Auswirkung die Zunahme der Treibhausgaskonzentrationen, nicht nur auf die Temperatur, sondern auf das gesamte Klima hat, ist nicht so einfach zu beantworten.
Da es keine einfachen geradlinigen Ursache - Wirkungsketten (linearen Kausalketten) im Klimasystem gibt, hat die Änderung eines Parameters (z.B. der Strahlung) die Änderung vieler Parameter (z.B. Temperatur, Druck, Verdunstung, Bewölkung usw.) zur Folge.
Darüber hinaus kommt es auch noch zu positiven und negativen Rückkopplungen.
Deshalb ist es nötig, Klimamodelle einzusetzen und mit Hilfe hochleistungsfähiger Computer mögliche künftige Klimaänderungen zu simulieren."!
Kommentar:
Wenn Sie Computersimulationen mit falschen Parametern oder unvollständigen Zusammenhängen laufen lassen werden sie ebenfalls falsche Ergebnisse erhalten.
Nun zu den Aussagen des letzten IPCC-Berichtes.
Dessen Aussagen sind inzwischen fast alle widerlegt:
Im 20. Jahrhundert trat auf der Nordhalbkugel die stärkste Erwärmung der letzten 1000 Jahre auf.
Das Jahrzehnt von 1990-1999 stellt die bisher wärmste Dekade dar, wobei sieben der zehn weltweit wärmsten Jahre des letzten Jahrhunderts nach 1989 auftraten
Kommentar:
Das 20. Jahrhundert war weder das wärmste der letzten 1000 Jahre, noch stimmen die anderen Aussagen.
In der mittelalterlichen Warmzeit mit einem Optimum um 1160 war es in Mitteleuropa und weltweit um 2-3 °C wärmer. (Siehe Buch "Klimageschichte Mitteleuropas" Prof. Glaser).
Dies ist auch durch Soon und Baliunas nachgewiesen.
Die Mann'sche Hockeystickkurve ist nachweislich falsch.
Es gab global die kleine Eiszeit und das Mittelalterliche Optimum.
Die restlichen Punkte sind Spekulation und Wetterprognosen der Zukunft.
-
[Wie] sich das Klima auch in Zukunft ändern wird.
Für die globale mittlere Lufttemperatur (regional sind deutliche Abweichungen zu erwarten) geben die bereits erwähnten Klimamodelle
eine Erhöhung bis zum Jahre 2100 zwischen 1,4 und 5,8 °C.
Im selben Zeitraum wird infolge der thermischen Ausdehnung des wärmeren Wassers der Ozeane und des Abschmelzens der Gletscher
ein Meeresspiegelanstieg zwischen 10 und 90 cm erwartet;
Viele Klimamodelle weisen auch auf dramatische Veränderungen
der globalen und regionalen Niederschläge hin.
Bereits jetzt unter Wassermangel leidende
Gebiete können noch trockener werden.
Es wird erwartet, dass
meteorologische Extremereignisse zunehmen.
Kommentar:
Die Gletscher der Erde machen ca. 6 % des Eises der Eismassen der Erde aus.
Von 160'000 Gletschern sind erst von 42 seit 10 Jahren die Eismassenveränderungen bekannt. (siehe: Braithwaite, 2002 " Glacier mass balance: the first 50 years of international monitoring" (Progress in Physical Geography 26: 76-95) (9))
Über Gletscher bzw. einen globalen Trend ist praktisch nichts bekannt.
94 % des Eises ist in der Arktis und Antarktis bzw. Grönland enthalten.
Die Temperatur nimmt dort seit 50 Jahren ab, CO₂ steigt.
(Overpeck et. al 1997 http://www.ngdc.noaa.gov/paleo/sciencepub/front.htm)
National Climatic Data Center (NCDC)
Paleoclimatology Data (Wayback‑Archiv)Paleoclimatology data are derived from natural sources such as tree rings, ice cores, corals, and ocean and lake sediments.
These proxy climate data extend the archive of weather and climate information hundreds to millions of years.
The data include geophysical or biological measurement time series and some reconstructed climate variables such as temperature and precipitation.
NCEI provides the paleoclimatology data and information scientists need
to understand natural climate variability
and future climate change.
We also operate the World Data Service for Paleoclimatology, which archives and distributes data contributed by scientists around the world.
Wo ist der Treibhauseffekt???
Es gilt: Naturwissenschaftliche Theorien sind nicht zu verwechseln mit dem Begriff Theorie der Umgangssprache, sondern sind in der Realität bewährte Beschreibungen der Naturgesetze.
Ihre Ausführungen stellen keine bewährten Beschreibungen der Realität dar, da zwanglos das Gegenteil, bzw. deren Falschheit bewiesen und beobachtet werden kann.
Also sind alle politisch daraus gezogenen Schlussfolgerungen offensichtlich Ideologie und Propaganda, Kyoto eine Farce.
Da sie zu einer Bundesbehörde gehören, sind Sie den Bürgern der Bundesrepublik für Ihr Handeln verantwortlich.
Da Sie nachweislich wissenschaftlichen Unsinn verbreiten, fordere ich Sie auf, umgehend Ihre Seiten entsprechend zu korrigieren.
Sehr geehrter Herr Weiß, wie ich lesen kann gehören Sie zur Abteilung "Schutz der Erdatmosphäre".
Was wollen Sie schützen?
die Zusammensetzung, die Mengenverhältnisse, deren physikalische Eigenschaften?
Im Mittelalter hat man Personen mit solchen Absichten Alchemisten genannt.
Mit freundlichen Grüßen
Ernst-Georg Beck
Dipl. Biol., Biesheim -
|
Ernst-Georg Beck *1948 †2010-09-21 |
Dipl. Biologe, Biesheim, Frankreich
|
⇧
8 Falscher CO2-Verstärkungseffekt des IPCC
en
Wrong CO2 Feedback Effekt of the IPCC
fr
Faux effet de rétroaction du CO2 du GIEC
⇧ de Verzeichnis en Contents fr Sommaire
|
⇧ Welt-Info
|
|
Rückkopplung / Feedback / Rétroaction |
| ▷Die Kalte Sonne Blog‑Themen Vahrenholt/Lüning ▶Die kalte Sonne | de ▷CO2-Verstärker (Wasserdampf und Wolken) |
| Wikipedia |
de
Gletscher en Glacier fr Glacier |
| Vademecum |
▶Rückkopplung/Feedback
▶Welt-Info |
⇧ de Allgemein en General fr Générale
| de | en | fr |
|---|---|---|
|
Klimawandel: Wissenschaft Wasserdampf / Wolken |
Climate change: Science Water vapor / Clouds |
Changement climatique: Science Vapeur d'eau / nuages |
|
Wolkenforschung, Korrelation zwischen der kosmischen Strahlung und der Wolkenbildung, Korrelation zwischen Wolken und Temperatur, Der Wasserdampfverstärker für das CO2, Das Geheimnis der Wolken. |
||
| de | en | fr |
|---|---|---|
|
Klimawandel: Wissenschaft Der CO2-Treibhauseffekt |
Climate change: Science The CO2 Greenhouse Effect |
Changement climatique: Science L'éffet de serre du CO2 |
| Einleitung | Introduction | Introduction |
| Die Klimasensitivität von CO₂ | Climate sensitivity of CO₂ | La sensibilité climatique du CO₂ |
|
Die CO₂-Sättigung: Wenn die CO₂-Konzentration zunimmt, ist die Erwärmung wegen der Sättigung kleiner |
The CO₂ Saturation: As Carbon Dioxide increases it has less Warming Effect |
La saturation du CO₂: Lorsque la concentration du CO₂ augmente, son effet de réchauffement diminue |
| Der Streit um die Rückkopplungen | The argument about the feedbacks | L'argument des rétroactions |
| Der fehlende Hotspot (warme Zone) | The missing Hotspot | Le 'hotspot' (point chaud) manque |
| ERBE Earth Radiation Budget Experiment | ERBE Earth Radiation Budget Experiment | ERBE Earth Radiation Budget Experiment |
| de | en | fr |
|---|---|---|
| Zusammenhänge | Correlations | Corrélations |
| CO2 kann keinen Klimawandel verursachen | CO2 cannot cause a Climate Change | CO2 ne peut pas causer un changement climatique |
| de | en | fr |
|---|---|---|
| Physikalische Aspekte | Physical aspects | Aspects physiques |
| Strahlungsantrieb | Radiative forcing | Forçage radiatif |
⇧ de Text en Text fr Texte
↑
a Der Streit um die Rückkopplungen
en The argument about the feedbacks
fr L'argument des rétroactions
Mit folgendem Link wird von anderen Webseiten auf diese Seite verwiesen.
▶Der Streit um die Rückkopplungen
de
Die Klimamodelle vs. Sichtweise der Skeptiker
Der Streit dreht sich ausschließlich um die Rückkopplungen.
en
The climate models vs. The skeptic's view
The argument is entirely about the feedbacks.
|
de
Positiver oder negativer Verstärkungseffekt |
|
|
de Falls sich der CO2-Gehalt verdoppelt (was bei der gegenwärtigen Rate frühestens 2070 oder 2100 der Fall sein kann) simulieren die Klimamodelle eine Temperaturzunahme wegen dieses zusätzlichen CO2 um 1,1°C × 3 = 3,3°C. Die Klimawissenschaftler der Regierung und die Medien erzählen uns oft etwas über die direkte Auswirkung von CO2,
geben aber selten zu, dass |
de Falls sich das CO2-Niveau verdoppelt, beträgt die daraus resultierende Temperaturzunahme etwa 1,1°C × 0,5 = 0,6°C. Die seriösen skeptischen Wissenschaftler stimmten immer mit den Klimawissenschaftlern der Regierung über die direkten Auswirkungen des CO2 überein. Der Streit dreht sich ausschließlich um die Rückkopplungen. |
|
en If the CO2 level doubles (as it is on course to do by about 2070 to 2100), the climate models estimate the temperature increase due to that extra CO2 will be about 1.1°C × 3 = 3.3°C. The government climate scientists and the media often tell us about the direct effect of the CO2,
but rarely admit that |
en If the CO2 level doubles, skeptics estimates that the temperature increase due to that extra CO2 will be about 1.1°C × 0.5 = 0.6°C. The serious skeptical scientists have always agreed with the government climate scientists about the direct effect of CO2. The argument is entirely about the feedbacks. |
Quelle / Source:
-
EIKE Europäisches Institut für Klima und Energie
2012-03-03 de The Skeptics CaseWir vergleichen die wesentlichen Vorhersagen der Klimamodelle mit den besten und neuesten Daten.
Glücklicherweise liegen die Klimamodelle mit all ihren wesentlichen Vorhersagen falsch.
Warum? Jeder ernsthafte skeptische Wissenschaftler hat seit über 20 Jahren immer das Gleiche gesagt, und doch haben die meisten Leute diese Botschaft noch nie gehört - hier kommt sie, einfach genug beschrieben, so dass auch jeder interessierte Laie das lesen und verstehen kann.
-
Watts Up With That? (Antony Watts)
2012-02-26 en The Skeptics CaseWe check the main predictions of the climate models against the best and latest data.
Fortunately the climate models got all their major predictions wrong.
Why? Every serious skeptical scientist has been consistently saying essentially the same thing for over 20 years, yet most people have never heard the message - here it is, put simply enough for any lay reader willing to pay attention.
↑
b Rückkopplung
en Feedback
fr Effet d'amplification
de Verzeichnis en Contents fr Sommaire
- 2018
- de
Es ist vorbei -
Der Klimaalarmismus als Folge 120 Jahre alter Fehler
Rückkoppelung als universelles Prinzip in Technik und Natur. - 2010
- de Rückkopplung im Klimasystem der Erde
de Text en Text fr Texte
⇧ 2018
↑
Es ist vorbei -
Der Klimaalarmismus als Folge 120 Jahre alter Fehler
Rückkoppelung als universelles Prinzip in Technik und Natur
-
IKEK-11 / Michael Limburg
2018-01-11 en
Es ist vorbei - Der Klimaalarmismus als Folge 120 Jahre alter Fehler
Als Einleitung zum Vortrag von Lord Christopher Monckton, erläutert Dipl.-Ing. Michael Limburg am Beispiel (des Fliehkraftreglers) einer Dampfmaschine und der Rückkoppelung als universelles Prinzip in Technik und Natur, wie dies mit dem Klimasystem zusammenhängt.
Er macht an der Rückkoppelung im Klimasystem deutlich, dass ein Vergleich zwischen Änderungen der Körpertemperatur und der "Erdtemperatur", der oft von der Wissenschaft (in diesem Fall von Prof. Schellnhuber) verwendet wird, nicht vergleichbar und falsch ist.
⇧ 2010
↑ de Rückkopplung im Klimasystem der Erde!
-
EIKE Europäisches Institut für Klima und Energie
2010-08-10 de Rückkopplung im Klimasystem der Erde!In der Diskussion der Rolle von CO2 auf das Erdklima herrscht insoweit Einigkeit, dass der Einfluss vom CO2 SELBER sehr gering ist.
Die Temperaturerhöhung durch die seit 1850 gestiegene CO2 Konzentration in der Atmosphäre dürfte nur Bruchteile von 1 °C betragen.
Die vom UN-Klimarat um Größenordnungen höher vorausgesagten Anstiege der Erdtemperatur basieren auf Annahmen über die "Rückkopplung" mit dem atmosphärischen Wasserdampf.
Als vernünftiger Wissenschaftler wird man also davon ausgehen, dass die Erde mit dem Wasserdampf einen Thermostaten besitzt, der die Erdtemperatur gegen Störungen konstant hält.
Dafür spricht ein physikalisches Grundprinzip und entsprechende Ergebnisse von Messungen.
Weiterhin lässt sich damit die erstaunliche Klimakonstanz der Erde über Jahrmillionen verstehen.
Und NUR mit diesem Ergebnis lassen sich die Widersprüche in den Angaben der offiziellen Klimaforschung lösen.
Schließlich kann eingewendet werden, die Stabilisierung durch Rückkopplung habe doch Grenzen, jenseits derer doch Katastrophen auftreten können (in der Regeltechnik nennt man dies den "Haltebereich").
Tatsächlich kann das Wasser nicht den Einfluss beliebig großer Mengen an CO2 "wegregeln".
Dieser Thermostat funktioniert nur so weit wie Wasser alles dominiert; der Einfluss z.B. von CO2 klein ist gegen den von Wasserdampf.
Wasserdampf liegt in der Atmosphäre im Prozentbereich vor.
Unter Einbeziehung der spektroskopischen Eigenschaften kann man daher vermuten, dass der Regelmechanismus z.B. ab einer CO2-Konzentration von vielleicht 10% nicht mehr greifen würde.
Das wären dann tatsächlich die vielgenannten "Kipp-Punkte" und Katastrophen. Die wären tatsächlich denkbar ... wenn, ja wenn... die CO2- Konzentration in der Atmosphäre ca. 300 mal höher wäre als sie heute ist.
↑
c Positiver oder negativer Verstärkungseffekt
en Feedback of CO2
fr Effet d'amplification du CO2
↑ de Positiver oder negativer Verstärkungseffekt
IPCC: Annahme einer positiven Verstärkung
Das heisst: bei einer Verdoppelung von CO2 verstärkt sich die Erwärmung wegen dem Einfluss des Wasserdampfes.
-
Die gesamte alarmistische Klima-Hypothese des IPCC basiert auf der Annahme einer positiven Verstärkung des minimalen theoretischen CO2-Treibhaus-Effektes,durch Wasserdampf in der Atmosphäre, die man auch in allen Klima-Rechenmodellen zugrunde gelegt hat.
-
Der Effekt von CO2 alleine ist außerordentlich gering: nur etwa 0,6 °C bei CO2-Verdoppelung entsprechend dem international anerkannten MODTRANS-Rechenprogramm für die Strahlungsphysik der Atmosphäre.
-
Für die IPCC-Annahme einer 5-fachen Verstärkung durch Wasserdampf (beziehungsweise einer 2,5 bis 10-fachen Verstärkung, so genau weiß man es leider nicht) gab es jedoch bisher keinen Beweis.
Richard Lindzen: Negative Verstärkung
Das heisst: bei einer Verdoppelung von CO2 hat tritt nicht nur keine Erwärmung sondern eine Abkühlung durch den Wasserdampf auf.
-
Basierend auf seinem Vortrag bei der 2. Internationalen Klima-Konferenz in New York im März 2009 hat der bekannte amerikanische Klimaforscher und Meteorologie-Professor Richard Lindzen vom MIT nachgewiesen, dass es keinen positiven (Verstärkungs-) Effekt durch Wasserdampf existiert, sondern dass im Gegenteil eine negative Verstärkung auftritt, d.h. eine Abschwächung des Erwärmungseffektes durch CO2-Anstieg eintritt.
-
EIKE Europäisches Institut für Klima und Energie
2009-04-02 de MIT- Klimatologe Prof. Lindzen widerlegt postulierte Treibhaus-Verstärkungseffekt des IPCC
↑ en Positive or negative feedback
Computer models have large positive feedbacks:
Stress that alarming predictions depend critically on the fact that models have large positive feedbacks.
-
The crucial question is whether nature actually behaves this way?
-
The answer is unambiguously no.
-
Heartland Institute
Richard Lindzen, the Alfred P. Sloan Professor of Meteorology at the Massachusetts Institute of Technology
2009-03-08 en Climate Alarm: What We Are Up Against, and What to Do
↑
d Verstärkungseffekt der Temperatur
en Feedback of the temperature
fr Effet d'amplification de la température
↑ en Negative feedback stabilizes a system
Regulating mechanism:
This presentation is not intended to go into any of the technical details of modeling, or of the science of climate.
However, there are a couple of aspects of those technical details which should, in broad general terms, be understood by those responsible for policy. These issues, in fact, are where we must be diligent in clarifying the science and separating fact from myth.
-
One of these issues is feedback.
Feedback in climate systems is a regulating mechanism within the climate system that dampens or enhances fluctuations, most particularly fluctuations in temperature. -
If, for example, a climate change that is produced by a slight increase in temperature will itself further increase the temperature, that is positive feedback.
-
But if that temperature-increase-induced change will tend to reduce the increase, that is negative feedback.
Visualization:
One visualization of the difference between positive and negative feedback is to consider what happens to us when we take a shower.
-
If the water temperature is exactly what we want and doesn't change, feedback has no impact.
-
But suppose the temperature drifts up a bit, gets hotter.
We reach over, and either turn the cold up a bit, or the hot down a bit until we return to our ideal temperature.
That is how negative feedback stabilizes a system.
-
However, consider our shower with the faucets incorrectly marked, the cold faucet marked hot and the hot marked cold.
When the temperature drifts hot, we may turn higher the faucet marked cold. But this is really the hot faucet, and so the flow gets ever hotter.
If we try to correct temperature by turning down the faucet marked hot (when actually this is the cold line) the water again gets hotter.
The more feedback response there is, the hotter and hotter the flow gets.
This is positive feedback.
Computer models:
If computer models represent critical phenomena in such a way
-
... that the feedback is always positive
-
... it is inevitable that with increasing CO2 the result will be excessive heating.
Satellite records:
The satellite records of outgoing heat radiation show that the climate
-
... is dominated by negative feedbacks
-
... and that the response to doubled and even quadrupled CO2 would be minimal.
-
Heartland Institute / John H. Sununu
2009-03-10 en The Politics of Global Warming
↑
e Verstärkungseffekt von Wolken
en Feedback of Clouds
fr Effet d'amplification de nuages
Starker negativer Verstärkungseffekt durch Wolken in einem warmen Klima
en Strong negative cloud feedbacks in a warmer climate
fr Effet d'amplification de la température
Suggestions of "strong negative cloud feedbacks" in a warmer climate
![]()
![]()

-
Watts Up With That? (Antony Watts)
2009-06-12 en Suggestions of "strong negative cloud feedbacks" in a warmer climate
2010-08-28 en Congratulations (finally) to Spencer and Braswell on getting their new paper published
-
JOURNAL OF GEOPHYSICAL RESEARCH, VOL. 115, D16109,
doi:10.1029/2009JD013371, 2010
Roy W. Spencer and William D. Braswell
Received 12 October 2009; revised 29 March 2010; accepted 12 April 2010; published 24 August 2010.
en
On the diagnosis of radiative feedback in the presence
of unknown radiative forcing
| Roy W. Spencer |
Ph.D. is a principal research scientist for the University of Alabama
in Huntsville and the U.S. Science Team Leader for the Advanced
Microwave Scanning Radiometer (AMSR-E) on NASA's Aqua satellite.
▶Roy W. Spencer: Who is who (Skeptiker) ▶Roy W. Spencer: Video (Präsentationen) ▶Roy W. Spencer: Websites (English) ▶Ausschluss und Maulkorb für Kritiker (The mission of NASA) |
NASA-Klimamodell zeigt, daß das durch CO2
beschleunigte Pflanzenwachstum einen kühlenden Effekt hat
en NASA climate model shows plants slow Global Warming by creating a new negative feedback in response to increased CO2
-
Klimaskeptiker Info
2010-12-07 de NASA-Klimamodell zeigt, daß das durch CO2 beschleunigte Pflanzenwachstum einen kühlenden Effekt hatEin NASA-Klimamodell hat errechnet, daß das durch mehr verfügbares CO2 gesteigerte Pflanzenwachstum in einer Welt mit einer CO2-Verdopplung eine neue negative Rückkopplung erzeugen würde, mit anderen Worten eine Kühlung, die der "globalen Erwärmung" entgegenwirken würde.
Nach den Modellberechnungen soll der Kühleffekt global -0,3°C betragen, über Land sogar -0,6°C.
Ohne die negative Rückkopplung hätte das Modell eine Erwärmung um +1,94°C geliefert.
Da CO2 für sich allein bei einer Verdopplung nur eine Erwärmung von etwa 1,0°C zugeschrieben wird, enthält das Modell offenbar positive Rückkopplungen. Diese positiven Rückkopplungen (etwa duch Wasserdampf) sind empirisch nicht bestätigt und - wie auch diese Modellrechnung wieder zeigt - die entscheidende Stellschraube bei den Computermodellen.
Empirische Untersuchungen von Prof. Lindzen und Dr. Spencer hingegen deuten darauf hin, daß insgesamt die negativen Rückkopplungen dominieren.
Immerhin hat die (ansonsten stets alarmistisch eingestellte) NASA hiermit eine weitere negative Rückkoppplung eingeräumt. Der Raum für die angebliche globale Erwärmung durch CO2 wird immer kleiner.
-
Watts Up With That? (Antony Watts)
2010-12-07 en NASA climate model shows plants slow Global Warming by creating a new negative feedback in response to increased CO2
Quelle / Source:
-
NASA
2010-12-07 en 'Greener' Climate Prediction Shows Plants Slow Warming
↑
f Wasserdampf-Rückkopplung ist stark negativ
en Water vapor feedback is strongly negative
-
EIKE Europäisches Institut für Klima und Energie
2012-06-03 de Neue Studie: Wasserdampf-Rückkopplung ist stark negativDas IPCC hält den Klimaalarm mit der Hypothese aufrecht, dass das CO2 den Wasserdampfgehalt reguliert, und zwar dergestalt, dass es zu einem positiven "Runaway"-Effekt kommt.
Der Physiker Clive Best hat seine neue Studie gepostet, in der er zeigt, dass die Wasserdampf-Rückkopplung vielmehr stark negativ ist.
Dies basiert sowohl auf dem Schwache-Sonne-Paradoxon als auch auf einem Vergleich von 5600 Wetterstationen im CRUTEM4-Datensatz von Temperatur und Feuchtigkeit.
Wissenschaftlich begutachtete Veröffentlichungen von Paltridge und anderen kommen ebenfalls zu dem Ergebnis, dass die Wasserdampf-Rückkopplung stark negativ ist.
Ohne die positive Wasserdampf-Rückkopplung bricht die IPCC-Basis einer katastrophalen anthropogenen Klimaänderung zusammen.
Kommentar von Elmar Oberdörffer:
Allein die Tatsache, daß wir diese Klimaänderungen in einem gemäßigten und dabei weitgehend stabilen Klima diskutieren, beweist, daß das Klima durch eine negative Rückkopplung stabilisiert wird.
Gäbe es eine positive Rückkopplung, so würde jede kleine Störung eines fiktiven Gleichgewichtsklimas zu einer sich beschleunigenden Abweichung des Klimas in Richtung der ursprünglichen Störung führen, bis irgend ein extremer Zustand erreicht wird, der nicht mehr gesteigert werden kann.
Wir wären also schon lange in einer permanenten Eiszeit oder in einer permanenten Hölle gefangen, wenn es die vom IPCC behauptete positive Rückkopplung durch den Wasserdampf gäbe.
-
THE HOCKEY SCHTICK
2012-05-23 en New paper finds water vapor feedback is strongly negativeThe IPCC manufactures climate alarm by assuming CO2 controls water vapor to produce a runaway positive feedback system.
Physicist Clive Best has posted his new paper showing that water vapor feedback is instead strongly negative, based on both the Faint Sun Paradox and a comparison of 5600 weather stations in the global CRUTEM4 temperature and humidity database.
Peer-reviewed publications by Paltridge and others also find water vapor feedback is strongly negative.
Without positive water vapor feedback, the IPCC's case for catastrophic man-made climate change collapses.
-
Clive Best
2009-04-02 en Evidence for Negative Water FeedbackAbstract:
Positive linear climate feedback for combined water effects is shown to be incompatible with the Faint Sun Paradox.
In particular, feedback values of ~2.0 W/m2K-1 favored by current GCM models lead to non physical results at solar radiation levels present one billion years ago.
A simple model is described whereby Earth like planets with large liquid water surfaces can self-regulate temperature for small changes in incident solar radiation.
The model assumes that reflective cloud cover increases while normalized greenhouse effects decrease as the sun brightens.
Net water feedback of the model is strongly negative. Direct evidence for negative water feedback is found in CRUTEM4 station data by comparing temperature anomalies for arid regions (deserts and polar regions) with those for humid regions (mainly saturated tropics).
All 5600 weather stations were classified according to the Köppen-Geiger climatology [9].
Two separate temperature anomaly series from 1900 to 2011 were calculated for each region.
A clear difference in temperature response is observed.
Assuming the difference is due to atmospheric water content, a water feedback value of -1.5 +/- 0.8 W/m2K-1 can be derived.
CONCLUSIONS
The Faint Sun Paradox effectively rules out constant positive climate feedbacks for water.
The evidence supports the hypothesis that the Earth's oceans have stabilized temperatures for the last 4 billion years.
It is proposed that the net effect of a surface with 70% water coverage self regulates Earth's climate.
A simple model that demonstrates how this could arise has been described.
The model leads to average temperatures increasing by just 5 degrees over 4 billion years.
This leads to predicted negative feedbacks from water of about -2 watts/m2/ºC.
Direct evidence that the temperature response from arid and humid land regions on Earth are different has been identified in CRUTEM4 data.
Assuming that these divergences are only due to atmospheric water vapor differences a measured negative feedback for water of 1.5+/-0.8 watts/m2/ºC.
This agrees with that needed to explain the Faint Sun Paradox
↑
g Negative CO2-Wasserdampf-Rückkopplung bei Pflanzen
en Negative water vapor feedback in plant evapotranspiration
-
Klimaskeptiker Info
2011-03-03 de Negative CO2-Wasserdampf-Rückkopplung bei Pflanzen gefundenNeue Forschungsergebnisse zeigen jetzt eine weitere negative Rückkopplung, die den AGW-Thesen zuwiderläuft:
Die Zunahme des CO2 in der Luft soll demnach bei Pflanzen eine Abnahme der Stomata beiwrken, durch die die Pflanzen Wasserdampf an die Luft abgeben.Kurz: Mehr CO2 führt bei Pflanzen zu weniger Verdunstung - und damit zu weniger Treibhausgas-Erwärmung.
-
Whatts Up With That? (Antony Watts)
2011-03-04 en Negative water vapor feedback in plant evapotranspiration foundAs carbon dioxide levels have risen during the last 150 years, the density of pores that allow plants to breathe has dwindled by 34 percent, restricting the amount of water vapor the plants release to the atmosphere
Quelle / Source:
-
EurekAlert
2011-03-03 en Rising CO2 is causing plants to release less water to the atmosphere, researchers say
⇧
9 Einfluss der Sonne
en
The CO2 Impact of the Sun
fr
Impacte du soleil
- Ursachen
- de Ursachen des Klimawandels
- de Wirkung der Sonne mit und ohne Solarverstärker
- Diverse Webseiten
↑ Ursachen
↑ Ursachen des Klimawandels
| de | en | fr |
|---|---|---|
|
Klima: Wandel Ursachen des Klimawandels |
Climate: Change Causes of Climate Change |
Climat: Changement Les causes du changement climatique |
|
Einflüsse auf das Klima Temperatur der Erde Klima-Beobachtungen Neuste Meldungen zum Klimawandel |
Impacts on Climate Change Earth Temperature Climate Observations News on Climate Change |
Impacts sur le climat Température de la terre Observations sur le climat Dernières nouvelles sur le changement climatique |
↑ Wirkung der Sonne mit und ohne Solarverstärker
| de | en | fr |
|---|---|---|
|
Fehler der Klimamacher, Teil I Unterschied zwischen direkter und indirekter Wirkung der Sonne |
Errors, Part I Difference between the influence of Solar brihgtness and Solar activity |
Erreurs, partie I Différence entre l'influence du rayonnement solaire et de l'activité solaire |
↑ Diverse Webseiten
de Verzeichnis en Contents fr Sommaire
- 2019
- de
90 italienische Wissenschaftler unterzeichnen Petition gegen
Klimaalarm
en 90 Leading Italian Scientists Sign Petition: CO2 Impact On Climate "UNJUSTIFIABLY EXAGGERATED" ... Catastrophic Predictions "NOT REALISTIC"Aber uns muss bewusst sein, dass KOHLENDIOXID SELBST NICHT EIN SCHADSTOFF IST.
Im Gegenteil.
Es ist für das Leben auf unserem Planeten unentbehrlich.
- de
Wieviel Klimawandel macht der Mensch? -
Eine kritische Überprüfung der IPCC-Thesen
AfD-Fraktion Bundestag - 2018
- de Immer wenn die Klimamodelle kühlen sollen, streuen wir einfach Vulkanstaub hinein
- de Die Sonnenallergie der Klimaforscher
- 2016
- de
Prof. Dr. Werner Kirstein: Erdklima vs. Klimapolitik
- 2012
- de
Fritz Vahrenholt in SWR1-Leute
- 2003
- de Himmlischer Treibhauseffekt, Kosmische Strahlung bestimmt unser Klima
de Text en Text fr Texte
⇧ 2019
↑
90 italienische Wissenschaftler unterzeichnen Petition gegen
Klimaalarm
en
90 Leading Italian Scientists Sign Petition: CO2 Impact
On Climate "UNJUSTIFIABLY EXAGGERATED" ...
Catastrophic Predictions "NOT REALISTIC"
-
Die kalte Sonne (Fritz Vahrenholt & Sebastian Lüning)
2019-07-05 de 90 italienische Wissenschaftler unterzeichnen Petition gegen KlimaalarmWir müssen "auf die Wissenschaftler hören" predigen die Klima-Panikmacher.
Ja, in Italien haben vor kurzem über 90 Wissenschaftler eine Petition unterzeichnet mit dem Titel: "Klima, eine Gegenstrom-Petition":
An den Präsidenten der Republik
An den Präsidenten des Senats
An den Präsidenten der Abgeordnetenkammer
An den Präsidenten des Rats
PETITION ZUR GLOBALEN ANTHROPOGENEN ERWÄRMUNG
Die Unterzeichnenden, Bürger und Wissenschaftler, schicken eine warme Einladung an die politischen Führungskräfte, eine Umweltschutzpolitik einzuführen, welche im Einklang mit den wissenschaftlichen Erkenntnissen steht.
Insbesondere ist es dringend, die Verschmutzung dort zu bekämpfen, wo sie auftritt, gemäß den Befunden der modernsten Wissenschaft.
Diesbezüglich ist die Verzögerung beklagenswert, mit welcher der Wissensreichtum, der von der Welt der Forschung zur Verfügung gestellt wird, benutzt wird, um die anthropogenen Schadstoffemissionen zu reduzieren, welche sowohl in den kontinentalen als auch Meeresumweltsystemen weit verbreitet vorhanden sind.
Aber uns muss bewusst sein, dass KOHLENDIOXID SELBST NICHT EIN SCHADSTOFF IST.
Im Gegenteil.
Es ist für das Leben auf unserem Planeten unentbehrlich.
In den letzten Jahrzehnten hat sich eine These verbreitet,
dass die Erwärmung der Erdoberfläche um rund 0,9°C, welche ab 1850 beobachtet worden ist, anomal wäre und ausschließlich von menschlichen Aktivitäten verursacht werden würde, insbesondere durch den Ausstoß von CO2 in die Atmosphäre beim Gebrauch fossiler Brennstoffe.
Dies ist die These der anthropogenen globalen Erwärmung, welche von dem Weltklimarat (IPCC) der Vereinten Nationen gefördert wird, deren Konsequenzen Umweltveränderungen sein würden, die so ernst wären, dass man enormen Schaden in der unmittelbaren Zukunft fürchten muss, außer wenn drastische und kostenintensive Abschwächungsmaßnahmen unverzüglich ergriffen werden.
Diesbezüglich sind viele Nationen in der Welt Programmen beigetreten, um Kohlendioxidemissionen zu reduzieren, und werden unter Druck gesetzt, auch durch eine nicht nachlassende Propaganda, zunehmend fordernde Programme anzunehmen, deren Umsetzung, welche mit hohen Belastungen auf die Wirtschaften der einzelnen Mitgliedsstaaten verbunden ist, von Klimakontrolle abhängig wäre und daher die "Rettung" des Planeten.
Jedoch ist der anthropogene Ursprung der globalen Erwärmung EINE UNBEWIESENE HYPOTHESE,
nur abgeleitet von einigen Klimamodellen, d.h. komplexen Computerprogrammen, genannt 'General Circulation Models'.
Hingegen hat die wissenschaftliche Literatur zunehmend die Existenz einer natürlichen Klimaschwankung betont,
welche die Modelle nicht reproduzieren können.
Diese natürliche Schwankung erklärt einen beachtlichen Teil der globalen Erwärmung, welche seit 1850 beobachtet worden ist.
Die anthropogene Verantwortung für die Klimaveränderung, welche in dem letzten Jahrhundert beobachtet worden ist,
wird daher UNGERECHTFERTIGT ÜBERTRIEBEN
und Katastrophenvorhersagen SIND NICHT REALISTISCH.
Das Klima ist das komplexeste System auf unseren Planeten,
daher muss man sich damit mit Methoden befassen, welche adäquat sind und mit seinem Niveau der Komplexität übereinstimmen.
Klimasimulationsmodelle reproduzieren nicht die beobachtete natürliche Schwankung des Klimas
und rekonstruieren insbesondere nicht die warmen Perioden der letzten 10.000 Jahre.
Diese haben sich ungefähr alle tausend Jahre wiederholt und schließen
die gut bekannte mittelalterliche Warmzeit ein,
die heiße römische Periode,
und generell die Warmzeiten während des "Holozänen Optimums".
Die PERIODEN DER VERGANGENHEIT SIND AUCH WÄRMER GEWESEN ALS DIE GEGENWÄRTIGE ZEIT,
obwohl die CO2 Konzentration niedriger war als die gegenwärtige,
dieweil sie mit den tausendjährigen Zyklen der Sonnenaktivität verbunden sind.
Die Auswirkungen werden von den Modellen nicht reproduziert.
Es sollte daran gedacht werden,
dass die Erwärmung, welche seit 1900 beobachtet worden ist,
tatsächlich in den 1700en begann, d.h. am Tiefpunkt der Kleinen Eiszeit, der kältesten Periode der letzten 10.000 Jahre
(übereinstimmend mit dem tausendjährigen Tiefpunkt der Sonnenaktivität, welche Astrophysiker Maunder Minimum nennen).
Seitdem ist die Sonnenaktivität, ihrem tausendjährigen Zyklus folgend, angestiegen, wobei sie die Erdoberfläche erwärmt.
Des Weiteren versagen die Modelle dabei, die bekannten Klimaschwankungen von ungefähr 60 Jahren zu reproduzieren.
Diese waren zum Beispiel verantwortlich für eine Warmzeit (1850-1880)
gefolgt von einer kühleren Periode (1880-1910),
eine Erwärmung (1910-40),
eine Abkühlung (1940-70)
und einer neuen wärmeren Periode (1970-2000) ähnlich der, welche 60 Jahre früher beobachtet wurde.
Die folgenden Jahre (2000-2019) sahen einen Anstieg, der nicht von den Modellen vorhergesagt wurde, von ungefähr 0,2°C pro Jahrzehnt,
und eine beachtliche Klimastabilität,
welche sporadisch von den schnellen natürlichen Schwankungen des äquatorialen Pazifischen Ozeans unterbrochen wurde, bekannt als die El Nino Southern Oscillations, wie diejenige, welche zu der temporären Erwärmung zwischen 2015 und 2016 führte.
Die Medien behaupten auch,
dass extreme Ereignisse, wie z.B. Hurrikans und Zyklone, alarmierend angestiegen sind. Umgekehrt sind diese Ereignisse, wie viele Klimasysteme, seit dem zuvor erwähnten 60-Jahre-Zyklus moduliert worden.
Zum Beispiel, wenn wir die offiziellen Daten von 1880 über tropische Atlantikzyklone betrachten, welche Nordamerika getroffen haben,
scheinen sie eine starke 60-Jahre Schwankung zu haben, entsprechend der thermischen Schwankung des Atlantiks, genannt Atlantic Multidecadal Oscillation (=atlantische mehrdekadische Schwankung).
Die Spitzen, welche pro Jahrzehnt beobachtet wurden, sind in den Jahren 1880-90, 1940-50 und 1995-2005 miteinander kompatibel.
Von 2005 bis 2015 nahm die Anzahl der Zyklone ab, wobei dies präzise dem zuvor erwähnten Zyklus folgte.
Somit gibt es in der Zeitspanne von 1880-2015 zwischen der Anzahl der Zyklone (welche schwanken) und dem CO2 (welches monoton ansteigt) keine Korrelation.
Das Klimasystem wird noch nicht ausreichend verstanden. Obwohl es wahr ist, dass CO2 ein Treibhausgas ist, ist laut dem IPCC die Klimasensitivität auf dessen Anstieg in der Atmosphäre immer noch extrem unsicher.
Es wird geschätzt, dass eine Verdoppelung der Konzentration des atmosphärischen CO2 von ungefähr 300ppm vorindustriell auf 600ppm die Durchschnittstemperatur des Planeten von einem Minimum von 1°C bis zu einem Maximum von 5°C erhöhen kann.
Diese Unsicherheit ist enorm.
Jedenfalls schätzen viele neue Studien, die auf experimentellen Daten
basieren, dass
die Klimasensitivität auf CO2
BEDEUTEND NIEDRIGER ist
als jene, die von den IPCC Modellen geschätzt wird.
Dann ist es wissenschaftlich unrealistisch, die Verantwortung für die Erwärmung, welche vom vergangenen Jahrhundert bis heute beobachtet wurde, den Menschen zuzuschreiben.
Die voreilenden Vorhersagen der Panikmacher sind daher nicht glaubwürdig, da sie auf Modellen basieren, deren Ergebnisse den experimentellen Daten wiedersprechen.
Alle Beweise legen nahe,
dass diese MODELLE den anthropogenen Beitrag ÜBERSCHÄTZEN
und die natürliche Klimaschwankung unterschätzen,
besonders jene, die von der Sonne, dem Mond und den Meeresschwankungen verursacht wird.
Schließlich veröffentlichen die Medien die Nachricht,
laut dessen es in Bezug auf die menschliche Ursache der gegenwärtigen Klimaänderung einen fast einstimmigen Konsens unter den Wissenschaftlern gibt, dass die wissenschaftliche Debatte abgeschlossen werden würde.
Jedoch müssen wir uns zuerst einmal bewusst werden, dass die wissenschaftliche Methode bestimmt, dass die Fakten und nicht die Anzahl der Anhänger eine Mutmaßung zu einer gemeinsamen wissenschaftlichen Theorie machen.
Wie dem auch sei, der gleiche angebliche Konsens EXISTIERT NICHT.
Es gibt tatsächlich eine bemerkenswerte Variabilität an Meinungen unter den Spezialisten - Klimatologen, Meteorologen, Geologen, Geophysiker, Astrophysiker - von denen viele einen wichtigen natürlichen Beitrag zur globalen Erwärmung anerkennen, welche von der vorindustriellen Zeit und sogar von der Vorkriegszeit bis heute beobachtet worden ist.
Es hat auch Petitionen gegeben, welche von tausenden von Wissenschaftlern unterschrieben worden sind,
die eine abweichende Meinung zur Mutmaßung der anthropogenen globalen Erwärmung ausgedrückt haben.
Diese umfassen diejenige, welche 2007 von dem Physiker F. Seitz gefördert wurde, ehemaliger Präsident der American National Academy of Science, und diejenige, welche von dem nichtstaatlichen Weltklimarat (NIPCC) gefördert wurde, deren Bericht von 2009 zu dem Schluss kommt, dass "die Natur, und nicht die Aktivität des Menschen, regiert das Klima".
Zum Schluss, angesichts der ENTSCHEIDENDEN WICHTIGKEIT, WELCHE FOSSILE TREIBSTOFFE für die Energieversorgung der Menschheit haben, schlagen wir vor,
dass sie nicht der Politik von kritikloser Reduzierung der Emission von Kohlendioxid in die Atmosphäre unterworfen werden sollten mit DEM ILLUSORISCHEN ANSCHEIN DES BEHERRSCHENS DES KLIMAS.
FÖRDERKOMITEE :
- Uberto Crescenti, Emeritus Professor of Applied Geology, University G. D'Annunzio, Chieti-Pescara, formerly Rector and President of the Italian Geological Society.
- Giuliano Panza, Professor of Seismology, University of Trieste, Academician of the Lincei and of the National Academy of Sciences, called of the XL, 2018 International Award of the American Geophysical Union.
- Alberto Prestininzi, Professor of Applied Geology, La Sapienza University, Rome, formerly Scientific Editor in Chief of the magazine International IJEGE and Director of the Geological Risk Forecasting and Control Research Center.
- Franco Prodi, Professor of Atmospheric Physics, University of Ferrara.
- Franco Battaglia, Professor of Physical Chemistry, University of Modena; Galileo Movement 2001.
- Mario Giaccio, Professor of Technology and Economics of Energy Sources, University G. D'Annunzio, Chieti-Pescara, former Dean of the Faculty of Economics.
- Enrico Miccadei, Professor of Physical Geography and Geomorphology, University G. D'Annunzio, Chieti-Pescara.
- Nicola Scafetta, Professor of Atmospheric Physics and Oceanography, Federico II University, Naples.
UNTERZEICHNENDE
- Antonino Zichichi, Emeritus Professor of Physics, University of Bologna, Founder and President of the Ettore Center for Scientific Culture Majorana di Erice.
- Renato Angelo Ricci, Professor Emeritus of Physics, University of Padua, former President of the Italian Society of Physics and Society European Physics; Galileo Movement 2001.
- Aurelio Misiti, Professor of Health-Environmental Engineering, University of Sapienza, Rome.
- Antonio Brambati, Professor of Sedimentology, University of Trieste, Project Manager Paleoclima-mare of PNRA, already President of the National Oceanography Commission.
- Cesare Barbieri, Professor Emeritus of Astronomy, University of Padua.
- Sergio Bartalucci, Physicist, President of the Association of Scientists and Tecnolgi for Italian Research.
- Antonio Bianchini, Professor of Astronomy, University of Padua.
- Paolo Bonifazi, former Director of the Institute of Interplanetary Space Physics, National Astrophysical Institute.
- Francesca Bozzano, Professor of Applied Geology, Sapienza University of Rome, Director of the CERI Research Center.
- Marcello Buccolini, Professor of Geomorphology, University University G. D'Annunzio, Chieti-Pescara.
- Paolo Budetta, Professor of Applied Geology, University of Naples.
- Monia Calista, Researcher in Applied Geology, University G. D'Annunzio, Chieti-Pescara.
- Giovanni Carboni, Professor of Physics, Tor Vergata University, Rome; Galileo Movement 2001.
- Franco Casali, Professor of Physics, University of Bologna and Bologna Academy of Sciences.
- Giuliano Ceradelli, Engineer and climatologist, ALDAI.
- Domenico Corradini, Professor of Historical Geology, University of Modena.
- Fulvio Crisciani, Professor of Geophysical Fluid Dynamics, University of Trieste and Marine Sciences Institute, Cnr, Trieste.
- Carlo Esposito, Professor of Remote Sensing, La Sapienza University, Rome.
- Mario Floris, Professor of Remote Sensing, University of Padua.
- Gianni Fochi, Chemist, Scuola Normale Superiore of Pisa; scientific journalist.
- Mario Gaeta, Professor of Volcanology, La Sapienza University, Rome.
- Giuseppe Gambolati, Fellow of the American Geophysica Union, Professor of Numerical Methods, University of Padua.
- Rinaldo Genevois, Professor of Applied Geology, University of Padua.
- Carlo Lombardi, Professor of Nuclear Plants, Milan Polytechnic.
- Luigi Marino, Geologist, Geological Risk Forecasting and Control Research Center, La Sapienza University, Rome.
- Salvatore Martino, Professor of Seismic Microzonation, La Sapienza University, Rome.
- Paolo Mazzanti, Professor of Satellite Interferometry, La Sapienza University, Rome.
- Adriano Mazzarella, Professor of Meteorology and Climatology, University of Naples.
- Carlo Merli, Professor of Environmental Technologies, La Sapienza University, Rome.
- Alberto Mirandola, Professor of Applied Energetics and President of the Research Doctorate in Energy, University of Padua.
- Renzo Mosetti, Professor of Oceanography, University of Trieste, former Director of the Department of Oceanography, Istituto OGS, Trieste.
- Daniela Novembre, Researcher in Mining Geological Resources and Mineralogical Applications, University G. D'Annunzio, Chieti Pescara.
- Sergio Ortolani, Professor of Astronomy and Astrophysics, University of Padua.
- Antonio Pasculli, Researcher of Applied Geology, University G. D'Annunzio, Chieti-Pescara.
- Ernesto Pedrocchi, Professor Emeritus of Energetics, Polytechnic of Milan.
- Tommaso Piacentini, Professor of Physical Geography and Geomorphology, University G. D'Annunzio, Chieti-Pescara.
- Guido Possa, nuclear engineer, formerly Deputy Minister Miur.
- Mario Luigi Rainone, Professor of Applied Geology, University of Chieti-Pescara.
- Francesca Quercia, Geologist, Research Director, Ispra.
- Giancarlo Ruocco, Professor of Structure of Matter, La Sapienza University, Rome.
- Sergio Rusi, Professor of Hydrogeology, University G. D'Annunzio, Chieti-Pescara.
- Massimo Salleolini, Professor of Applied Hydrogeology and Environmental Hydrology, University of Siena.
- Emanuele Scalcione, Head of Regional Agrometeorological Service Alsia, Basilicata.
- Nicola Sciarra, Professor of Applied Geology, University G. D'Annunzio, Chieti-Pescara.
- Leonello Serva, Geologist, Director of Geological Services of Italy; Galileo Movement 2001.
- ??Luigi Stedile, Geologist, Geological Risk Review and Control Research Center, La Sapienza University, Rome.
- Giorgio Trenta, Physicist and Physician, President Emeritus of the Italian Association of Medical Radiation Protection; Galileo Movement 2001.
- Gianluca Valenzise, ??Director of Research, National Institute of Geophysics and Volcanology, Rome.
- Corrado Venturini, Professor of Structural Geology, University of Bologna.
- Franco Zavatti, Astronomy Researcher, University of Bologna.
- Achille Balduzzi, Geologist, Agip-Eni.
- Claudio Borri, Professor of Construction Sciences, University of Florence, Coordinator of the International Doctorate in Engineering Civil.
- Pino Cippitelli, Agip-Eni Geologist.
- Franco Di Cesare, Executive, Agip-Eni.
- Serena Doria, Researcher of Probability and Mathematical Statistics, University G. D'Annunzio, Chieti-Pescara.
- Enzo Siviero, Professor of Ponti, University of Venice, Rector of the e-Campus University.
- Pietro Agostini, Engineer, Association of Scientists and Tecnolgi for Italian Research.
- Donato Barone, Engineer.
- Roberto Bonucchi, Teacher.
- Gianfranco Brignoli, Geologist.
- Alessandro Chiaudani, Ph.D. agronomist, University G. D'Annunzio, Chieti-Pescara.
- Antonio Clemente, Researcher in Urban Planning, University G. D'Annunzio, Chieti-Pescara.
- Luigi Fressoia, urban architect, Perugia.
- Sabino Gallo, nuclear engineer.
- Daniela Giannessi, First Researcher, Ipcf-Cnr, Pisa.
- Roberto Grassi, Engineer, Director of G & G, Rome.
- Alberto Lagi, Engineer, President of Restoration of Complex Damaged Plants.
- Luciano Lepori, Ipcf-Cnr Researcher, Pisa.
- Roberto Madrigali, Metereologo.
- Ludovica Manusardi, Nuclear physicist and scientific journalist, Ugis.
- Maria Massullo, Technologist, Enea-Casaccia, Rome.
- Enrico Matteoli, First Researcher, Ipcf-Cnr, Pisa.
- Gabriella Mincione, Professor of Sciences and Techniques of Laboratory Medicine, University G. D'Annunzio, Chieti-Pescara.
- Massimo Pallotta, First Technologist, National Institute for Nuclear Physics.
- Enzo Pennetta, Professor of Natural Sciences and scientific divulger.
- Nunzia Radatti, Chemist, Sogin.
- Vincenzo Romanello, Nuclear Engineer, Research Center, Rez, Czech Republic.
- Alberto Rota, Engineer, Researcher at Cise and Enel.
- Massimo Sepielli, Director of Research, Enea, Rome.
- Ugo Spezia, Engineer, Industrial Safety Manager, Sogin; Galileo Movement 2001.
- Emilio Stefani, Professor of Plant Pathology, University of Modena.
- Umberto Tirelli, Visiting Senior Scientist, Istituto Tumori d'Aviano; Galileo Movement 2001.
- Roberto Vacca, Engineer and scientific writer.
-
NoTricksZone (Pierre L. Gosselin)
2019-07-04 en 90 Leading Italian Scientists Sign Petition: CO2 Impact On Climate "UNJUSTIFIABLY EXAGGERATED" ... Catastrophic Predictions "NOT REALISTIC"NOTE: The English version of the petition that follows below is an unpolished translation of the original Italian version.
The English version still needs to be polished up a bit, but it fully and accurately conveys the overall thrust of the original Italian version.
To the President of the Republic
To the President of the Senate
To the President of the Chamber of Deputies
To the President of the Council
PETITION ON GLOBAL ANTHROPGENIC HEATING
(Anthropogenic Global Warming, human-caused global warming)
...
|
|
90 italienische Wissenschaftler unterzeichnen Petition gegen Klimaalarm Manifeste: 90 italienische Wissenschaftler unterzeichnen Petition gegen Klimaalarm |
↑
Wieviel Klimawandel macht der Mensch? -
Eine kritische Überprüfung der IPCC-Thesen
AfD-Fraktion Bundestag
-
AfD-Fraktion Bundestag
Dr. Sebastian Lüning, Autor von "Die kalte Sonne"
2019-01-29 de
Wieviel Klimawandel macht der Mensch? -
Eine kritische Überprüfung der IPCC-Thesen
Vortrag von Dr. Sebastian Lüning
Klimamodelle scheitern dabei, die enorme vorindustrielle Klimadynamik abzubilden.
In den Simulationen scheinen wichtige Klimaeinflussfaktoren zu fehlen.
Sehen Sie dazu einen Vortrag unseres Gastredners Dr. Sebastian Lüning, Autor von "Die kalte Sonne".
-
Deutscher Bundestag
Ausschuss für Umwelt, Naturschutz und nukleare Sicherheit
2019-04-03 de Öffentliches Fachgespräch zu dem Thema "CO2-Bepreisung"
-
Deutscher Bundestag
Ausschussdrucksache
Dr. habil. Sebastian Lüning, Geowissenschaftler
2019-04-03 de Stellungnahme zum öffentlichen Fachgespräch mit dem Thema "CO2-Bepreisung" des Ausschusses für Umwelt, Naturschutz und nukleare Sicherheit im Deutschen Bundestag am 3. April 2019, Berlin
Audioausschnitt:
Das passiert mit Kritikern des IPCC
- Augusto Mangini, Universität Heidelberg, Institut für Umweltphysik
- Bundesanstalt für Geowissenschaften und Rohstoffe (BGR)
⇧ 2018
↑ Immer wenn die Klimamodelle kühlen sollen, streuen wir einfach Vulkanstaub hinein
-
Die kalte Sonne (Fritz Vahrenholt & Sebastian Lüning)
2018-07-24 de Immer wenn die Klimamodelle kühlen sollen, streuen wir einfach Vulkanstaub hineinDie erste Abbremsung soll durch El Nino/La Nina verursacht worden sein.
Immerhin ein Ozeanzyklus.
Seltsam aber, dass die PDO nicht genannt wird.Der zweite Slowdown (1941-1975) soll durch Vulkane verursach worden sein.
Haha, einmal laut gelacht.
Das war natürlich die PDO, die während dieser Zeit abgestürzt war:
Die Pazifisch Dekadische Oszillation (PDO) besitzt eine
Zyklendauer von ca. 60 Jahren.

Die Pazifisch Dekadische Oszillation erhöht bzw. erniedrigt die Temperatur um jeweils etwa 0,2°C je nach PDO-Phase.
Der Erwärmungsstop im Jahr 2000 fällt mit dem Abstieg der PDO zusammen und stellt eine Wiederholung der Situation aus den 1940er Jahren dar
Aber es gibt ja nicht nur die PDO, sondern eine ganze Flöte von weiteren klimasysteminternen Zyklen.
Nehmen wir zum Beispiel die AMO. Auch sie besitzt einen etwa 60-jährigen Zyklus, der jedoch um 10-20 Jahre zeitverzögert zur PDO abläuft.
Und auch die Nordatlantische Oszillation (NAO) schwingt in diesem Größenmaßstab.
Ist es nicht verwunderlich, dass all diese Zyklen in ähnlichen Zeitmaßstäben schwingen, wenn auch nicht synchron?
Und hinter dem dritten Slowdown soll eine Kombination aus El Nino und Vulkanen stecken.
Folland und Kollegen tricksen hier, dass sich die Balken biegen.
Im Abstract bringen sie zwar die Sonne als Erwärmungsbremser für den kürzlichen Hiatus ins Spiel.
Auf phys.org ist davon keine Rede mehr.
Und wenn die Sonne bremsen kann, dann könnte sie auch beschleunigen, wofür in den Modellen aber gar kein Platz ist, denn angeblich soll ja nahezu die gesamte Erwärmung der letzten 120 Jahre durch Treibhausgase verursacht worden sein.
Unterm Strich kein Durchbruch im Verständnis der natürlichen Klimavariabilität.
Stattdessen wird der Vulkan-Joker überstrapaziert.
Immer wenn Kühle gebraucht wird, wird einfach Vulkanstaub in die Computer-Klimawelt gestreut.
Frei nah Pippi Langstrumpf:
Ich mach mir die Welt, widewide wie sie mir gefällt.
| de | en | fr |
|---|---|---|
|
Wetterphänomene Vulkane |
Weather phenomena Volcanos |
Phénomènes météorologiques Volcans |
| de | en | fr |
|---|---|---|
|
Klimawandel: Wissenschaft Ozeanzyklen & Ozeanische Oszillationen |
Climate change: Science Ocean Cycles & Ocean Oscillations |
Changement climatique: Science Cycles et oscillations océaniques |
| Ozeanzyklen steuern das Klima / El Niño (der Knabe/warm) & La Niña (das Mädchen/kalt) / ENSO: El Niño-Southern Oscillation / AMO: Atlantic Multidecadal Oscillation / NAO: North Atlantic Oscillation / AO: Arctic Oscillation / IOD: Indischer Ozean Dipol / PDO: Pacific decada oscillation | ||
↑ Die Sonnenallergie der Klimaforscher
-
EIKE Europäisches Institut für Klima und Energie
Ulli Kulke
2018-06-29 de Die Sonnenallergie der KlimaforscherDie Klimaforschung meidet die Sonne wie der Teufel das Weihwasser.
Aktuelle Studien zeigen jedoch:
Sie könnte eine größere Rolle im Klimageschehen spielen, als die herkömmlichen Modelle uns sagen wollen.
Womöglich auch eine größere als das Kohlendioxid.
Und deshalb würde man das am liebsten ignorieren.
Wie lange noch?
Es bleibt spannend und die Debatte ist alles andere als beendet.
Kosmische Strahlung
Ionisierende Partikel, die permanent auf die Erdatmosphäre einprasseln.
Dabei handelt es sich um einen Teilchenstrom, der von explodierenden Supernovae stammt,
durch die Galaxie fließt
und schließlich, in der Erdatmosphäre angekommen, Einfluss auf die Wolkenbildung ausübt, sie verstärkt.
Hier kommt nun die Sonne ins Spiel:
Sie ist es nämlich, die diesen Teilchenstrom entscheidend moduliert.
Deshalb, so sagt Svensmark, sei sie der hauptsächliche Akteur des irdischen Klimageschehens.
Nicht das CO2.
Der Mechanismus ist seit vielen Jahren im Gespräch.
Längst unbestritten ist der Einfluss der Sonne auf die galaktische Strahlung.
Der Teilchenstrom trifft auf die Erdatmosphäre,
ionisiert dort vorhandene mikroskopisch kleine Schwebstoffe, sogenannte "Aerosole",
sorgt so dafür, dass diese sich vergrößern,
dass Wasserdampf an ihnen kondensiert und sich so Wolken bilden.
Und zwar in den unteren Schichten der Atmosphäre, also dort, wo sie kühlend auf die Erdtemperatur einwirken, weil sie die wärmenden Strahlen der Sonne wieder zurückwerfen.
Wolken in den oberen Schichten dagegen halten die auf die Erde eingestrahlte Wärme in der Atmosphäre zurück, erhitzen sie also eher, als dass sie sie kühlen.
-
Die kalte Sonne (Fritz Vahrenholt & Sebastian Lüning)
2018-06-30 de Die Sonnenallergie der KlimaforscherEinfluss der Sonne auf die Klimaschwankungen
Auch wenn der Einfluss der Sonne auf die Klimaschwankungen in den letzten Jahrzehnten etwas in den Hintergrund gerückt ist:
Es gibt sie, die Forscher, die die schwankende Wirkkraft unseres Zentralgestirns auf das Geschehen in der Erdatmosphäre untersuchen, damit auch auf den Klimawandel - und die dabei überraschende Ergebnisse erzielen. Henrik Svensmark, Leiter der Sonnenforschung an der Technischen Universität Dänemarks in Kopenhagen, ist einer von ihnen.
Und er wagt sich weit vor in der Klimadebatte, dem Diskurs mit der womöglich bedeutendsten Tragweite unserer Zeit.
Er erhält Widerspruch, natürlich.
Dabei sind sich Svensmark und seine Fachkritiker einig:
Das Thema "Sonne" verdient in der Klimaforschung mehr Aufmerksamkeit.Dabei geht es den Beteiligten vor allem um das komplexe Zusammenspiel zwischen unserem Zentralgestirn und ionisierenden Sendboten aus den Tiefen der Galaxie - der "kosmischen Strahlung".
Die "Klimasensitivität"
Svensmark sagt: "Das Klima wird stärker durch Veränderungen der kosmischen Strahlung beeinflusst als durch das Kohlendioxid."
CO2 habe zwar auch eine Wirkung, klar, "aber sie ist weit geringer, als die meisten heutigen Klimamodelle vorgeben, und auch geringer als der Einfluss der kosmischen Strahlung".
So werde, seiner Einschätzung nach, eine Verdoppelung des Treibhausgases in der Atmosphäre eine Erhöhung der globalen Temperatur
um höchstens ein Grad bewirken, und nicht um zwei Grad, wie es heute als "Common sense" hingestellt wird.
Mit anderen Worten: Die "Klimasensitivität" von Kohlendioxid sei nur halb so groß wie angenommen.
Und, was die Veränderungen im natürlichen CO2-Haushalt der Erdatmosphäre und diejenigen der Temperatur über Zeiträume von Millionen Jahren angeht:
Da sei das Treibhausgas eher "ein Sklave der kosmischen Strahlung sowie der durch sie bewirkten Erderwärmung, und eben nicht ihr Herrscher".
Die Höhe des CO2-Anteils sei dabei im Großen und Ganzen der Erwärmung gefolgt, nicht umgekehrt.
Wie unser Klima- und Wettergeschehen durch jene kosmische Strahlung beeinflusst wird
Im vergangenen Dezember hat Svensmark erneut eine wissenschaftliche Studie in der Fachzeitschrift "Nature Communications" ("Nature"-Gruppe) veröffentlicht, mit der er seine These untermauern will.
In der Arbeit geht es - zunächst - weniger um die Sonne selbst, als darum, wie unser Klima- und Wettergeschehen durch jene kosmische Strahlung beeinflusst wird, ionisierende Partikel, die permanent auf die Erdatmosphäre einprasseln.
Dabei handelt es sich um einen Teilchenstrom, der von explodierenden Supernovae stammt, durch die Galaxie fließt und schließlich, in der Erdatmosphäre angekommen, Einfluss auf die Wolkenbildung ausübt, sie verstärkt.
Quelle / Source:
-
Achtgut / Ulli Kulke
2018-06-26 de Die Sonnenallergie der Klimaforscher
⇧ 2016
↑ Prof. Dr. Werner Kirstein: Erdklima vs. Klimapolitik
-
Prof. Dr. Werner Kirstein / TU Dresden 2018-04-12
2018-06-22 de
Klimawandel: Wird die Wissenschaft politisch beeinflusst?
Ist der Klimawandel menschengemacht?
Ganz klar nein, sagt Prof. Dr. Werner Kirstein.
Als Klimageograph kennt er die Daten der Klimaaufzeichnungen sehr genau.
Und so weiß er auch, dass der Gehalt von CO2 in unserer Atmosphäre nicht nur einen historischen Tiefstand aufweist, welcher nahezu kritische Auswirkungen auf die Flora haben, sondern die Temperatur keinesfalls beeinträchtigt.
Viel mehr ergeben die Daten, dass der Prozess genau umgekehrt ist.
Der CO2-Gehalt passt sich an die Temperatur an.
Im Dezember 2015 trafen sich in Paris mehr als 50.000 Menschen, um an dem Weltklima-Gipfel teilzunehmen.
Besonders stolz war man darauf, dass sich alle teilnehmenden Nationen für eine Reduzierung von Kohlenstoffdioxid (CO2) ausgesprochen und sich verpflichtet haben zu Reduzieren.
Wieviel und nach welchen Maßstäben wurde nicht definiert.
Ziel des Ganzen sei, durch den verminderten Aussoß von CO2 zu bewirken, dass sich die Erde nicht mehr als 2 Grad im Vergleich zum Beginn des Industrie-Zeitalters (ab Mitte des 19. Jhd.) erhöht.
Ein Grad davon haben wir bereits erreicht, so dass das Ergebnis des Klimagipfels letztlich die Absicht aussprach, dass der Mensch, nicht weiterhin das Klima so stark beeinflusst.
Klimawissenschaft und Klimapolitik stehen sich diametral gegenüber.
In diesem Vortrag zeigt Prof. Dr. Werner Kirstein auf, weshalb die Debatte um das Senken von CO2 ausschließlich politischen Zielen dient und keinesfalls der Umwelt, dem Weltklima oder den Menschen.
Faktentabelle
en Table of facts
fr Tableau de faits
|
|
de CO2-Konzentration und Temperatur vor 600 Millionen Jahren en CO2-Concentration in the atmosphere in the last 600 Millions of Years fr Concentration du CO2 depuis 600 millions ans
|
|
|
de Die aktuelle Eiszeit seit 500'000 Jahren en The actual Ice Age since 500'000 Years fr L'aire glacière actuelle depuis 500'000 ans Wenn sich der Klimazyklus der vergangenen 500'000 Jahre so fortsetzt, dann könnte das bedeuten, dass in wenigen tausend Jahren wieder der Rückfall auf das echte Eiszeit-Temperaturniveau mit Ausbreitung der Gletscher über Kanada und Skandinavien eintreten würde. |
| de | en | fr |
|---|---|---|
|
Neue Kälteperiode Eiszeiten & Warmzeiten |
New Cold Period Ice Ages & Warm Periods |
Nouvelle periode froide Glaciations & periodes chaudes |
|
|
de Das Holozän en The Holocene fr Le holocène de Das Holozän ist der jüngste Zeitabschnitt der Erdgeschichte; er dauert bis heute an. en The Holocene is a geological epoch which began at the end of the Pleistocene (at 11,700 calendar years BP) fr L'Holocène est une époque géologique s'étendant sur les 10'000 dernières années. |
|
|
de In den letzten 5'000 Jahren waren drei Warmzeiten (grün) wo es wärmer war als heute und die Erde hat dies überlebt. Geniessen Sie die Wärme noch solange sie dauert. en Over the last 5'000 years there were three warm periods (green sections) where it was warmer than today and the Earth survived. Enjoy the warmth while it lasts. fr Pendant les dernières 5'000 années il y avait trois periodes chaudes (vert) avec des températures plus élevés qu'aujourd'hui et la terre a survécue. Réjouissez-vous de la chaleur tant qu'elle dure. |
|
|
de Klima-Entwicklung in den letzten 3200 Jahren en Climat in the last 3200 Years fr Climat dans les 3200 dernières années/span> monte seulement après
|
|
|
de Die Mittelalterliche Warmzeit und die Kleine Eiszeit en Medieval Warm Period and the Little Ice Age fr L'optimum climatique médiéval et le petit âge glaciaire
|
|
|
de Meeresspiegel-Anstieg vor Kohlenwasserstoff-Anstieg Kein Einfluss von CO2 und der fossilen Energien! en Sea level rise before Hydrocarbon use increase
No influence of CO2 and fossile energy! fr Augmentation du niveau des océans avant l'augmentation des hydrocarbures Pas d'influence du CO2 et des énergies fossiles! |
|
|
de Der Anteil von CO2 in der Luft fr Concentration du CO2 actuelle
Sauerstoff (O2): 21 %
0,04 Volumen-Prozent der Luft Von den 0,04 Prozent CO2 in der Luft produziert die Natur 96,5 Prozent, der Rest, also 3,5 Prozent, der Mensch.
Der Mensch produziert also 3,5 % 0.0014 % der Luft sind etwa 1 Teil CO₂ auf 71'000 Teile Luft oder 1/71'000 der Luft. |
![]()
![]()
Die Realität: CO2-Rückgang seit 600 Millionen Jahren.
![]()
![]()
Entwicklung des CO2-Gehalts
der Atmosphäre in den letzten ca. 570 Mio. Jahren.
Der Parameter RCO2 bezeichnet das Verhältnis des Massenanteils an
CO2 in der Atmosphäre des jeweiligen Zeitpunkts
im Vergleich zum vorindustriellen Wert von ca. 300 ppm
(Grafik: W. H. Berger)
Demnach lag der CO2-Gehalt der Erdatmosphäre vor etwa 500-600 Millionen Jahren bis zu 20mal höher als in den letzten paar Jahrhunderten vor der industriellen Revolution.
Im Laufe der Zeit gab es dabei auch teils erhebliche Schwankungen.
So begann der CO2-Gehalt vor etwa 450 Millionen Jahren erheblich abzusinken, bevor er vor rund 250 Millionen Jahren erneut auf etwa den fünffachen heutigen Wert anstieg.
Seither nimmt er - wenn auch mit einer Reihe von Schwankungen - im Prinzip kontinuierlich ab.
Heute haben wir die seit 500-600 Millionen Jahren nahezu niedrigsten CO2-Konzentrationen in der Atmosphäre.
Würde man der obigen "Fieber"-Argumentation folgen, dann hätte die Erde vor Jahrmillionen fast schon kochen müssen.
So sprach der Schweizer Professor und IPCC-Berichts-Chef Thomas Stocker in einem Interview mit der Weltwoche am 11. 4. 2013 von einem Temperaturanstieg von 2 bis 4,5 °C pro Verdopplung des vorindustriellen CO2-Gehalts von 280 ppm.
Zahllose Fossilien belegen jedoch, dass sich die Tier- und Pflanzenwelt früherer Zeiten trotz eines um bis zu 2000 % höheren CO2-Gehalts im Großen und Ganzen bester Lebensbedingungen erfreute.
|
|
de Vom Menschen verursachtes CO₂ CO2 ist einer der wichtigsten Nährstoffe für Leben auf der Erde. Es hat sich in den letzten Perioden der großen Vereisung in der Eiszeit des Pleistozäns einem gefährlich niedrigen Niveau angenähert, und die menschlichen CO2-Emissionen können das Aushungern und den letztendlichen Tod des meisten Lebens auf dem Planeten aufgrund eines CO2-Mangels verhindern.
▶de
Die Auswirkungen von CO₂ auf das
Überleben des Lebens |
![]()
![]() IPCC AR 5 SYR Figure 1.5
IPCC AR 5 SYR Figure 1.5
|
|
de Falsche CO2-Konzentrationen von IPCC und Kyoto en Wrong CO2-Concentrations of IPCC and Kyoto fr Fausses concentrations du CO2 du GIEC et de Kyoto de Diese Annahmen für das Kyoto-Protokoll sind falsch en These data used as basis for the Kyoto-protocol are wrong fr Ces valeurs pris comme base du protocole de Kyoto sont fausses So macht man den Leuten Angst; so wird man hereingelegt. Dieses Bil wurde jahrelang als "Logo" der WG1 vom IPCC (Prof. Thomas Stocker) verwendet. |
![]()
![]()
|
|
de Der historische CO₂ Gehalt der Atmosphäre en Historical CO₂ concentration fr Concentratiion du CO₂ historique Es ergeben sich überraschende Erkenntnisse Sie zeigen vor allem, dass die Konzentration des CO2 deutlich höher war als 280 ppm, wie es die Proben aus den Eisbohrkernen zeigen und dass die zeitliche Verzögerung zwischen Temperatur- und folgender CO2-Änderung viel geringer als 800 Jahre sein könnte. Sie zeigen aber auch, dass immer erst die Temperatur- und dann die CO2-Änderung erfolgte. |
|
|
de Die Daten aus Pflanzenstomata zeigen eine viel größere Variabilität des atmosphärischen CO₂-Gehaltes über die letzten 1000 Jahre als die Daten aus Eiskernen. Sie zeigen außerdem, dass der Gehalt während des vorigen Jahrtausends oft zwischen 300 und 340 ppmv lag, einschließlich eines Anstiegs um 120 ppmv vom späten 12. Jahrhundert bis zum mittleren 14. Jahrhundert. Die Stomatadaten deuten auch einen höheren CO₂-Gehalt an als die auf dem Mauna Loa gemessenen Werte; jedoch nähern sich beide Werte mit einem gleitenden Mittel über 5 Punkte ganz gut an ... |
en Plant stomata data show much greater variability of atmospheric CO₂ over the last 1,000 years than the ice cores and that CO₂ levels have often been between 300 and 340ppmv over the last millennium, including a 120ppmv rise from the late 12th Century through the mid 14th Century. The stomata data also indicate higher CO2 levels than the Mauna Loa instrumental record. |
|
|
de Eine Überprüfung historischer chemischer Analysen (Beck, 2007) zeigt sogar eine noch größere Variabilität des CO₂-Anteils in der Atmosphäre als die Daten aus den Pflanzenstomata ... en A survey of historical chemical analyses (Beck, 2007) shows even more variability in atmospheric CO2 levels than the plant stomata data since 1800. |
Forschungen der CO2-Konzentrationen in der Vergangenheit
en Research on CO2 concentrations in the past
fr Recherches sur la concentration du CO2 dans le passé
![]()
![]()
![]()
▶Ernst-Georg Beck: Forschungen der CO2-Konzentrationen in der Vergangenheit
|
de Diese Balken zeigen den zusätzlichen Erwärmungseffekt von je 20 ppm mehr CO2 in der Atmosphäre. en This graph shows the additional warming effect of each extra 20 ppm of atmospheric CO2. fr Ce graphique montre l'effet induit par chaque 20 ppm supplémentaires de CO2 sur la température de l'air. |
de Wenn die CO2-Konzentration zunimmt, hat es einen kleineren Erwärmungseffekt en As Carbon Dioxide increases it has less Warming Effect fr Lorsque la concentration du CO2 augmente, son effet de réchauffement diminue de Kohlendioxid absorbiert schon nahezu soviel es kann. Wir zeigen Ihnen, warum eine Verdoppelung von CO2 nicht viel Änderung bewirkt. Der Effekt heute ist vernachlässigbar, er ist nicht messbar. en Carbon dioxide is already absorbing almost all it can. Here's why it's possible that doubling CO2 won't make much difference. And the effect is already so small, it's unmeasurable. fr Le dioxyde de carbone absorbe déjà presque toute l'énergie possible. Voici pourquoi le doublement de la teneur en CO2 ne changera pas grand chose. L'effet est tellement faible qu'il n'est pas mesurable. |
|
|
de Diese Balken zeigen den zusätzlichen Erwärmungseffekt von je 20 ppm mehr CO2 in der Atmosphäre. en This graph shows the additional warming effect of each extra 20 ppm of atmospheric CO2. fr Ce graphique montre l'effet induit par chaque 20 ppm supplémentaires de CO2 sur la température de l'air. |
de
Die natürliche Erwärmung durch CO2 wird
durch die blauen Säulen dargestellt,
Jede Erhöhung des CO2-Niveaus um 20 ppm über
das vorindustrielle Niveau bringt einen Temperaturanstieg von etwa
0,03°C natürliche Erwärmung Um an diese globale Erwärmung zu glauben, ist ein "Sprung in den Glauben" nötig.
en
The natural heating effect of carbon dioxide is the blue bars
Each 20 ppm increment above 280 ppm provides about 0.03° C of
naturally occurring warming This is the leap of faith required to believe in global warming. |
|
|
de
Zuerst steigt die Temperatur und erst nachher steigt das CO₂ Wichtig: Das CO2 kann also nicht der Grund für die Erwärmung sein! en First the temperature rises, CO₂ rises afterwards Important: Therefore CO2 cannot be the cause for global warming! fr D'abord c'est la température qui monte, le CO₂ monte seulement après Important: Le CO2 ne peut donc pas être la cause du rechauffement! |
|
|
Great Global Warming Swindle - Al Gore Excerpt
|
||
|
||
|
|
|
|
|
|
de Das CO2 steigt und die Temperaturen fallen en CO2 is rising and the temperatures are falling fr Le CO2 monte, les températures baissent de Das CO2 steigt, die Temperaturen fallen. Wenn das CO2 die Erwärmung erklärt, muss es auch die Abkühlung erklären ... en CO2 is rising, the temperatures are falling. If the CO2 explains the warming, it must also explain the cooling ... fr Le CO2 monte, les températures baissent. Si le CO2 explique le réchauffement, il doit aussi expliquer le refroidissement ... |
|
Solar Activity Variations |
de Sonne, kosmische Strahlung und Wolkenbildung en Sun, Cosmic Rays and Cloud Cover fr Le soleil, les rayons cosmiques et la formation de nuages de Die Sonnenaktivität steuert die Kosmischen Strahlen und dadurch die Wolkenbildung. Mehr Sonnenaktivität → weniger Wolken → es wird wärmer. en The sun is influencing the cosmic rays and therefore the clouds cover. More solar activity → less clouds → warmer Earth. fr Le Soleil influence les rayons cosmiques est par cela les nuages sur la terre. Augmentation de l'activité solaire → moins de nuages → réchauffement de la terre. |
|
|
|
de Mehr Sonnenaktivität → weniger Wolken → es wird wärmer. Bei grosser Sonnenaktivität erreicht weniger Kosmische Strahlung die Erde. Mit weniger Kosmischer Strahlung werden weniger Wolken auf der Erde gebildet. Weniger Wolken lassen mehr Sonnenstrahlung auf die Erde, womit sich die Erde erwärmt. en More solar activity → less clouds → warmer Earth. A stronger wind from greater solar activity will reduce the flux of cosmic ray reaching Earth. Less cosmic rays means less cloud cover on the earth. Less cloud cover influences the terrestrial climate by higher solar radiation. fr Augmentation de l'activité solaire → moins de nuages → réchauffement de la terre. Une augmentation de l'activité solaire a comme effet une réduction du flux de rayons cosmiques atteignant la terre. Moins de rayons cosmiques produisent moins de nuages sur la terre. Moins de nuages laissent plus de rayons solaires réchauffer la terre. |
|
|
de Auswirkungen der CO2-Konzentration auf das Pflanzenwachstum en Impact of the CO2-Concentration on the plant growth fr Impacte de la concentration du CO2 sur la croissance des plantes
z. B. Bäume und Nutzpflanzen wie: Weizen, Roggen, Reis z. B. Gräser und Nutzpflanzen wie: Mais, Zuckerrohr, Hirse
de Falls der Verbrauch fossiler Treibstoffe nicht närrischerweise limitiert wird im Zuge eines abwegigen Versuches, den Klimawandel zu verhindern - zuvor globale Erwärmung genannt - wird die erwartete Zunahme der CO2-Emissionen in der Atmosphäre die Ernteerträge sowie die Wasser-Effizienz aller in der Welt erzeugten Nahrungsmittel deutlich verbessern. Dies erlaubt es uns die wachsende Weltbevölkerung weiter zu ernähren auch noch weit über das Jahr 2050 hinaus. Dann werden Berechnungen zufolge etwa 9 Milliarden Menschen auf der Erde leben, verglichen mit den heutigen 7,2 Milliarden. en I have found if fossil fuel usage is not foolishly restricted in a misguided attempt to prevent climate change - previously referred to as global warming - the expected increase in anthropogenic CO2 emissions will significantly enhance the yields and water-use efficiencies of essentially all of the world's food crops, allowing us to continue to feed the world's growing population up to and far beyond the year 2050, when it is expected to peak out at approximately nine billion people, compared to today's 7.2 billion. |
|
How not to make a climate photo op |
de Kommentar Pure Panikmache: MIT prognostiziert 7°C Temperaturanstieg bis 2100 "Wenn die Prognose dieser "Wissenschaftler" eines Temperaturanstiegs um 7°C bis 2100 auch mit dieser Methode entstanden ist, wundert mich nichts mehr. Immerhin gestehen diese Alarmisten mit der Einführung des Zufallselements (unbewußt?) zu, daß sie eben keine gesicherte Prognose aufstellen, sondern nur mit unvollständigen Computermodellen herumgespielt haben. Sie haben in Wirklichkeit keine Ahnung, wie sich das Klima künftig entwickeln wird." en Comments received MIT: Global Warming of 7°C 'Could Kill Billions This Century' Global temperatures could rise by more than 7C this century killing billions of people and leaving the world on the brink of total collapse, according to new research". The simple fact is that the source of these dire warnings come from computer "models" written by humans with a vested interest in a warming outcome. |
-
Klagemauer.TV
2016-11-20 de
"Klimawissenschaftler: Klimawandel nicht durch
CO2 verursacht"
Zu Werner Kirstein: "Erdklima vs. Mainstrem-Medien" 2016-06-15
Quelle/Source:
-
Klagemauer TV
2016-11-18 de Klimawissenschaftler: Klimawandel nicht durch CO2 verursacht (Vortrag von Prof. Dr. Werner Kirstein)Vom 7. November bis zum 18. November 2016 findet die 22. UN-Klimakonferenz in Marrakesch, in Marokko, mit 195 Mitgliedsstaaten, statt.
Schwerpunktmäßig wird wieder diskutiert, wie man die beschlossene Begrenzung der Erderwärmung auf zwei Grad innerhalb dieses Jahrhunderts umsetzen kann.
Dazu legte Petteri Taalas, Generalsekretär der Weltorganisation für Meteorologie WMO, einer Sonderorganisation der Vereinten Nationen, die aktuellen Daten vor.
Er zeigte auf, dass im Schnitt die Temperaturen im Jahr 2016 1,2 Grad über dem Niveau vor dem Industriezeitalter liegen.
Das sei laut Herrn Taalas auch der Grund für mehr Wetterkatastrophen und - als unmittelbare Folge davon - für wirtschaftliche Einbußen größeren Ausmaßes.
Ursache seien die klimaschädlichen Treibhausgase.
1988 wurde der Weltklimarat IPCC von der UN ins Leben gerufen,
mit dem klaren Auftrag zu beweisen, dass ein Klimawandel vorliege,
und dieser menschengemacht sei.
Mit speziell geschriebenen Computerprogrammen sollte nachgewiesen werden, dass die Welt durch eine steigende Erderwärmung in einer Klimakatastrophe enden würde.
Hauptverursacher sei das angeblich umweltschädliche CO2, wie von Politikern und Hauptmedien seit Jahrzehnten gebetsmühlenartig vermittelt wird.
Eine Vielzahl namhafter Wissenschaftler weist Manipulationen in den Messungen und Auswertungen nach, und sieht für den Klimawandel aber ganz andere Ursachen und Zusammenhänge.
Prof. Dr. Werner Kirstein, ein erfahrener Klimatologe, ist eine dieser Gegenstimmen.
In seinem Vortrag "Erdklima versus Mainstream-Medien", den wir gleich im Anschluss zeigen, erklärt er fundiert und sehr anschaulich die Zusammenhänge von Erdklima, Klimaerwärmung und CO2 aus einer ganz anderen Sichtweise.
Die propagandamäßige Arbeitsweise der offensichtlich gleichgeschalteten Medien wird in diesem Vortrag ebenfalls beleuchtet.
Schauen Sie nun den Vortrag und bilden Sie sich Ihre eigene Meinung.
-
Prof. Dr. Werner Kirstein
2018-08-06 de
Klimatologe sagt Claus Kleber die Meinung
Der Klimatologe und Physiker Prof. Dr. Werner Kirstein richtete am 04.08.2018 eine Mail an Claus Kleber vom 'heute-journal' im Zweiten, bzgl. des Beitrages
"Trockener Sommer: Woher kommt die Hitze?"
in der heute-journal-Sendung vom 03.08.2018.
Hier nach besagtem Beitrag aus der Sendung, verlesen.
Sehr aufschlussreich.
Quelle/Source:
-
EIKE Europäisches Institut für Klima und Energie
2018-08-07 de Dr. Claus Kleber (ZDF heute Journal 3.8.18): ".. sich die Atmophäre 'grundstürzend' ändert!"Am 3.8.18 brachte das ZDF im heute Journal angekündigt von seinem Moderator, dem bekannten Klimakatastrophenprediger und Sachbuchautor in nämlicher Sache, Dr. Claus Kleber einen Beitrag zur Hitzeperiode dieses Sommers.
Der Physiker und Klimatologe Prof. Dr. Werner Kirstein fühlte sich bemüßigt, diese permanent wiederholte Klimaktastrophenmeldung, diesmal
sogar als mögliche "grundstürzenden" Änderung der Atmosphäre angekündigt
zu widerlegen mehr Objektivität und Sachlichkeit anzumahnen. Wohl wissend, dass diese beiden Begriffe für das ZDF und Claus Kleber lästige Fremdworte sind.
Schauen und lesen Sie selbst
| ZDF |
Zweites Deutsches Fernsehen
▶ZDF: Who is who (Medien der Globalen Erwärmung) |
⇧ 2012
↑ Fritz Vahrenholt in SWR1-Leute
⇧ 2003
↑ Himmlischer Treibhauseffekt, Kosmische Strahlung bestimmt unser Klima
-
Ruhr-Universität Bochum
2003-07-01 de Himmlischer Treibhauseffekt, Kosmische Strahlung bestimmt unser Klima - GSA Today: Wasserkreislauf ist Klimatreiber Nr. 1Als die treibende Kraft des Klimas auf der Erde haben der Bochumer Geologe Prof. Dr. Jan Veizer und der Israelische Astrophysiker Prof. Dr. Nir J. Shaviv (Hebrew University, Jerusalem) einen neuen Verdächtigen ausgemacht:
Kosmische Strahlung (cosmic ray flux, CRF) könnte der Hauptmotor der Erwärmung und Abkühlung sein.
Bei ihrem Auftreffen auf die Erdatmosphäre beeinflusst sie die Wolkenbildung und so den Wasserkreislauf der Erde.
Die Forscher verglichen die Klimadaten der letzten 600 Millionen Jahre mit der Intensität der kosmischen Strahlung in dieser Zeit und fanden eine übereinstimmende Periodizität.
Zwei Drittel der Temperaturschwankungen auf der Erde sind durch die kosmische Strahlung erklärbar.
Hierarchie der Zyklen berücksichtigen
Das Klima auf der Erde wird durch viele verschiedene Faktoren beeinflusst, die in verschiedenen großen und kleinen, sichtbaren und unsichtbaren Kreisläufen voneinander abhängen.
Bisherige Klimamodelle betrachteten oft kleine Zyklen, ohne größere zu berücksichtigen:
'Wir dürfen keinen statischen Hintergrund für irdische Zyklen annehmen',
so Prof. Veizer, 'wir müssen 4,5 Mrd. Jahre zurückblicken bis an den Anfang unseres Sonnensystems.'
So untersuchten die Forscher das Erdklima und die Zusammensetzung der Atmosphäre anhand von Sedimenten wie Kohlen und Salzen, Fossilien und sog. Drop Stones: Steine, die in Kälteperioden in Eisbergen eingeschlossen Richtung Äquator wanderten und beim Schmelzen des Eises zu Boden sanken.
Je näher am Äquator sie zu finden sind, desto kälter muss das Klima gewesen sein.
Wolken haben Einfluss
Das Ergebnis: Das Klima auf der Erde hat sich im Rhythmus von ca. 140 Mio. Jahren zyklisch erwärmt und abgekühlt.
Was war der Motor dafür?
Irgendein Klimatreiber muss auf die Erde gewirkt haben, denn da die Sonne am Anfang ihres Lebens noch um ca. 30 Prozent kälter war als heute, hätte sonst die Erde bis vor ca. 1 Mrd. Jahren tiefgefroren sein müssen.
Spuren von Leben und Wasser existieren aber für die letzten rund 4 Mrd. Jahre.
Wäre CO2 der Antreiber, hätte der Gehalt in der Atmosphäre ca. 1.000 - 10.000-mal so hoch gewesen sein müssen wie heute.
Solche Mengen sind aber nicht an den Sedimenten abzulesen.
Die Treibhausgase CO2 und Methan können also nicht für die Temperatursteigerung verantwortlich gemacht werden.
Übrig bleibt das - damals wie heute - wichtigste Treibhausgas Wasserdampf.
Möglicherweise gab es weniger Wolken, die Sonnenwärme konnte ungehindert bis zur Erdoberfläche gelangen.
'Einige Modelle zeigen, dass Wolken bis zu 50 Prozent der Sonnenschwankungen auffangen können', so Prof. Veizer.
Es schließt sich die nächste Frage an: Was treibt den Wasserzyklus an?
Verbindungsstück zwischen Kosmos und Klima
Der Kontakt mit dem Astrophysiker Prof. Nir J. Shaviv brachte Veizer auf eine neue Spur:
Shaviv hatte den Einfall kosmischer Strahlung auf die Erde für die letzten 600 Mio. Jahre untersucht und eine Zyklizität festgestellt, die mit der des Erdklimas übereinstimmte.
Die Forscher machten sich auf die Suche nach der Verbindung zwischen kosmischen Strahlen und dem Wasserkreislauf.
Bei ihrer Recherche stießen sie auf Experimente in Gaskammern, die zeigten, dass Strahlungspartikel beim Auftreffen auf das Gas auf bisher nicht ganz geklärte Weise sog. Keime erzeugen, die zur Kondensation und somit zur Wolkenbildung im Gas führen.
Diese Kausalität steht in Einklang mit den Ergebnissen von Satellitenbeobachtungen der letzten Jahre.
Wolken schirmen die Erde vor der Sonnenwärme ab, indem sie die thermische Energie ins All zurückstrahlen (Albedo).
Umgekehrt bilden sich bei geringer kosmischer Strahlung weniger Wolken, die Sonne kann die Erde erwärmen.
Die Sonnenzyklen und ihre Folgen
Die Sonne selbst durchlebt verschiedene Zyklen, z. B. entwickeln sich periodisch mehr oder weniger Sonnenflecken, die mit erhöhter Aktivität der Sonne einhergehen.
Diese Unterschiede allein sind aber zu schwach, um die irdischen Klimaschwankungen zu erklären.
Sie werden jedoch dadurch verstärkt, dass bei größerer Sonnenaktivität auch das Magnetfeld der Sonne wächst und kosmische Strahlung von der Erde weglenkt.
Es treffen also weniger kosmische Partikel auf die Atmosphäre, es entwickeln sich weniger Wolken und es wird wärmer.
Die Milchstraße bestimmt mit
Der Einfall kosmischer Strahlung auf der Erde hängt außerdem davon ab, wo in der Galaxie sich unser Sonnensystem gerade befindet.
Die Strahlung ist dort am stärksten, wo sich neue Sterne bilden, was in den spiralförmigen Armen der Milchstraße der Fall ist.
Wenn wir etwa alle 150 Mio. Jahre einen solchen Arm passieren, steigt die Strahlungsintensität an und es kommt zu einer Kälteperiode.
Die Klimavariationen durch diese Passagen sind ca. zehnmal so stark wie die durch die Sonne verursachten.
Wasserdampf ist Klimatreiber
Diese neuen Funde belegen die große Bedeutung des Wasserkreislaufs als Klimafaktor und stellen die weitverbreitete Annahme infrage, dass CO2 die treibende Kraft der Erderwärmung sei.
'Der Fall liegt umgekehrt', so Veizer, 'CO2 reitet quasi Huckepack auf dem Wasserkreislauf, denn bei der Photosynthese müssen Pflanzen fast 1.000 Wassermoleküle ausatmen, um ein einziges CO2-Molekül aufzunehmen.'
Wenn es wärmer wird, beschleunigt sich der irdische Wasserkreislauf, die Bioproduktivität erhöht sich, Bodenorganismen atmen vermehrt CO2 aus.
Eisbohrungen zeigten, dass in Phasen der Erwärmung der CO2-Gehalt der Luft erst rund 800 Jahre nach dem Temperaturanstieg wuchs.
CO2 könnte jedoch ein Treibhaus-verstärkender Faktor sein.
⇧
10 Probleme des IPCC
en
IPCC Problems
fr
Problèmes du GIEC
| de | en | fr |
|---|---|---|
|
IPCC Intergovernmental Panel on Climate Change Probleme des IPCC |
IPCC Intergovernmental Panel on Climate Change IPCC Problems |
GIEC Groupe d'experts intergouvernemental sur l'évolution du climat Problèmes du GIEC |
↑
11 Beweisstücke, dass die Klimamodelle fundamental fehlerhaft sind
en Fatal pieces of evidence
|
↑
Allgemein
en General
fr Générale
-
EIKE Europäisches Institut für Klima und Energie
2011-10-21 de Untersuchung der Mechanismen zur Festsetzung der Kohlenstoffsteuer
-
JoNova
2011-09-20 en Dr David Evans: Four fatal pieces of evidence
-
Examiner / Dianna Cotter
2009-08-18 en Carbon Dioxide irrelevant in climate debate says MIT Scientist
-
SPPI Monthly CO2 Report
2009-07 en
The End of the Climate Scare
Professor Lindzen proves the effect of CO2 on temperature is small
Outgoing long-wave radiation is not being trapped as predicted
-
2010-12-31 en
 The Global Warming Hoax Explained for Dummies
This movie addresses the various errors in the Anthropogenic Global Warming Hoax and explains the actual scientific causes of natural global warming and cooling
-
2011-06-25 en
A Peer-Reviewed Deception
Deconstructing Anthropogenic Global Warming alarmism and the myth of 'peer-review'.
| de | en | fr |
|---|---|---|
| Physikalische Aspekte | Physical aspects | Aspects physiques |
| Kritik am Treibhauseffekt und an der Gegenstrahlung | Criticism of the Greenhouse Effect and of the back-radiation | Critiques de l'effet de serre et du forçage radiatif (back-warming) |
↑
Der fehlende Hotspot (warme Zone)
en The missing Hotspot
fr Le 'hotspot' (point chaud) manque
Der 'Hotspot' ist entscheidend für die Klimadebatte.
en The 'Hotspot' is crucial to the climate debate.
fr Le 'Hotspot' est crucial pour le débat sur le climat.
|
IPCC (theoretical) SOURCE: IPCC Assessment Report 4, 2007, Chapter 9, Figure 9.1, page 675  de Die zu erwartende Temperaturverteilung in der Atmosphäre (über Ecuador) nach den Klimamodellen des IPCC. en IPCC: If greenhouses gases are warming the planet that warming will happen first in the cold blob of air 8-12 km above the tropics. fr Les modèles informatiques existants prédisent que la tendance au réchauffement aux tropiques due aux concentrations croissantes de CO2 doit être plus forte dans la troposphère qu'au niveau du sol. Le graphique du rapport AR4 du GIEC montre une zone rouge bien visible, le "hot spot" prévu dans la troposphère tropicale entre 8 et 12 km d'altitude. |
Radiosonde measurements SOURCE: Part E of Figure 5.7 in section 5.5 on page 116 of the US CCSP 2006 report 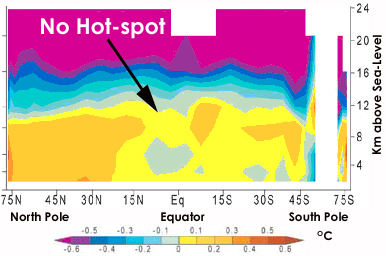 de Real gemessenen Temperaturen im Zeitraum von 1979 - 1999 über den Tropen (Ecuador). Von einem Hot-Spot ist nichts zu sehen und auch die Temperaturverteilung hat mit dem Rechenmodell nichts gemeinsam. en The big problem for the believers of AGW is that years of radiosonde measurements can't find any warming, as shown in the indicated source. fr Cependant les observations des relevés des températures réelles des radiosondes du Hadley Centre rapportées ci-contre ne montrent pas le "hot spot" attendu prédit par le réchauffement induit du CO2. Le "hot spot" prévu est entièrement absent de l'observation des relevés. |
de Der 'Hotspot' ist entscheidend für die Klimadebatte.
Die erste Abbildung zeigt, den nach den Klimamodellen der IPCC entstehende Hot-Spot über den Tropen.
-
Hot-Spot, der sich nach den Klimamodellen der IPCC als Fingerabdruck über den Tropen in der oberen Troposphäre ausbilden sollte.
-
Die Grundaussage aller CO2-basierten Klimamodelle postuliert eine Erhöhung der bodennahen Temperatur, durch vermehrte Rückstrahlung, der sog. Gegenstrahlung aus der Atmosphäre, hervorgerufen durch das Ausbringen von zusätzlichen sog. Treibhausgasen, wie CO2, in die Atmosphäre.
-
Hierzu muss sich jedoch die Atmosphäre zuerst erwärmen.
-
Im Detail fordern die Modelle einen sog. Hot-Spot, der sich als Fingerabdruck über den Tropen in der oberen Troposphäre ausbildet.
Die zweite Abbildung zeigt die tatsächliche Temperaturentwicklung über den Tropen.
-
Wird diese Vorhersage mit den tatsächlich gemessenen Temperaturen (Datenquelle: US Climate Change Science Programme) verglichen, ergibt sich, dass keine Korrelation vorhanden ist, d.h. die Realität ergibt ein anderes Bild.
-
In der Naturwissenschaft heißt dies, wenn ein Modell nicht mit der Realität übereinstimmt, dass das Modell falsch ist!
-
EIKE Europäisches Institut für Klima und Energie
2009-07-01 de Klimavorhersage und ihre Realität
en The 'Hotspot' is crucial to the climate debate.
-
If greenhouses gases are warming the planet that warming will happen first in the cold blob of air 8-12 km above the tropics.
It's freezing cold up there, but it ought to be slightly less freezing cold thanks to greenhouse gases.
All 20-odd climate models predict warming there first-it's the fingerprint of greenhouse gas warming, as opposed to warming by some other cause, like solar magnetic effects, volcanic eruptions, solar irradiance, or ozone depletion etc etc.
The big problem for the believers of AGW is that years of radiosonde measurements can't find any warming, as shown in part E of Figure 5.7 in section 5.5 on page 116 of the US CCSP 2006 report.
-
Joanne Nova
en The Missing Hotspot
-
Climate Skeptic
en Can you have a consensus if no one agrees what the consensus is?
2016-08 On the Existence of a "Tropical Hot Spot"
-
Dr. James P. Wallace III, Dr. John R. Christy, Dr. Joseph S. D'Aleo
2016-08 en
On the Existence of a "Tropical Hot Spot "
The Validity of EPA's CO2 Endangerment Finding, Abridged Research Report
Quelle / Source:
-
Die kalte Sonne (Fritz Vahrenholt & Sebastian Lüning)
2016-12-16 de Der Einfluss ozeanischer Zyklen auf die Temperaturtrends der SchweizLange Zeit wurde der sogenannte tropische Hotspot als Beleg für eine massive Selbstverstärkung der CO2-Erwärmungswirkung herangezogen.
Allerding stellte sich später dann heraus, dass es diese Wärmeanomalie über dem Äquator gar nicht gibt.
Dr. James P. Wallace III, Dr. John R. Christy und Dr. Joseph S. D'Aleo gehen dem ominösen Hotspot in einer Studie aus dem August 2016 nach und kamen erneut zum gleichen Ergebnis:
Es gibt keinen tropischen Hotspot.
2009-10-11 Hotspots and Fingerprints
-
Roy Spencer
2009-10-11 en Hotspots and FingerprintsIt is claimed by the IPCC that there are 'fingerprints' associated with global warming which can be tied to humanity's greenhouse gas emissions, as if the signatures were somehow unique like real fingerprints.
But I have never been convinced that there is ANY fingerprint of anthropogenic warming.
And the reason is that any sufficiently strong radiative warming influence - for instance, a small (even unmeasurable) decrease in cloud cover letting in slightly more sunlight starting back in the late 1970's or 1980's- would have had the same effect.
-
Watts Up With That? (Antony Watts)
2009-10-11 en Spotting the AGW fingerprintThe intent of the following figure from Chapter 9 in the latest (AR4) version IPCC report is to convince the reader that greenhouse gas emissions have been tested against all other sources of warming, and that GHGs are the only agent that can cause substantial warming.
(The snarky reference to "proof" has been added)Proof* that Global Warming is Our Fault
(*assuming no natural climate cycles exist)What you find in the AR4 report is artfully constructed prose about how patterns of warming are "consistent with" that expected from manmade greenhouse gases.
But "consistent with" is not "proof of".
Sources:
-
IPCC Assessment Report 4, 2007
en
Chapter 9: Understanding and Attributing Climate Change
Figure 9.1, page 675
-
US CCSP 2006 report
en
Temperature Trends in the Lower Atmosphere
Vertical Profiles of Atmospheric Temperature Change
Part E of Figure 5.7 in section 5.5 on page 116
-
Dr David Evans
2008-07-21 en
The Missing Hotspot
Carbon Dioxide Not Responsible for 20th Century Warming
| David Evans |
Dr., Klimawissenschaftler, war von 1999 bis 2005 verantwortlich
für die Erfassung der Australischen CO₂-Emissionen.
▶David Evans: Who is who (Skeptiker) ▶David Evans: Video (Präsentationen) |
fr Le 'Hotspot' est crucial pour le débat sur le climat.
L'empreinte unique de l'effet de serre "hot-spot" (un point chaud)
-
Tous les modèles d'ordinateurs, de plus en plus sophistiqués, qui fournissent les résultats que l'on connaît au GIEC, sont d'accord sur un point clef :
L'effet de serre doit se manifester de manière particulièrement évidente au dessus des tropiques, par un réchauffement très net de la couche atmosphérique située aux environs de 10km d'altitude, c'est à dire à la limite supérieure de la troposphère.
Ce réchauffement doit, toujours d'après les modèles, se produire avec une vitesse entre 2 et 3 fois plus grande que sur la surface de la terre. Cela ne signifie évidemment pas que la température de l'atmosphère à 10km d'altitude est plus chaude que celle de la terre mais simplement que sa vitesse de réchauffement doit être nettement plus rapide que celle de la terre.
Le "hot spot" prévu est entièrement absent de l'observation des relevés.
-
Cependant les observations des relevés des températures réelles des radiosondes du Hadley Centre rapportées ne montrent pas le "hot spot" attendu prédit par le réchauffement induit du CO2.
-
Pensée unique
fr L'effet de serre remis en question par plusieurs physiciens
7) Dispose-t-on d'une preuve absolue de l'existence de l'effet de serre avec les mesures les plus modernes ?
-
Skyfall / Changement Climatique
2008-09-10 fr L'effet de serre saturé
↑ ERBE Earth Radiation Budget Experiment
de Allgemein en General fr Générale
|
|
de Ausstrahlung der Erde (vertikale Achse) im Verhältnis zur Wassertemperatur (horizontale Achse), wie sie vom ERBE-Satelliten (oben links) gemessen worden sind und wie sie von 11 Klimamodellen "vorhergesagt" worden waren. en Climate feedbacks are estimated from fluctuations in the outgoing radiation budget from the latest version of Earth Radiation Budget Experiment (ERBE) nonscanner data. This is the opposite of the behavior of 11 atmospheric models forced by the same SSTs. |

de Verzeichnis en Contents fr Sommaire
- 2011
- de Untersuchung der Mechanismen zur Festsetzung der Kohlenstoffsteuer
- 2009
- de
Al Gore and David Suzuki lie about CO2.
It is 600% less effect then claimed.
- en On the determination of climate feedbacks from ERBE data
- en Carbon Dioxide irrelevant in climate debate says MIT Scientist
de Text en Text fr Texte
⇧ 2011
↑ Untersuchung der Mechanismen zur Festsetzung der Kohlenstoffsteuer
-
EIKE Europäisches Institut für Klima und Energie
2011-10-21 de Untersuchung der Mechanismen zur Festsetzung der KohlenstoffsteuerSatelliten haben die Ausstrahlung der Erde gemessen und herausgefunden, dass die Erde mehr Wärme abstrahlt, wenn die Atmosphäre wärmer ist und weniger Wärme in den Monaten, in denen die Erde kühler ist.
Wer hätte das gedacht?
Aber die Klimamodelle sagen genau das Gegenteil, dass nämlich die Erde weniger Wärme abstrahlt, wenn die Atmosphäre wärmer ist, weil die Wärme zu stark zurückgehalten wird (positives Feedback).
Und wieder stehen die Klimamodelle drastisch im Gegensatz zur Realität.
⇧ 2009
↑ Al Gore and David Suzuki lie about CO2. It is 600% less effect then claimed.
In this video Lord Monckton explains new science that shows IPCC claims, and Al gore and David Suzuki claims about CO2 and global warming is all wrong and over exaggerated by a factor of 6 times
↑ en On the determination of climate feedbacks from ERBE data
-
Richard S. Lindzen and Yong-Sang Choi
2009-08-26 en
On the determination of climate feedbacks from ERBE data
Climate feedbacks are estimated from fluctuations in the outgoing radiation budget from the latest version of Earth Radiation Budget Experiment (ERBE) nonscanner data.
It appears, for the entire tropics, the observed outgoing radiation fluxes increase with the increase in sea surface temperatures (SSTs).
The observed behavior of radiation fluxes implies negative feedback processes associated with relatively low climate sensitivity.
This is the opposite of the behavior of 11 atmospheric models forced by the same SSTs.
Therefore, the models display much higher climate sensitivity than is inferred from ERBE, though it is difficult to pin down such high sensitivities with any precision.
Results also show, the feedback in ERBE is mostly from shortwave radiation while the feedback in the models is mostly from longwave radiation.
Although such a test does not distinguish the mechanisms, this is important since the inconsistency of climate feedbacks constitutes a very fundamental problem in climate prediction.
↑ en Carbon Dioxide irrelevant in climate debate says MIT Scientist
-
Examiner / Dianna Cotter
2009-08-18 en Carbon Dioxide irrelevant in climate debate says MIT ScientistThe ERBE results, which are factual data from real measurements made by satellite, show the exact opposite result from the UN/IPCC Projections (computer models which are not real data) .
⇧
12 CO₂-Experimente
en CO₂ Experiments
fr CO₂ expérimentations
Mit folgenden Links wird von anderen Webseiten auf diese Seite verwiesen:
▶Kohlenstoffdioxid (CO₂): CO₂-Experimente
▶Der CO₂-Treibhauseffekt: CO₂-Experimente
| de | en | fr |
|---|---|---|
|
Kohlenstoffdioxid (CO₂) CO₂-Experimente |
Carbon dioxide (CO₂) CO₂ Experiments |
Dioxyde de carbone (CO₂) CO₂ expérimentations |
|
Der CO₂-Treibhauseffekt CO₂-Experimente |
The CO₂ Greenhouse Effect CO₂ Experiments |
L'éffet de serre du CO₂ CO₂ expérimentations |
de Verzeichnis en Contents fr Sommaire
- 2020
- de Die falschen Propheten - wie manche "Wissenschaftserklärer" ihr Publikum einfach belügen
- de
Experimentelle Überprüfung des CO₂-Treibhauseffektes:
Die falschen Klima-Propheten
Das Ditfurth-Experiment zeigt nicht den Treibhauseffekt, sondern ist ein Phänomen schwerer Gase.
en Experimental review of the CO₂ greenhouse effect - The false climate prophets
The Ditfurth experiment does not show the greenhouse effect, but is a phenomenon of heavy gases - de CO₂ das entscheidende Experiment
- 2019
- de
Michael Schnell -
Welchen Einfluß haben Treibhausgase auf die Lufttemperatur?
- 2014
- en
Der Treibhauseffekt: Sendung Hoimar von Ditfurths aus dem Jahre 1978
- 2012
- en
'Greenhouse Effect In A Bottle' Experiment - Reconsidered
de Bemerkung
Beachten Sie bitte, dass die Temperatur im Behälter mit dem CO2 nur steigt, wenn dieser luftdicht verschlossen ist.
CO2 hat einen grösseren Wärmeausdehnungskoeffizienten als Luft.
Nach der Gasgleichung erwärmt sich das CO₂ durch (und wegen) der Kompression stärker als die Luft.
Bei gleichem Druck (Behälter nicht verschlossen) erwärmen sich Luft und CO2 gleich stark.
en Note
Please note the difference of the resulting temperatures if the containers are closed gas-tight or left open, as shown in following experiment.en
'Greenhouse Effect In A Bottle' Experiment - Reconsidered
(Seite gelöscht, kein Wayback)
When carbon dioxide is allowed to expand when heated it does not become any warmer than does regular air, therefore this experiment contains no evidence that carbon dioxide causes an enhanced "greenhouse effect". - 2011
- en Repeatability of Prof. Robert W. Wood's experiment
- en Replicating Al Gore's Climate 101 video experiment shows that his "high school physics" could never work as advertised
- en Al Gore's Climate 101 video experiment
- 2010
- en Some Coolness Concerning Global Warming: Richard D. Lindzen and Roy W. Spencer, Ph. D.
- 2009
- en Other 'Global Warming' experiments
de Text en Text fr Texte
⇧ 2020
↑ Die falschen Propheten - wie manche "Wissenschaftserklärer" ihr Publikum einfach belügen
-
EIKE Europäisches Institut für Klima und Energie
Michael Limburg
2020-07-10 de Die falschen Propheten - wie manche "Wissenschaftserklärer" ihr Publikum einfach belügenEine unvollständige Übersicht
Immer wieder geistern anschauliche vermeintliche Experimente durch die Medien bei denen klar bewiesen wird, dass CO₂ die Atmophäre durch seine bloße Anwesenheit erwärmt.
Das Problem ist, keines dieser Experimente zeigt, was die Experimentatoren vorgeben zu zeigen.
Es sind alles bewusste also gezielte (manchmal auch unbewusste) Fakes.
↑
Experimentelle Überprüfung des CO₂-Treibhauseffektes:
Die falschen Klima-Propheten
en
Experimental review of the CO₂ greenhouse effect -
The false climate prophets
-
EIKE Europäisches Institut für Klima und Energie
Dr. Michael Schnell
2020-06-28 de Experimentelle Überprüfung des CO₂-Treibhauseffektes: Die falschen Klima-ProphetenKurzfassung
Jean-Baptiste Joseph Fourier war der Erste, der 1827 eine Erwärmung der Atmosphäre durch CO₂ postulierte.
Viele Jahre später glaubten Hoimar von Ditfurth, Albert Arnold "Al" Gore und Volker Quaschning, dass sie die Fourier-These experimentell nachgewiesen haben, da sie eine beträchtliche Lufterwärmung bei verschiedenen CO₂-Experimenten beobachteten.
Eine sorgfältige Überprüfung ihrer Experimente zeigt nun, dass hier die Öffentlichkeit manipuliert und getäuscht wird.
Die Temperaturerhöhungen werden nicht durch den CO₂-Treibhauseffekt, sondern durch die Abnahme der Wärmeleitung verursacht.
Besonders starke Effekte erhält man, wenn CO₂ als "Gas-See" unter einer Luftschicht eingeleitet wird.
Werden aber, wie in der Atmosphäre, Luft und CO₂ gleichmäßig vermischt, bleibt die Erwärmung aus und unter besonderen Umständen kann sogar eine leichte Abkühlung auftreten.
Einleitung
Folgt man den etablierten Massenmedien ist der angeblich vom Menschen verursachte Klimawandel wissenschaftlich eindeutig bewiesen und benötigt keine weitere Forschung.
Zunächst ein Widerspruch in sich, denn die Naturwissenschaft liefert keine absolute Wahrheiten, in Stein gemeißelte Gesetze, sondern nur Annahmen und Hypothesen.
Selbst wenn sich eine These in der Praxis bewährt und allgemeine Anerkennung gefunden hat, ist eine kritische Überprüfung kein Sakrileg sondern unverzichtbare Pflicht eines jeden Wissenschaftlers.
Denkverbote und Maulkörbe sind Methoden und typische Merkmale einer Diktatur, die die Wissenschaft zu einem unwürdigen Knecht der Mächtigen degradiert.
Wie glaubwürdig ist eine Gesellschaft, die bunt sein möchte aber Meinungsvielfalt unterdrückt (hier).
Es ist sehr beunruhigend, dass sich beim Thema Klimawandel hauptsächlich nur ehemalige Institutsdirektoren, pensionierte Professoren und Forscher zu Wort melden und den Weltuntergangsszenarien widersprechen.
Wenn nur Menschen Widerstand leisten, die sich keine Sorgen bezüglich ihrer Karriere, Reputation oder ihres Einkommens machen müssen.
Wenn in Deutschland die ältere Generation von einem öffentlich rechtlichen Sender ("Meine Oma ist 'ne alte Umweltsau") verspottet wird.
Für einen Außenstehenden ist es schwer bis unmöglich die Vorhersagen von Dürre, Hitze, Überschwemmungen und Artensterben zu überprüfen.
Es sein denn, man stöbert in uralten Zeitungen und findet düstere Prophezeiungen in schöner Regelmäßigkeit wie z.B. die "ungewöhnliche" Arktis-Erwärmung im Jahre 1924 und 1934 (hier, hier).
Vielleicht sind es die Lebenserfahrungen der Älteren, dass sie dem Sensations-Journalismus nicht auf dem Leim gehen und eher gelassen reagieren.
Die Untergangsprognosen spaltet die Gesellschaft in Menschen, die alles glauben was die Medien produzieren und Menschen, die sich lieber selber eine eigene Meinung bilden.
Meine experimentellen Untersuchungen richten sich an die letztere Gruppe.
Auch wenn sich das komplexe Geschehen von Wetter und Klima im Labor nicht nachbilden lässt, einzelne Aspekte und Aussagen lassen sich durchaus überprüfen.
Im folgenden Artikel geht es um spektakuläre Labor-Experimente prominenter Klima-Alarmisten, die kritisch hinterfragt werden sollen.
Am Ende wird sich herausstellen warum ihre Experimente scheitern mussten und ihre Warnungen vor dem angeblich gefährlichen CO₂ unbegründet sind.
1. Das Hoimar von Ditfurth Experiment
Man findet im Internet eine Reihe von einfachen Versuchen, die den CO₂-Treibhauseffekt mit der Lufttemperatur verknüpfen.
Danach soll sich CO₂ wie eine Glasscheibe verhalten, die kurzwelliges Licht durchlässt, aber langwellige Wärmestrahlung absorbiert.
Eine deutliche Erwärmung nach Zugabe von CO₂ wurde als Beweis eines Treibhauseffektes erachtet.
2.1 Überprüfung des Ditfurth-Experimentes
Wie beim Ditfurth-Experiment wird die mit Luft gefüllte, offene Apparatur (Abb. 2, linkes Bild) mit einer 100 W Rotlicht-Reflektor-Lampe bestrahlt.
Durch die Bestrahlung ist die Versuchs-Apparatur bis zu 10 °C wärmer als die Raum-Luft.
2.2 Das Argon-Kontroll-Experiment
Auf den ersten Blick sieht das vorherige CO₂-Experiment wie eine Bestätigung der Ditfurth-Hypothese aus.
Aber Zweifel ist die Mutter aller Wissenschaften und so muss auch dieses Ergebnis überprüft werden.
Als alternatives Kontroll-Gas bietet sich Argon an.
Argon ist wie CO₂ ein schweres Gas aber kein Treibhausgas und sollte beim Einleiten in die Röhre keine Temperatur-Änderung verursachen.
Der Kontroll-Versuch ist jedoch eine faustdicke Überraschung:
Das IR-inaktive Argon verursacht exakt die gleichen Temperatur-Anstiege wie das Treibhausgas CO₂ (Abb. 4).
2.3 Schlussfolgerungen
Das Edelgas Argon ist ein IR-inaktives Gas, das weder Wärmestrahlung absorbieren noch emittieren kann.
Wenn CO₂ und Argon den gleichen Erwärmungs-Effekt zeigen, muss man die Ursache außerhalb der Wärmestrahlung suchen.
Schwere Gase haben eine kleinere spezifische Wärmeleitfähigkeit λ als Luft (die Tabelle in Abb. 4).
Werden diese Gase in die Röhre eingeleitet, verringern sie den Wärmestrom innerhalb der Apparatur.
Die schweren Gase wirken wie eine Isolierschicht.
Somit lässt sich feststellen:
Das Ditfurth-Experiment zeigt nicht den Treibhauseffekt, sondern ist ein Phänomen schwerer Gase.
4. Fazit und Ursachensuche
Die Behauptungen von Al Gore, Ditfurth und Quaschning, den CO₂-Treibhauseffekt durch eine Luft-Erwärmung nachgewiesen zu haben, sind falsch.
Beseitigt man Sondereffekte, die durch die geringe spezifische Wärmeleitung schwerer Gase und durch einen Konzentrationsgradienten entstehen, bleibt von der postulierten Erwärmung nichts mehr übrig.
Schlussbemerkung
Mit beiden Untersuchungsmethoden wurde nachgewiesen, dass zumindest der erdnahe CO₂-Treibhauseffekt physikalisch möglich ist.
Aber es wurde auch gezeigt, dass die IR-Strahlung der Wolken den Treibhauseffekt von CO₂ erheblich verringert.
Die Experimente bestätigen die Position der "Skeptiker", die in Wasserdampf und Wolken eine Verringerung der CO₂-Klimasensitivität sehen und den "Alarmisten" eine maßlose Übertreibung einer angeblichen CO₂-Gefahr vorwerfen.
-
Dr. Michael Schnell
2020-06 en Experimental review of the CO₂ greenhouse effect - The false climate prophetsAbstract
Jean-Baptiste Joseph Fourier was the first to postulate a warming of the atmosphere by CO₂ in 1827.
Many years later, Hoimar von Ditfurth, Volker Quaschning and Albert Arnold "Al" Gore believed that they had experimentally proven the Fourier thesis since they observed considerable air warming in various CO₂ experiments.
A careful review of their experiments now shows that the public is being manipulated and deceived here.
The temperature increases are not caused by the CO₂ greenhouse effect, but by the decrease in heat conduction.
Particularly strong effects are obtained when CO₂ is injected as a "gas lake" under an air layer.
However, if, as in the atmosphere, air and CO₂ are mixed evenly, there is no warming and, in special circumstances, even a slight cooling can occur.
Introduction
Following the established mass media, the supposedly man-made climate change is scientifically proven and does not require further research.
First of all, a contradiction in itself, because science does not provide absolute truths, laws set in stone, but only assumptions and hypotheses.
Even if a thesis has proven itself in practice and has gained general recognition, a critical review is not a sacrilege but an indispensable duty of every scientist.
Prohibitions on thinking and muzzles are methods and typical features of a dictatorship that degrades science to an unworthy servant of the powerful.
How credible is a society that wants to be colorful but suppresses diversity of opinion (here).
It is very worrying that only former institute directors, retired professors and researchers speak out on climate change and contradict the doomsday scenarios.
When only people resist who no longer have to worry about their career, reputation, or income.
When in Germany the older generation is mocked by a public broadcaster ("Meine Oma ist 'ne alte Umweltsau". My grandma is an old environmental pig").
For an outsider, it is difficult to impossible to verify the forecasts of drought, heat, floods and species extinction.
Unless you rummage in ancient newspapers and find dark prophecies in beautiful regularity such as the "unusual" Arctic warming in 1924 and 1934 (here, here).
Perhaps it is the older people's life experiences that they do not fall for the sensational journalism and react rather calmly.
The doom predictions divide society into people who believe everything the media produces and people who prefer to form their own opinions.
My experimental investigations are aimed at the latter group.
Even if the complex occurrence of weather and climate in the laboratory cannot be reproduced, individual aspects and statements can be checked.
The following article deals with spectacular laboratory experiments by prominent climate alarmists that should be critically examined.
In the end, it will become clear why their experiments have failed and their warnings about the supposedly dangerous CO₂ are unfounded.
1. The Hoimar von Ditfurth Experiment
There are a number of simple experiments on the Internet that link the CO₂ greenhouse effect with air temperature.
According to this, CO₂ should behave like a glass pane that allows short-wave light to pass through but absorbs longwave heat radiation.
A significant warming after the addition of CO₂ was considered to be proof of a greenhouse effect.
2.1 Verification of the Ditfurth experiment
As in the Ditfurth experiment, the air-filled, open apparatus (Fig. 2, left picture) is irradiated with a 100 W red light reflector lamp.
Due to the irradiation, the experimental apparatus is up to 10 °C warmer than the air in the room.
2.2 The Argon Control Experiment
At first glance, the previous CO₂ experiment seems to confirm the Ditfurth hypothesis.
But doubt is the mother of all science and so this result must also be checked.
Argon offers itself as an alternative control gas.
Argon is like CO₂ a heavy gas but not a greenhouse gas and should not cause a temperature change when introduced into the tube.
However, the control experiment is a big surprise:
The IR-inactive argon causes exactly the same temperature increases as the greenhouse gas CO2 (Fig. 4).
2.3. Conclusions of the study
The noble gas argon is an IR inactive gas that can neither absorb nor emit thermal radiation.
If CO₂ and argon show the same heating effect, the cause must be sought outside of thermal radiation.
Heavy gases have a lower specific thermal conductivity λ than air (the table in Fig. 4).
If these gases are injected into the tube, they reduce the heat flow within the apparatus.
The heavy gases act as an insulating layer.
Thus it can be concluded:
The Ditfurth experiment does not show the greenhouse effect, but is a phenomenon of heavy gases
4. Conclusion and search for causes
The claims of Al Gore, Ditfurth und Quaschning that they have proven the CO₂ greenhouse effect through air heating are false.
If one eliminates special effects caused by the low specific heat conduction of heavy gases and by a concentration gradient, nothing remains of the postulated warming.
Final remarks
With both investigation methods it was proven that at least the near-earth CO₂ greenhouse effect is physically possible.
But it has also been shown that the IR radiation from the clouds significantly reduces the greenhouse effect of CO₂.
The experiments confirm the position of the "skeptics" who see water vapor and clouds as a reduction in CO₂ climate sensitivity and accuse the "alarmists" of an excessive exaggeration of an alleged CO₂ hazard.
| Michael Schnell |
Dr., ehemals Universität Rostock, Zentralinstitut für organische Chemie,
Berlin-Adlershof, ehemals Feinchemie Schwebda GmbH.
▶Michael Schnell: Who is who (Skeptiker) ▶Michael Schnell: Video (Präsentationen) |
↑ CO₂ das entscheidende Experiment
-
Christoph Massag
2020-01-06 en
CO₂ das entscheidende Experiment
Das Experiment zeigt auch: Wenn sich CO₂ in der oberen Atmosphäre anreichern würde, hätte dies schon im Verlauf von Jahrmillionen zu einer katastrophalen Anreicherung geführt.
Es gibt immer schon ein Gleichgewicht zwischen abregnender Kohlensäure und CO₂ in der Atmosphäre.
Würde kein CO₂ mehr frei gesetzt, so würde CO₂ aus dem Meer austreten, um das Gleichgewicht wieder zu erzeugen.
Im Meer befinden sich etwa 10x so viel gelöstes CO₂ wie in der Atmosphäre.
Warmes Bier, warme Cola und warmer Sprudel gasen CO₂ schneller ab.
CO₂ löst sich in kühlem Wasser besser als in warmen Wasser.
Warmes Wasser verdunstet und kondensiert oben in den Wolken.
Deshalb wirkt der Wasserkreislauf wie eine CO₂ Pumpe, die das CO₂ aktiv aus höheren Luftschichten wieder herunterwäscht.
Da der CO₂ Gehalt auf der Erde etwas zu schwach für optimales Pflanzenwachstum ist, leiten Holländische Tomatenzüchter einen Teil der CO₂ Abgase ihrer Gewächshausheizungen wieder zurück in die Gewächshäuser.
Das ist das Geheimnis der Hollandtomaten.
Keine grüne Pflanze wächst ohne CO₂.
Die NASA hat einen weltweiten Trend festgestellt, dass, seit es Satelliten gibt, die Vegetationsfläche auf der Erde mehr gewachsen ist, als die Wüsten vernichtet haben.
Global Greening nennt man dieses Phänomen.
Ein Effekt, der dazu beitrug war womöglich die erhöhte CO₂ Düngung.
Es ist zu hoffen, dass die zusätzliche "CO₂ Düngung" zur Steigerung von Global Greening beiträgt und die politisch entfachten Großbrände löscht.
Ein einzelner Vulkanausbruch kann weit mehr CO₂ frei setzen wie Deutschland, in 600 Jahren frei setzt.
Der größte CO₂ Produzent auf der Erde sind jedoch die Termiten, Ameisen und Mikroorganismen.
Diese Zersetzen innerhalb eines Jahres im Schnitt alles, was im Verlauf der jeweiligen Vegetationsperiode gewachsen ist.
Auch das ist ein Gleichgewicht.
Das ist ein Vielfaches von den, vom Menschen geförderten fossilen Brennstoffen.
Dennoch müssen wir mit diesen sparsam umgehen.
Saurer Regen ist nicht saurer Regen.
Es gibt viele unterschiedliche Säuren.
Kohlensäure entlässt ihr CO₂ neutral an die Pflanzen.
Danach ist das Wasser nicht mehr sauer.
Dieser Effekt geschieht bevorzugt bei Wärme.
Die Ozeane haben mindestens die 50 fache Masse der Erdatmosphäre und durch die große Tiefe auch eine prima Temperatur um gigantische Mengen CO₂ aufzunehmen.
Nicht nur das auf diese Art gelöstes CO₂ für Jahre aus dem Kreislauf genommen wird es wird in den Ozeanen auch in grossen Mengen verbraucht durch Lebewesen die Kalkpanzer haben (Schnecken, Muscheln, Algen Krebse, Korallen, alles was Kalk im Panzer hat nimmt CO₂ auf.
Kalk ist nicht mehr löslich, also ist auf diese Art gebundenes CO₂ dauerhaft aus dem Spiel.
Schwefelsaurer Regen z.B. kann Böden und Meere übersäuern, das liegt an der Schwefelsäure.
Und es gibt zusätzlich noch mehr Säuren.
Wenn CO₂ aus kohlesaurem Wasser abgast, ist das Wasser wieder neutral.
Heute steht an jeder Tankstelle, an jeder Zapfsäule, "Schwefelfrei".
Schwefelsäure im Regen kommt von der Verbrennung schmutziger fossiler Brennstoffe.
Schwefel lässt sich aus Abgasen herausfiltern.
Steigt das Molekül CO₂ oder auch andere Klimagase wie das Molekül Methan, noch weiter über die Wolkengrenze, werden diese durch die starke Strahlung dissoziiert, also zerlegt.
Es gilt wieder das gleiche Argument wie oben:
Wenn sich diese Gase in der oberen Atmosphäre anreichern würden, hätte dies schon vor Jahrmillionen zu einer katastrophalen Anreicherung geführt.
Es gibt immer schon ein Gleichgewicht.
Im Hintergrund des Video können Sie lesen:
"Dennoch: Umweltschutz ist wichtig!
Bitte verschwenden Sie nie unnötig Ressourcen."
Dieses Experiment soll keine Werbung für die Verschwendung von fossilen Brennstoffen sein, aber es gibt eben auch keinen Grund für Panik.
Der CO₂ Gehalt in der Luft ist heute etwa 0,04%, das sind gleich 400 Moleküle CO₂ pro einer Million Moleküle anderer Gase.
1885 waren es laut Meyers Konversationslexikon ca. 400 ppm.
In schlecht gelüfteten Zimmern ist der CO₂ Gehalt oft ein vielfaches (z.B. zehnfaches) davon.
Die ausgeatmete Luft hat bis zu 4% CO₂ und kann dennoch zur Mund zu Mund Beatmung verwendet werden.
Nur in Bergwerken kann sich CO₂ so anreichern, dass es zur Erstickung führt.
In kühlen, feuchten Nächten sinkt der CO₂ Gehalt der Luft auch heute noch weit unter 0,04% ab (z.B. 0,02%).
Täglich schwankt der CO₂ Gehalt überall.
Der CO₂ Gehalt ist so gering, dass er in Erdnähe keinerlei negative Auswirkungen hat.
Die erklärte Auswirkung für große Höhen ist, in großen Höhen würde zu viel CO₂ die Wärmestrahlung am Austritt aus der Erdatmosphäre behindern.
Das ist der Treibhauseffekt.
Dennoch kühlt die Erde jede Nacht deutlich ab.
Ganz so dicht ist das "Treibhaus" eben nicht.
Deshalb ist es so wichtig, die Menschen darauf aufmerksam zu machen, nicht von Klimaschutz allein zu sprechen, sondern von Umweltschutz.
⇧ 2019
↑ Michael Schnell - Welchen Einfluß haben Treibhausgase auf die Lufttemperatur?
-
13. Internationale EIKE-Klima- und Energiekonferenz (IKEK-13) am 22. und 23. November 2019 in München.
2019-11-22 de
Michael Schnell - Welchen Einfluß haben Treibhausgase auf die Lufttemperatur?
13. Internationale EIKE-Klima- und Energiekonferenz (IKEK-13) am 22. und 23. November 2019 in München.
Dr. Michael Schnell, ehemals Universität Rostock, Zentralinstitut für organische Chemie, Berlin-Adlershof, ehemals Feinchemie Schwebda GmbH.
Die postulierte Klimakatastrophe durch Aufheizung der Atmosphäre soll laut Weltklimarat (IPCC) hauptsächlich durch das künstlich eingetragene Treibhausgas Kohlendioxid verursacht werden.
Die Idee des Treibhauseffektes stammt ursprünglich von dem französischen Wissenschaftler Joseph Fourier, der sie bereits 1827 publizierte.
Michael Schnell baute für seine Klimaforschung eine Versuchsapparatur, die die Auswirkungen der erdnahen Infrarotstrahlung (IR), einem Teilaspekt des Treibhauseffektes, nachstellt.
| Michael Schnell |
Dr., ehemals Universität Rostock, Zentralinstitut für organische Chemie,
Berlin-Adlershof, ehemals Feinchemie Schwebda GmbH.
▶Michael Schnell: Who is who (Skeptiker) ▶Michael Schnell: Video (Präsentationen) |
⇧ 2014
↑ Der Treibhauseffekt: Sendung Hoimar von Ditfurths aus dem Jahre 1978
⇧ 2012
↑ en 'Greenhouse Effect In A Bottle' Experiment - Reconsidered
de Bemerkung
Beachten Sie bitte, dass die Temperatur im Behälter mit dem CO2 nur steigt, wenn dieser luftdicht verschlossen ist.
CO2 hat einen grösseren Wärmeausdehnungskoeffizienten als Luft.
Nach der Gasgleichung erwärmt sich das CO₂ durch (und wegen) der Kompression stärker als die Luft.
Bei gleichem Druck (Behälter nicht verschlossen) erwärmen sich Luft und CO2 gleich stark.
en
Note
Please note the difference of the resulting temperatures if the containers
are closed gas-tight or left open, as shown in following experiment.
en
![]() 'Greenhouse Effect In A Bottle' Experiment - Reconsidered
(Seite gelöscht, kein Wayback)
'Greenhouse Effect In A Bottle' Experiment - Reconsidered
(Seite gelöscht, kein Wayback)
When carbon dioxide is allowed to expand when heated it does not become
any warmer than does regular air, therefore this experiment contains
no evidence that carbon dioxide causes an enhanced "greenhouse
effect".
Carl Brehmer
en
![]() 'Greenhouse Effect In A Bottle' Experiment - Reconsidered
(Seite gelöscht, kein Wayback)
'Greenhouse Effect In A Bottle' Experiment - Reconsidered
(Seite gelöscht, kein Wayback)
-
From the Script for the video
"A popular science experiment that purports to prove that adding extra carbon dioxide to the air will cause an enhanced "greenhouse effect" goes something like this.
Start with two bottles:
One of the bottles is left with regular air in it
and the other bottle is filled with carbon dioxide
from a seltzer bottle, carbon dioxide cartridge, dry ice or whatever.Experiment #1
Since I used data recorders to monitor the temperature inside the bottles in my experiment, I put these recorders into the bottles before adding the carbon dioxide to one of them.
I left a third data recorder outside of the bottles away from the experiment but in the same room so that I could measure the temperature change of each gas above room temperature when they were heated with infrared radiation.
I then closed the lids on both bottles tight enough to keep the gases from escaping during the experiment. Once the bottles were prepared heat lamps of equal strength were positioned at equal distance from each bottle and the lamps were then turned on.
I recorded what happened and here are my results.
On this graph the red line is the temperature of the carbon dioxide and the blue line is the temperature of the regular air.
The carbon dioxide reached about 22 degrees Celsius above room temperature, while the regular air only reached about 16 degrees Celsius above room temperature.
As you can also see in this graph the carbon dioxide got warmer more quickly than the regular air and stayed about 6 degrees Celsius warmer throughout the experiment.
This experiment has been performed hundreds of times at science fairs around the country and it is proclaimed to be empirical evidence of the 'greenhouse effect', which postulates that the greater warming of the carbon dioxide in this experiment is caused by the carbon dioxide absorbing more infrared radiation than did the regular air, thus affirming the belief that adding more carbon dioxide to the atmosphere will cause it to be warmer than it would otherwise be.
Experiment #2
So, after the bottles cooled to room temperature
I repeated the experiment with the lids vented to allow the gases to expand as they would in the real atmosphere and these are the results that I got.As you can see, that which was being called the "greenhouse effect" disappeared when the gases were allowed to expand freely the way they do in the outside atmosphere.
On this second graph the red line is still the temperature of the carbon dioxide and the blue line is still the temperature of the air, but as you can see they now track together quite nicely.
Also notice that without the 'heat of compression' even the air only warms about 7 degrees Celsius, which is less than half of the 16 degrees Celsius of warming that it experienced under the 'heat of compression.'
....you get the graph on the right, which shows virtually no temperature differential between carbon dioxide and air when heated by infrared radiation.
What can we conclude from this experiment?
When carbon dioxide is allowed to expand when heated it does not become any warmer than does regular air, therefore this experiment contains no evidence that carbon dioxide causes an enhanced "greenhouse effect".
Rather it confirms what is already know, that carbon dioxide has, what is called, a greater "coefficient of thermal expansion" than does regular air.
If you are paying attention though, this experiment has an even greater lesson to teach us.The Greater Lesson
So, how then might this experiment serve as a metaphor for what's happening in the larger world of climate science today?
Is it possible that a similar misidentification of natural forces exists on a larger scale within the real world atmosphere? Let's take a look.
This is what the 'greenhouse effect' hypothesis is all about it offers an explanation of why these two temperatures are different.
The temperature on the left, the minus 18 degrees Celsius, is the temperature at which scientists have calculated that the atmosphere should be to maintain balance with incoming sunlight, but they have noticed that the measured global mean temperature at the surface of the earth is around plus 15 degrees Celsius.
This is a difference of 33 degrees Celsius.
The question then is 'Where did this extra 33 degrees Celsius of warming come from?'
A number of scientists assert that this extra 33 degrees Celsius of warming at the earth's surface is caused by the 'greenhouse effect.'
I would like to offer for your consideration an alternative explanation.
As it turns out there actually is not any extra heat in the atmosphere.
The temperature of the atmosphere is exactly what it should be, as calculated, to maintain perfect balance with incoming sunlight - it is roughly minus 18 degrees Celsius at its core, at its center mass, which is about 5 kilometers up.
The real question then is not, 'Why is the surface of the earth 33 degrees Celsius warmer than it would be if there were no atmosphere.'
The real question is, 'Why is the temperature of the atmosphere at the surface of the earth 33 degrees Celsius warmer than it is at the atmosphere's core, at its center mass, which is about 5 kilometers up in the sky?'
Well, it should be obvious that this warming is caused by the 'heat of compression,' since the force of gravity compresses the air below the center mass of the atmosphere against the surface of the earth.
The relationship between a gas's volume, pressure and temperature, which our tabletop experiment demonstrated quite nicely, is not a new discovery.
It has been know for centuries as the Ideal Gas Law.
[de Thermische Zustandsgleichung idealer Gase en Ideal gas law}
So, when the gravity compresses the atmosphere against the surface of the earth the operation of the Ideal Gas Law demands that the surface temperature increase as a result.
Do to the specific mass of our atmosphere this compression raises the mean global temperature from a minus 18 degrees Celsius at the atmosphere's core to a plus 15 degrees Celsius at the earth's surface.
This is a total of about 33 degrees Celsius.
This can even be demonstrated mathematically, because it has been observed through millions of weather balloon soundings over the past 100 years that the average rate at which the air temperature changes as you change altitude is about 6.5 degrees Celsius per kilometer, either up or down.
As you go up the air gets cooler as you go down the air gets warmer just because the air pressure changes with altitude.
High altitude skydivers experience the Ideal Gas Law every time they jump.
If, for instance, they start their jump at the atmosphere's center mass, about 5 kilometers up, for every km that they fall the air becomes about 6.5 degrees Celsius warmer so by the time that they reach the ground they will have experienced roughly 33C of warming.
So, the mystery is solved.
There is no extra heat in the atmosphere.
It is exactly the temperature that it needs to be to maintain balance with incoming sunlight.
It is just that the air beneath the center mass of the atmosphere is being compressed by gravity raising the surface temperature about 33 degrees Celsius above what it would be if there were no gravity.
So, even as in our tabletop experiment where the operation of the Ideal Gas Law was misidentified as being an enhanced "greenhouse effect".
So to, in the real world atmosphere the 'heat of compression' created by the force of gravity is being misidentified as the 'greenhouse effect.'
In the tabletop experiment when the 'heat of compression' was removed the so-called 'greenhouse effect' disappeared.
Were we able to suspend the force of gravity than that, which is currently being called the global 'greenhouse effect', would disappear as well and the atmosphere at the surface would be about 33 degrees Celsius cooler.
So, even though it has been asserted 'Without the natural greenhouse effect the surface of the planet would be about 33 degrees Celsius colder on average,'
What we should be saying is that
'without the force of gravity compressing the lower atmosphere, the surface of the planet would be about 33 degrees Celsius colder on average than it is now.'
Comment on the effect of latent heat transfer on the "atmospheric lapse rate" from the author of the above video:
I realize the that the average atmospheric lapse rate of 6.5 degrees Celsius per kilometer would be much higher without the latent heat transfer created by the evaporation of water into vapor at low altitudes and its subsequent condensation at high altitudes, but one can only put so much information into a 15 minute video.
See following paper by Joseph E. Postma, Msc.
-
Joseph E. Postma, Msc,
2011-07-22 en
The Model Atmospheric Greenhouse Effect
⇧ 2011
↑ en Repeatability of Prof. Robert W. Wood's experiment
-
Biology Cabinet / Nasif S. Nahle
2011-06-12 en Experiment on the Cause of Real Greenhouses' Effect - Repeatability of Prof. Robert W. Wood's experimentAbstract:
Through this controlled experiment, I demonstrate that the warming effect in a real greenhouse is not due to longwave infrared radiation trapped inside the building, but to the blockage of convective heat transfer with the surroundings, as proven by Professor Wood in his 1909 experiment.
-
Biology Cabinet / Nasif S. Nahle
2011-07-05 en
Experiment on the Cause of Real Greenhouses' Effect -
Repeatability of Prof. Robert W. Wood's experiment
-
sci.tech-archive.net
2008-04-04 en R. W. Wood's "Note on the Theory of the Greenhouse"The following article was published in the Philosophical Magazine in 1909 (Vol. 17, pp. 319-320):
XXIV. Note on the Theory of the Greenhouse
By Professor R. W. Wood (Communicated by the Author)
↑ Replicating Al Gore's Climate 101 video experiment shows that his "high school physics" could never work as advertised
Nicht der gleichen Meinung / Does not agree / Pas d'accord
|
|
|
Watts Up With That? (Antony Watts)
2011-10-18 en
Replicating Al Gore's Climate 101 video experiment shows that his
"high school physics" could never work as advertised
-
Readers may recall my previous essay where I pointed out how Mr. Gore's Climate 101 Video, used in his "24 hours of climate reality", had some serious credibility issues with editing things to make it appear as if they had actually performed the experiment, when they clearly did not.
It has taken me awhile to replicate the experiment.
Delays were a combination of acquisition and shipping problems, combined with my availability since I had to do this on nights and weekends.
I worked initially using the original techniques and equipment, and I've replicated the Climate 101 experiment in other ways using improved equipment.
I've compiled several videos.
RESULT:
No change, no difference in temperature.
Nothing near the 2°F (1°C) rise shown in the video.
Inconclusive.Conculsion
Mr. Gore's Climate 101 experiment is falsified, and could not work given the equipment he specified.
If they actually tried to perform the experiment themselves, perhaps this is why they had to resort to stagecraft in the studio to fake the temperature rise on the split screen thermometers.
The experiment as presented by Al Gore and Bill Nye "the science guy" is a failure, and not representative of the greenhouse effect related to CO2 in our atmosphere.
The video as presented, is not only faked in post production, the premise is also false and could never work with the equipment they demonstrated.
Even with superior measurement equipment it doesn't work, but more importantly, it couldn't work as advertised.
I should make it clear that I'm not doubting that CO2 has a positive radiative heating effect in our atmosphere, due to LWIR re-radiation, that is well established by science.
What I am saying is that Mr. Gore's Climate Reality Project did a poor job of demonstrating an experiment, so poor in fact that they had to fabricate portions of the presentation, and that the experiment itself (if they actually did it, we can't tell) would show a completely different physical mechanism than what actually occurs in our atmosphere.
|
|
|

↑ Al Gore's Climate 101 video experiment
de Panik-Küche en Panic laboratory fr Marmite alarmiste
|
|

⇧ 2010
↑ en Some Coolness Concerning Global Warming: Richard D. Lindzen and Roy W. Spencer, Ph. D.
-
Richard D. Lindzen
1990 en
Some Coolness Concerning Global Warming
-
Roy W. Spencer, Ph. D.
2009-12-31 en What If There Was No Greenhouse Effect?As Dick Lindzen alluded to back in 1990 [see above], while everyone seems to understand that the greenhouse effect warms the Earth's surface, few people are aware of the fact that weather processes greatly limit that warming.
And one very real possibility is that the 1 deg. C direct warming effect of doubling our atmospheric CO2 concentration by late in this century will be mitigated by the cooling effects of weather to a value closer to 0.5 deg. C or so (about 1 deg. F.)
This is much less than is being predicted by the UN's Intergovernmental Panel on Climate Change or by NASA's James Hansen, who believe that weather changes will amplify, rather than reduce, that warming.
-
Roy W. Spencer, Ph. D.
2010-08-06 en Help! Back Radiation has Invaded my Backyard!Measuring The (Nonexistent) Greenhouse Effect in My Backyard with a Handheld IR Thermometer and The Box
⇧ 2009
↑ Other 'Global Warming' experiments
de Bemerkung
Beachten Sie bitte, dass die Temperatur im Behälter mit dem CO2 nur steigt, wenn dieser luftdicht verschlossen ist.
CO2 hat einen grösseren Wärmeausdehnungskoeffizienten als Luft.
Nach der Gasgleichung erwärmt sich das CO₂ durch (und wegen) der Kompression stärker als die Luft.
Bei gleichem Druck (Behälter nicht verschlossen) erwärmen sich Luft und CO2 gleich stark.
en
Note
Please note the difference of the resulting temperatures if the containers
are closed gas-tight or left open, as shown in following experiment.
en
![]() 'Greenhouse Effect In A Bottle' Experiment - Reconsidered
(Seite gelöscht, kein Wayback)
'Greenhouse Effect In A Bottle' Experiment - Reconsidered
(Seite gelöscht, kein Wayback)
When carbon dioxide is allowed to expand when heated it does not become
any warmer than does regular air, therefore this experiment contains
no evidence that carbon dioxide causes an enhanced "greenhouse
effect".
de Panik-Küche en Panic laboratory fr Marmite alarmiste
The Royal Institution's new Young Scientist Centre
Greenhouse effect (in a bottle) explained
-
The Royal Institution's new Young Scientist Centre
2009-12-06 en Greenhouse effect (in a bottle) explainedScientist Dr Maggie Aderin-Pocock from EADS Astrium visits the Royal Institution's new Young Scientist Centre to carry out a simple experiment that shows how CO2 traps heat.
NOAA Learning Lesson: Its a Gas, Man
-
Watts Up With That? (Antony Watts)
2009-11-03 en NOAA deletes an "inconvenient" kids science web pageHadley CRU isn't the only government agency that deletes web content related to climate.
NOAA/NWS Southern Region Headquarters has gotten into the act.
An interesting thing happened today.
NOAA deleted an educational web page about an experiment you can do with CO2.
-
Deep Climate
en Contrarian Education at NOAAEarly version from October 15, 2003
en Learning Lesson: Its a Gas, Man
Old discussion section
-
The seltzer tablets supplied one bottle with a source of carbon dioxide. The "fiz" will have heated faster and to a higher temperature than in the other bottle.
The increase in heating ability is due to carbon dioxide's high capacity to hold heat.
-
It has been thought that an increase in carbon dioxide will lead to global warming.
While carbon dioxide in the atmosphere has been increasing over the past 100 years, there is no evidence that it is causing an increase in global temperatures.
-
In 1997, NASA reported global temperature measurements of the Earth's lower atmosphere obtained from satellites revealed no definitive warming trend over the past two decades.
In fact, the trend appeared to be a decrease in actual temperature.
-
The largest differences in the satellite temperature data were not from any man-made activity, but from natural phenomena such as large volcanic eruptions from Mt. Pinatubo, and from El Niño.
-
The behavior of the atmosphere is extremely complex.
Therefore, discovering the validity of global warming is complex as well.
How much effect will the increase in carbon dioxide will have is unclear or even if we recognize the effects of any increase.
-
New version - Update Nov 11, 2009
en Learning Lesson: Its a Gas, Man - New version
The carbon dioxide lesson has been reinstated, with the previous information removed from the discussion section.
New discussion section
-
The seltzer tablets supplied one bottle with a source of carbon dioxide.
The "fiz" will have heated faster and to a higher temperature than in the other bottle.
The increase in heating ability is due to carbon dioxide's high capacity to hold heat.
-
Fast Facts
To see the full effect of a greenhouse effect, look to the planet Venus.
The atmosphere of Venus consists of 96% carbon dioxide, 3.5% nitrogen, with the remaining amount, less than 1%, of other gasses.
The carbon dioxide atmosphere has allowed the temperature of the surface to exceed 900°F (482°C).
This is hot enough to melt lead.
Space craft that have successfully landed on Venus, despite being well protected, have lasted only about an hour in the excessive heat and crushing pressure.
National Aeronautics and Space Administration
Glory and Global Warming Experiment
-
National Aeronautics and Space Administration
Goddard Space Flight Center
2011-10-31 en Glory and Global Warming ExperimentThe effects of carbon dioxide on the temperature
The bottle with carbon dioxide in it will heat up faster and will stabilize at a higher temperature than the bottle with air.
Some people measure a difference of five degrees Celsius or more, or the difference between a warm spring day and a hot summer day.
Royal Society of Chemistry
The carbon dioxide greenhouse - is it effective?:
a lab ICT test (teachers' notes)
-
Royal Society of Chemistry
en
The carbon dioxide greenhouse - is it effective?:
a lab ICT test (teachers' notes)
Typical results
Even over a small time period such as 20 minutes we are still able to get a difference of 4°C in temperature between the two samples, the carbon dioxide warming more and faster than the air.
Mythbusters tests global warming theory - does CO2 warm air?
-
Mythbusters
2009-11-15 en
Mythbusters tests global warming theory - does
CO2 warm air?
They build transparent boxes, fill some with CO2 and methane, then monitor temperature differences.
⇧ 13 Aus der Panik-Küche
↑ Professor Harald Lesch: Übrigens zur Klimakatastrophe
de Panik-Küche en Panic laboratory fr Marmite alarmiste
Original Video ohne Kommentar: Video vom 23.5.2012
-
Harald Lesch 2012-05-23 de
Übrigens zur Klimakatastrophe
de Fakten en Facts fr Faits
Video mit Kommentar: Klima-Alarmist Harald Lesch entlarvt
-
Harald Lesch 2016-09-30 de
Klima-Alarmist Harald Lesch entlarvt
Kommentar der kalten Sonne zu "Übrigens zur Klimakatastrophe" von Prof. Lesch
-
Die kalte Sonne (Fritz Vahrenholt, Sebastian Lüning)
2016-11-10 de Lesch Lesch LeschBereits 2012 hat sich Lesch mit einem Klimavideo kräftig blamiert:
Lesch beschreibt einen Planeten, der bei geringster (auch zufälliger) Temperaturerhöhung unbewohnbar werden muss.
Nach der Erklärung des Professors erhöht sich infolge der Erwärmung der Wasserdampfgehalt, was wiederum zu weiterer Erwärmung führen muss.
Das wird auf diesem Planeten verstärkt durch die nachlassende Fähigkeit des etwas wärmeren Wassers, Kohlendioxid zu binden.
Dies führt zu steigendem CO2-Gehalt, was wiederum zur Erwärmung führt.
Diese weitere Erwärmung führt zum Auftauen des Permafrostbodens, was zur Freisetzung von Methan führt und dies zu weiterer Erwärmung.
Ergebnis: eine kleine Temperaturerhöhung muss zwangsläufig zum Klimakollaps durch einen weglaufenden Treibhauseffekt führen.
Ein Regelkreis mit nahezu unendlicher Verstärkung!
Unser Professor im Fernsehen ("Abenteuer Forschung") hat nur vergessen die Frage zu stellen, warum er da ist, um das ganze an die Tafel schreiben zu können!
Denn Prof. Lesch kann nicht unsere Erde beschrieben haben, dort trat in den Milliarden Jahren ihrer Existenz ein solches Verhalten nicht auf, sonst wäre weder der Professor noch das Medium Fernsehen noch das staunende Publikum vorhanden sondern nur ein "kochender" Planet a la Venus.
Mit der Ausstrahlung der Sendung negiert sich ihre Aussage!
| Harald Lesch |
Astrophysiker, Naturphilosoph, Wissenschaftsjournalist, Fernsehmoderator, Professor für Physik an der LMU München Lehrbeauftragter für Naturphilosophie an der Hochschule für Philosophie München. ▶Harald Lesch: Who is who (Aktivist der anthropogenen Globalen Erwärmung) ▶Harald Lesch: Wikipedia (Profiteure) |