Topics - Vademecum - Topics
Mit folgenden Links wird von anderen Webseiten auf diese Seite verwiesen:
| de | en | fr |
|---|---|---|
|
Neuigkeiten Topics |
Topics Topics |
Sujets Topics |
-
Die Weltwoche / Thomas Fasbender
2022-05-28 de Moralisierende Heisssporne: Braucht die Welt wirklich einen ukrainischen Sieg?Die Lager driften auseinander: das bellizistische und das realistische.
Waren die Zweifel an Waffenlieferungen in die Ukraine anfangs pazifistisch motiviert, mehren sich die Stimmen der kühlen Vernunft.
Nicht ohne Grund gilt sie den moralisierenden Heissspornen als empathiefrei.
Für diese in Medien und Politik hochprominente Gruppe hat der Krieg nur ein mögliches Ende: einen ukrainischen Sieg.
Erst kürzlich haben die G-7 ganz offiziell die ukrainischen Kriegsziele unterschrieben:
Wiederherstellung der territorialen Integrität einschliesslich der Krim.
Damit ist jede Verhandlungslösung vom Tisch;
mit der G-7-Entscheidung haben die Washingtoner und Kiewer Falken den Westen in der Hand.
Damit ist jede Verhandlungslösung vom Tisch;
Unablässig wirbt man in Kiew für mehr Unterstützung, mehr Waffen, mehr westliches Engagement.
Allein die drei Worte «einschliesslich der Krim» verbürgen einen langen Krieg.
Ihre Halbinsel werden die Russen verteidigen wie 1941 Moskau und Leningrad.
Solche Aussichten rufen die Realisten auf den Plan:
Das Editorial Board der New York Times hat die brutale Frage schon gestellt:
Wo liegen denn die amerikanischen Interessen im Ukraine-Krieg?
Da geht es nicht um «Sterben für Kiew».
Es geht um die Bedeutung der Region für die Rivalität des Jahrhunderts.
Und die liegt in der Herausforderung der USA durch China.
Europa ist Zaungast, keinesfalls entscheidend.
Und die europäischen Werte, am Ende auch die territoriale Integrität des einen oder anderen europäischen Staats, sind Verhandlungsmasse, wenn es um die Wurst geht.
Da kann Europa so viel Waffen liefern, wie es will.
![]() USA:
Politik,
Umwelt- & Klimapolitik,
Energiepolitik,
Armut,
Migration.
USA:
Politik,
Umwelt- & Klimapolitik,
Energiepolitik,
Armut,
Migration.
▶Neutralität: Schweiz │ ▶Schweiz: Neutralität
![]() Schweiz:
Sachgebiete,
Medien Echo,
Web,
Schweiz/ EU,
Klimapolitik,
Energie.
Schweiz:
Sachgebiete,
Medien Echo,
Web,
Schweiz/ EU,
Klimapolitik,
Energie.
Dies obwohl er Crack in rauen Mengen verrauchte - und offenbar auch damit dealte.
Durch den Einfluss des Vaters scheffelte er Millionen von Dollar.
Weltwoche (2022-04-17)
en The Positive Impact of CO₂ Emissions on the Survival of Life
▶Unbequeme Wahrheiten: Die biologisch-geologische CO2-Sackgasse
Unterschied
en Difference
fr Différence
|
Anthropogenic Global Warming |
Natürliche Ursachen des Klimawandels |
|||||||||||
|---|---|---|---|---|---|---|---|---|---|---|---|---|
|
▶Who is who: Aktivisten der anthropogenen Globalen Erwärmung ▶Who is who: Institute & Organisationen der Globalen Erwärmung |
▶Who is who: Skeptiker der Globalen Erwärmung |
|||||||||||
|
MWP = Medieval Warm Period (Mittelalterliche Warmzeit)
Ab 2001 verschwindet dieses geschichtlich belegte Phänomen. |
RWP = Roman Warm Period
|
|||||||||||
|
Mittelalterliche Wärmeperiode und Kleine Eiszeit als lokales
nordatlantisches Phänomen: Seit wann liegt Japan am Atlantik?
|
||||||||||||
|
Who would like to bet the following outcomes on the models being correct.
Of course, if the models have no basis in reality and Anthropogenic Global Warming Catastrophism is an artefact of modelling - then the above outcomes can be avoided by pretty much doing nothing. de Zwei Fragen:
en Two questions:
fr Deux questions:
▶Glaube und Hysterie I, II, III.
|
Globaltemperatur der letzten 3200 Jahre
Der 230-Jahreszyklus in den letzten 165 Jahren überlagert von einem 65-Jahreszyklus
Der 230-Jahreszyklus in den letzten 165 Jahren wird überlagert von einem 65-Jahreszyklus sowie weiteren Effekten wie der unregelmäßigen ENSO-Erscheinungen und größeren Vulkanausbrüchen
Temperatur der letzten 1000 Jahre und die theoretische Fortsetzung in den nächsten 700 Jahren.
|
|||||||||||
|
Die 60 Jahre Ozean-Zyklus Sinus Kurve
de
Der 60 Jahre Ozean-Zyklus
The models are out of phase with reality
The modelers have failed to consider the future multidecadal
variations
Die Temperaturprognose aus dem 2007er IPCC-Bericht folgt offensichtlich der durch die Ozeanzyklen übersteilten Flanke, wäre jedoch besser dem Langzeittrend gefolgt. Der Langzeittrend wird zudem vermutlich in Kürze für eine Weile abknicken, da die Sonnenaktivität als wichtige Einflussgröße in den kommenden Jahrzehnten abnehmen wird. |
Die Pazifisch Dekadische Oszillation erhöht bzw. erniedrigt die Temperatur um jeweils etwa 0,2°C je nach PDO-Phase. Der Erwärmungsstop im Jahr 2000 fällt mit dem Abstieg der PDO zusammen und stellt eine Wiederholung der Situation aus den 1940er Jahren dar Aber es gibt ja nicht nur die PDO, sondern eine ganze Flöte von weiteren klimasysteminternen Zyklen. Nehmen wir zum Beispiel die AMO. Auch sie besitzt einen etwa 60-jährigen Zyklus, der jedoch um 10-20 Jahre zeitverzögert zur PDO abläuft. Und auch die Nordatlantische Oszillation (NAO) schwingt in diesem Größenmaßstab. Ist es nicht verwunderlich, dass all diese Zyklen in ähnlichen Zeitmaßstäben schwingen, wenn auch nicht synchron?
▶Ozeanzyklen/Ozeanische Oszillationen |
|||||||||||
|
Spiegel 1986 - "Die Klima-Katastrophe" ▶Spiegel 1986 - "Die Klima-Katastrophe" Spiegel Online 2004-04-01 de Winter ade - Nie wieder Schnee? In Deutschland gehören klirrend kalte Winter der Vergangenheit an: "Winter mit starkem Frost und viel Schnee wie noch vor zwanzig Jahren wird es in unseren Breiten nicht mehr geben", sagt der Wissenschaftler Mojib Latif vom Hamburger Max-Planck-Institut für Meteorologie.
Spiegel 2015 - Der verheizte Planet |
Die Abbildung zeigt Vorstöße und Rückzüge des Aletsch-Gletscher im Verlaufe der letzten ca. 3.500 Jahre. Seine maximale Größe hatte der Gletscher um 1860 erreicht. |
|||||||||||
|
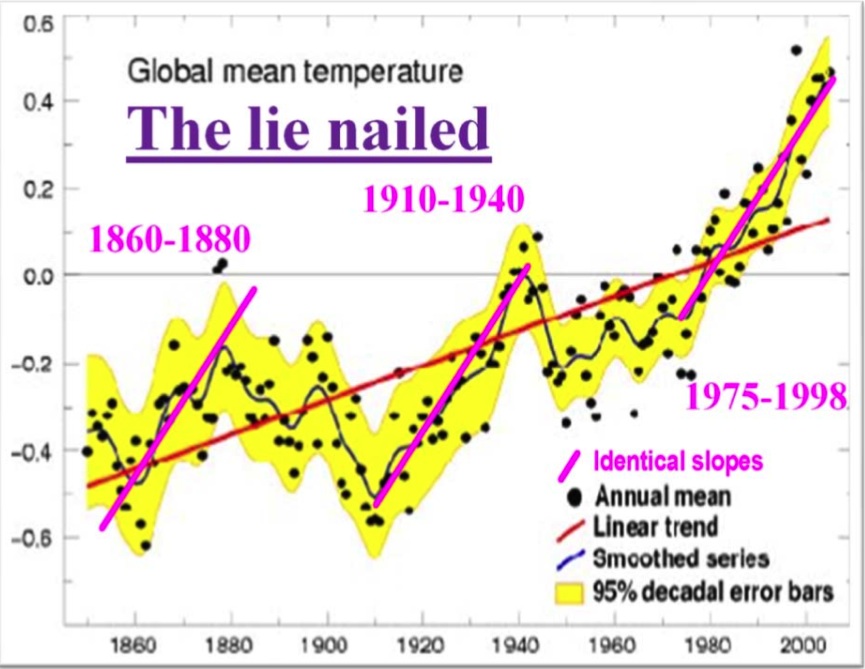
de Die Lüge festgenagelt
Ist die Temperaturssteigerung 1981-2005 einmalig verglichen mit dem
Temperaturanstieg seit der kleinen Eiszeit? en The lie nailed Is the global temperature increase 1981-2005 unique compared to the general temperature rise since the end of the Little Ice Age ?
|
||||||||||||
|
||||||||||||
|
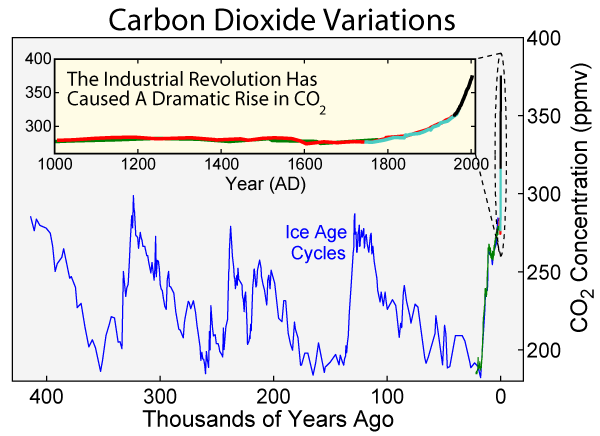
This figure shows the variations in concentration of carbon dioxide (CO2) in the atmosphere during the last 400 thousand years. Since the Industrial Revolution, circa 1900, the burning of fossil fuels has caused a dramatic increase of CO2 in the atmosphere, reaching levels unprecedented in the last 400 thousand years. This increase has been implicated as a primary cause of global warming.
▶Ernst-Georg Beck: Forschungen der CO2-Konzentrationen in der Vergangenheit |
Trends in Atmospheric Carbon Dioxide
Von Callendar ausgewählte CO2-Werte
und Abschätzung von 292 ppm als Mittelwert für das 19. Jahrhundert
|
|||||||||||
|
Forschungen der CO2-Konzentrationen in der Vergangenheit en Research on CO2 concentrations in the past fr Recherches sur la concentration du CO2 dans le passé |
▶Ernst-Georg Beck: Forschungen der CO2-Konzentrationen in der Vergangenheit |
|||||||||||
|
|
|||||||||||
|
▶IPCC Intergovernmental Panel on Climate Change ▶IPCC Special Report SR-15 2018
|
Die kalte Sonne
|
|||||||||||
|
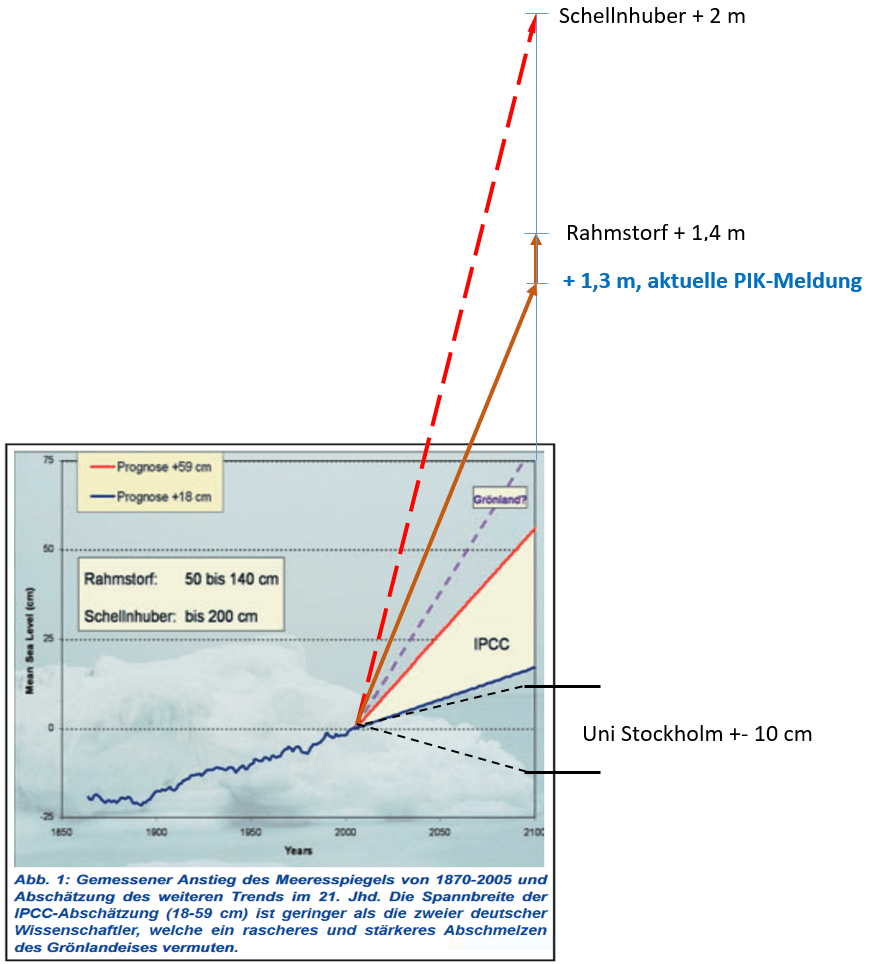
Pegel-Zukunfts-Vermutungen zweier deutscher PIK Klimawissenschaftler und vom Rest der Welt
|
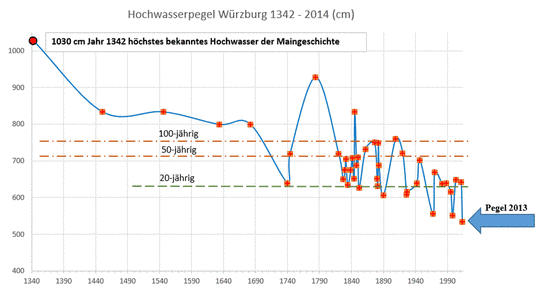
Hochwasserverlauf des Main bei Würzburg von 1340 - 2014
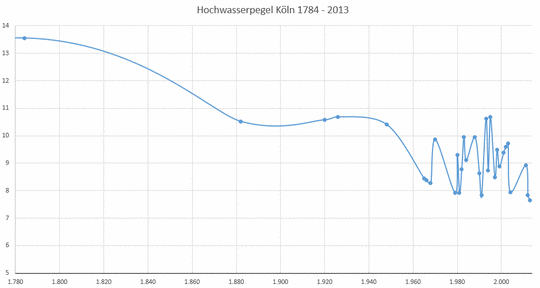
Hochwasserpegel Köln 1784 - 2013 |
|||||||||||
|
Climate Change 2014 Synthesis Report Human influence on the climate system is clear, and recent anthropogenic emissions of greenhouse gases are the highest in history. Recent climate changes have had widespread impacts on human and natural systems. |
de
en
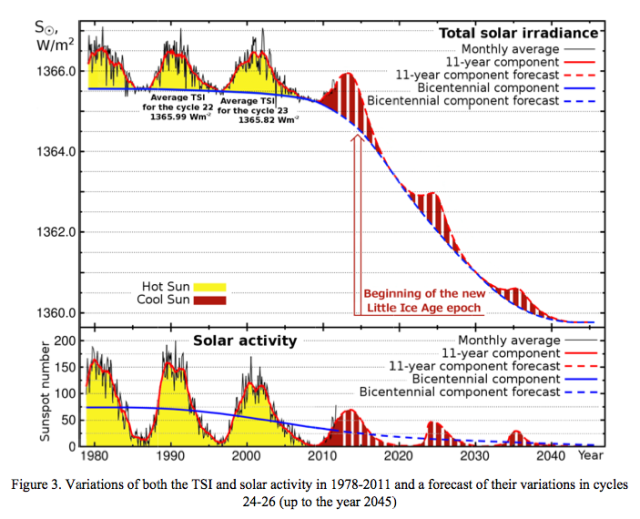
A) Total Solar Irradiance (TSI)
Two things are noteworthy:
|
|||||||||||
|
"The current understanding of climate change in the industrial age is that it is predominantly caused by anthropogenic greenhouse gases, with relatively small natural contributions due to solar irradiance and volcanoes. However, palaeoclimatic reconstructions show that the climate has frequently varied on 100-year time scales during the Holocene (last 10 kyr) by amounts comparable to the present warming - and yet the mechanism or mechanisms are not understood. Some of these reconstructions show clear associations with solar variability, which is recorded in the light radio-isotope archives that measure past variations of cosmic ray intensity. However, despite the increasing evidence of its importance, solar-climate variability is likely to remain controversial until a physical mechanism is established."
|
||||||||||||
|
||||||||||||
|
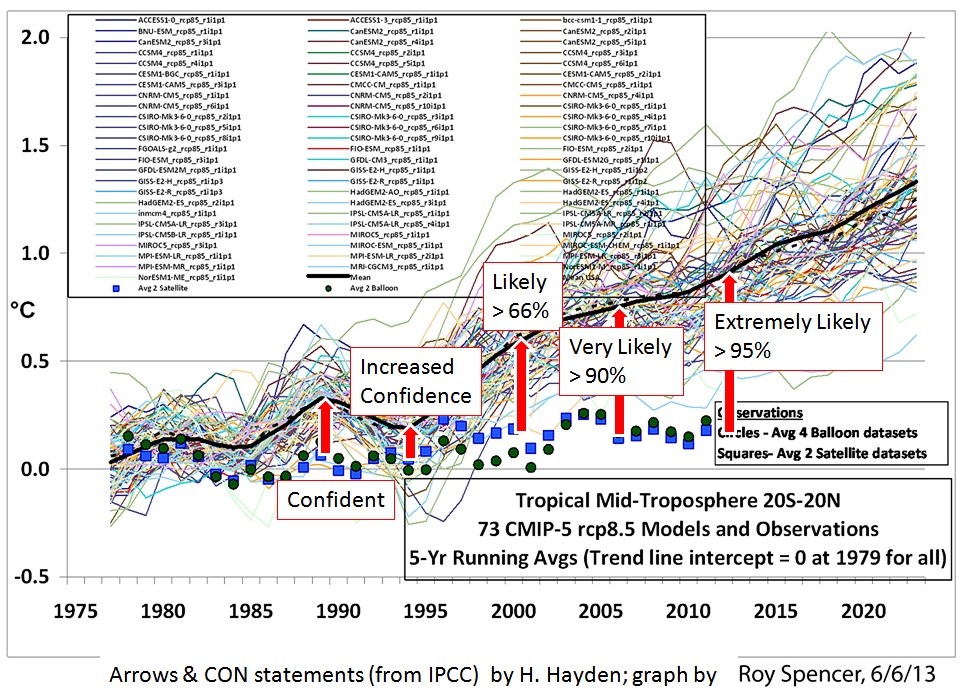
de Panik-Küche en Panic laboratory fr Marmite alarmiste ▶ Alarmisten-Prognose 2008: "Erderwärmung macht zehn Jahre Pause" ▶IPCC-Szenarien, Prognosen oder Science Fiction? ▶Das CO₂ steigt und die Temperaturen fallen ▶Der fehlende Hotspot (warme Zone) ▶Tropen: Falsche Resultate der Panik‑-Modelle ▶Panik-Modelle können die Zunahme des antarktischen Meereises nicht erklären |
|
|||||||||||
|
||||||||||||
|
Phil Jones 2010: Keine globale Erwärmung seit 1995
|
||||||||||||
|
Treibhausgase: Die Welt wird grüner |
||||||||||||
|
||||||||||||
|
||||||||||||
|
Probleme des IPCC Intergovernmental Panel on Climate Change
|
||||||||||||
Sommer 2018
en Summer 2018
fr Été 2018
-
Basler Zeitung / Martin A. Senn
2018-08-16 de Wenn das Denken baden gehtIm Zuge der Klima-Hysterie ist zu befürchten, dass noch vor den Gletschern das menschliche Denken den Hitzetod stirbt.
Bei 23 Grad Celsius, habe ich gelesen, sei die Denkfähigkeit der Leute am besten, dann nehme sie ziemlich rasch ab, und ab 27 Grad sacke sie regelrecht zusammen.
Nun ist es mit Studien zwar so eine Sache, aber diese liess sich ja in den letzten Wochen quasi in Echtzeit verifizieren.
Und was der Hitzesommer an intellektuellen Sonderleistungen hervorgebracht hat, schien den Befund der Studie glasklar zu belegen, ja es nährte gar die Befürchtung, dass noch vor den Gletschern das menschliche Denken den Hitzetod sterben könnte.
de Panik-Küche en Panic laboratory fr Marmite alarmiste
-
ntv
2018-07-30 de "Bestätigt" den Klimawandel: Für Latif ist Sommerhitze "außergewöhnlich"Mehr als 30 Grad und das seit Tagen:
Deutschland ächzt unter einer Hitzeperiode.
Für den Wissenschaftler und Klimaforscher Mojib Latif ist sie erst der Anfang: "Wir erleben immer mehr Hitzetage mit 30 Grad oder mehr."Die derzeitige Hitzewelle ist nach Auffassung des Wissenschaftlers Mojib Latif "außergewöhnlich, weil sie schon so lange anhält".
Es bestätige sich "mehr und mehr, was wir Klimaforscher lange vorausgesagt haben",
und zwar mit Blick auf den Klimawandel in Deutschland,
sagte der Meteorologe und Professor am Kieler Helmholtz-Zentrum für Ozeanforschung der "Passauer Neuen Presse"."Seit Beginn der Messungen hat sich die durchschnittliche Temperatur um 1,4 Grad erhöht.
Das ist mehr als im globalen Durchschnitt", erklärte Latif.
"Die Sommerhitze nimmt zu.
Wir erleben immer mehr Hitzetage mit 30 Grad oder mehr. Zugleich nimmt die Zahl der Tropennächte zu, in denen die Temperatur nicht mehr unter 20 Grad fällt."
Zugleich nehme die Zahl der Frosttage in Deutschland immer weiter ab.
"Das ist ein offensichtlicher Trend."
Kurzfristig lasse sich diese Entwicklung nicht aufhalten, sagte der Kieler Klimaforscher und betonte: "Die internationale Politik tut zu wenig, steuert nicht konsequent um. Der weltweite CO2-Ausstoß steigt immer weiter an, die Erderwärmung nimmt immer weiter zu."
Auch die Bundesregierung tue "zu wenig und wird ihrer Verantwortung nicht gerecht".
So habe beispielsweise die Automobilindustrie "die Selbstverpflichtungen zum Klimaschutz und zum Schadstoffausstoß nie eingehalten".
Latif bedauerte: "Diese kurzfristigen wirtschaftlichen Interessen dominieren die langfristigen Interessen der Umwelt und des Landes.
Je länger wir zögern und nichts tun, desto gefährlicher wird es."
▶Prognosen von Prof. Mojib Latif
▶
![]() Rückkehr der Sintflut: Schellnhuber, Latif, Rahmstorff
Rückkehr der Sintflut: Schellnhuber, Latif, Rahmstorff
| Mojib Latif |
Dr. rer. nat.,
Professor für Meteorologie am Leibniz-Institut für
Meereswissenschaften (IFM-GEOMAR) an der Universität Kiel.
▶Mojib Latif: Who is who (Aktivisten der anthropogenen Erwärmung) |
de Panik-Küche en Panic laboratory fr Marmite alarmiste
-
Die kalte Sonne (Fritz Vahrenholt & Sebastian Lüning)
2018-08-15 de Dürregeschichte Mitteleuropas: Klimaforscher Christian Pfister mit unerklärlichen GedächtnislückenAm 2. August 2018 brachte SRF ein längeres Radiointerview mit dem bekannten Berner Klima-Historiker Christian Pfister zur diesjährigen langen Dürreperiode in Mitteleuropa.
Pfister bezeichnet das Dürrejahr 1540 als Ausreißer, während die Dürre 2018 die zukünftige Norm darstellen könnte.
Eine steile These.
Zumal sie dem widerspricht, was der heute emeritierte Klimahistoriker Pfister noch im Jahr 2000 selber feststellte (pdf hier).
Dürresommer im Schweizer Mittelland seit 1525
Eine seltsame Gedächtnislücke.
Im Fazit der Arbeit lesen wir doch tatsächlich, dass beim Vergleich des Zeitraums von 1525 bis 2000 die häufigsten Dürren in Mitteleuropa während des Maunder-Minimum im 17. Jahrhundert auftraten und am wenigsten im 20. Jahrhundert:
...
Schussfolgerung
Man reibt sich verwundert die Augen.
Was passiert hier genau?
Will oder kann sich Pfister nicht mehr erinnern?
War alles falsch, was er früher gemacht hat?
Steht er lieber auf der Seite der vermeintlich Guten und verbiegt zu diesem Zweck sogar die Realitäten?
| SRF |
Schweizer Radio und Fernsehen
▶SRF: Who is who (Medien der Globalen Erwärmung) |
| de | en | fr |
|---|---|---|
|
Wetterphänomene Dürreperioden |
Weather phenomena Periods of Droughts |
Phénomènes météorologiques Periodes de sécheresses |
| de | en | fr |
|---|---|---|
|
Wetterphänomene Hitzewellen |
Weather phenomena Heat Waves |
Phénomènes météorologiques Canicules |
de Panik-Küche en Panic laboratory fr Marmite alarmiste
-
Tages-Anzeiger / Linus Schöpfer Redaktor Kultur
2018-08-11 de Wissenschaft vs. SVP«Von der Realität überholt», «schlicht falsch»: Klimaforscher kritisieren das Umweltprogramm der Volkspartei scharf.
Knutti bemängelt faktische Fehler.
Etwa die Aussage der SVP, seit 2005 habe es abgekühlt. Dieser «Mythos der Klimapause» sei schon lange widerlegt.
Die Behauptung, «dass in diesem Jahrhundert keine Klimaerwärmung stattgefunden und das Meer sich sogar abgekühlt hat», sei, so der ETH-Wissenschaftler, «schlicht falsch».
Knutti verweist auf den Stand der Forschung. Diesem zufolge sei der Mensch mit einer Wahrscheinlichkeit «von mehr als 95 Prozent der Hauptverursacher der globalen Erwärmung seit 1950».
Und die SVP?
Das Generalsekretariat erklärt, man überarbeite derzeit das Parteiprogramm, somit auch die klimapolitischen Positionen.
Deshalb wolle man die Beanstandungen der Forscher nicht kommentieren.
Der Clinch zwischen Wissenschaft und Volkspartei dürfte jedenfalls weiterbestehen:
Mit «Überraschungen» sei im neuen Papier nicht zu rechnen, so das Sekretariat.
| Reto Knutti |
Professor, Dr., Institut für Atmosphäre und Klima, ETH Zürich
Er erforscht den Einfluss des Menschen auf das Klimasystem.
Er ist Hauptautor des Berichts des Uno-Klimarats IPCC, der
2013 erschien.
▶Reto Knutti: Who is who (Anthropogene Globale Erwärmung) ▶Reto Knutti: Wikipedia (Profiteure) |
| de | en | fr |
|---|---|---|
| Neuste Informationen über den Klimawandel | News on Climate Change | Nouvelles informations sur le changement climatique |
| Die Erwärmungspause | The Hiatus | La pause du réchauffement climatique |
▶
SVP Schweiz: Für eine Klimapolitik mit Augenmass
L'UDC demande le retour à la raison en politique climatique
| TA |
Tages-Anzeiger
▶Tages-Anzeiger (Presse) ▶TA: Who is who (Medien der Globalen Erwärmung) |
de Panik-Küche en Panic laboratory fr Marmite alarmiste
-
2018-08-14 de
 Harald Lesch bei Markus Lanz, 14.08.2018
-
EIKE Europäisches Institut für Klima und Energie
Stefan Kämpfe
2018-08-17 de Die Irrungen und Halbwahrheiten des ZDF-Fernsehprofessors Harald Lesch - eine Richtigstellung aus meteorologischer SichtDas am 14.08.2018 gesendete Interview von Herrn Lesch enthielt aus meteorologischer Sicht zahlreiche Irrungen und Halbwahrheiten, welche einer Klarstellung bedürfen.
Es wird nur auf die schlimmsten Fehler eingegangen; die Aussagen des Herrn Lesch sind sinngemäß wiedergegeben.
"Noch nie gab es im Sommer Brände diesen Ausmaßes in Deutschland, wie im Sommer 2018".
Das ist falsch- Ältere erinnern sich vielleicht an die verheerenden Brände in der Lüneburger Heide im Dürre-Sommer 1975.
Es brannten etwa 8.000 Hektar Wald. Näheres dazu hier bei Wikipedia.
Und sommerliche Dürren gab es schon immer.
Ältere erinnern sich sicher noch an 1911, 1947, 1959, 1975, 1976 und 1982.
Im Sommer 1969 blieb der Regen in Südschweden zwei Monate gänzlich aus.
Starkregen
"Das Wort Starkregen gibt es im Deutschen noch nicht lange.
90-jährige können sich an so was gar nicht erinnern."Da hätte ein Blick in ältere Aufzeichnungen gewiss geholfen - schwerste Sommer-Überschwemmungen in Deutschland gab es beispielsweise im Juli 1954.
Und auch lokale Ereignisse durch Unwetter traten leider immer wieder auf, so in Bruchstedt/Thüringen 1950, Näheres dazu hier.
Auch in früheren Jahrhunderten traten sie auf, und zwar viel schlimmer als die 2018er Ereignisse, man denke nur an die "Thüringer Sintflut" von Ende Mai 1613 hier und die vermutlich schwerste Naturkatastrophe Deutschlands, das Sommerhochwasser von 1342 hier.
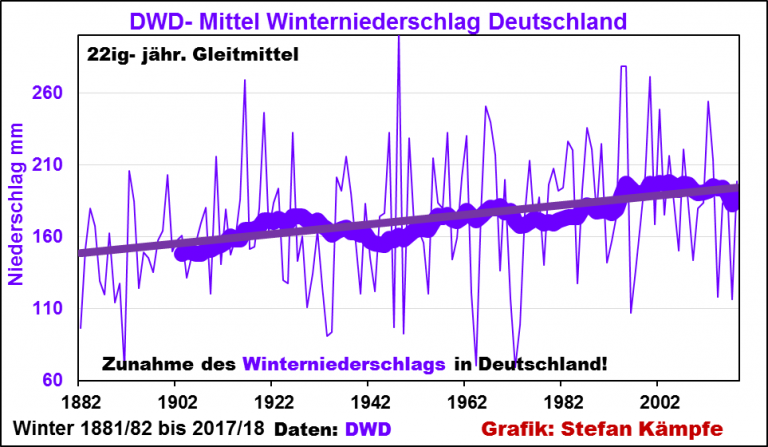
"Wenn die Winter immer trockenen werden... dann bleibt das Grundwasser zu niedrig... ."
Der Langfristtrend der DWD-Niederschlagswerte (Flächenmittel Deutschland) zeigt eindeutig das Gegenteil - unsere Winter werden feuchter:
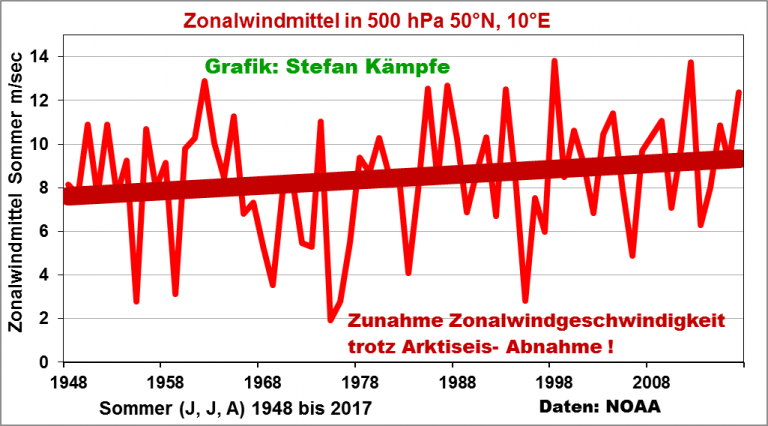
"Je wärmer die Arktis wird, desto instabiler wird der Jetstream... .
Dadurch kommt es unter anderem zu heißeren, extremeren Sommern."Das ist eine der ganz wenigen Aussagen des Herrn Lesch mit einem gewissen Wahrheitsgehalt.
Allerdings fehlen auch hierfür eindeutige Beweise, denn der Jetstream wird auch sehr stark von anderen Faktoren, wie etwa der Sonnenaktivität oder Vulkanausbrüchen, beeinflusst.
Die Datenlage hierfür ist dünn; der Zonalwind über Deutschland in der Mittleren Troposphäre (500hPa), welcher zumindest ein grobes Maß für die Stärke der Westwind-Zirkulation über Deutschland ist, wehte seit Aufzeichnungsbeginn (1948) sogar stärker;
eigentlich müsste er bei schwindendem Arktiseis schwächer werden:
Auf der Nordhalbkugel ist es zurzeit ungewöhnlich heiß... ."
Es ist, gemessen am Langjährigen Mittel, im Juli auf der Nordhalbkugel um etwa 0,4 bis 0,5 Kelvin (entspricht 0,4 bis 0,5°C) zu warm gewesen
dramatisch ist das nicht, wie ein Vergleich mit dem Juli 1994 zeigt.
(Bildquellen: IRI International Research Institute, siehe Artikel)
Und dass es im März 2018 in großen Regionen der Nordhalbkugel markant zu kalt war, erwähnt Herr Lesch lieber nicht;
auch hierzu die Karte im Artikel (Die Anomalien beziehen sich bei allen 3 Abbildungen auf die Mittelwerte der Normalperiode 1971 bis 2000):
"Die Nutzung der Windenergie ist noch lange nicht ausgeschöpft... ."
Das könnte falsch sein.
Untersuchungen zeigen, dass der Wind in Deutschland bereits schwächer wird;
hier eine Untersuchung mit DWD-Beaufort-Werten aus Norddeutschland:
Zum Abschluss ein Wort zu den Äußerungen über den Hurrikan OPHELIA.
Dass Hurrikane statt zur Karibik Richtung Europa ziehen; kommt immer mal wieder gelegentlich vor; wer alte Wetterkarten sichtet, wird fündig.
Eine "Hitzewelle", wie in dem Interview behauptet, löste OHELIA zumindest in Deutschland nicht aus - denn es war schon Oktober.
(Über den Lebenszyklus des Hurrikans OPHELIA gibt es hier beim EIKE eine gute Dokumentation).
Und dass es da noch mal so um 25 Grad warm wurde, hatte mit der großräumigen Zirkulation zu tun - übrigens kann es immer mal bei uns im Oktober nochmals sommerlich warm werden -
wer sucht, wird beispielsweise 2001, 1995 und 1985 fündig.
Und gibt es immer mehr schwere Wirbelstürme?
Die letzte Grafik zeigt keine Zunahme:
Übrigens - nach der intensiven 2017er Hurrikan-Saison wird eine sehr schwache 2018er Saison erwartet -
Grund sind unter anderem negative Wassertemperaturen im tropischen Nordatlantik.
Wieder einmal zeigt sich: ZDF bedeutet "Zwangsgebührenfinanzierte, desinformierende Falschmelder"
armes Deutschland, wenn Du dafür auch noch Gebühren zahlen musst.
| ZDF |
Zweites Deutsches Fernsehen
▶ZDF: Who is who (Medien der Globalen Erwärmung) |
▶
![]() Harald Lesch: Übrigens zur Klimakatastrophe
Harald Lesch: Übrigens zur Klimakatastrophe
| Harald Lesch |
Astrophysiker, Naturphilosoph, Wissenschaftsjournalist, Fernsehmoderator, Professor für Physik an der LMU München Lehrbeauftragter für Naturphilosophie an der Hochschule für Philosophie München. ▶Harald Lesch: Who is who (Aktivist der anthropogenen Globalen Erwärmung) ▶Harald Lesch: Wikipedia (Profiteure) |
de Fakten en Facts fr Faits
-
EIKE Europäisches Institut für Klima und Energie
Stefan Kämpfe
2018-08-01 de Juli 2018 in Deutschland - kein neuer RekordmonatAuch wenn dieser Juli 2018 vielen rekordverdächtig vorkam - er schaffte es nicht, den bisherigen Rekordhalter von 2006 auch nur annähernd zu gefährden.
Der Titel des "Vizemeisters" bleibt weiterhin dem 1994er Juli erhalten; Platz 3 belegt der Juli 1983.
Dieser Juli war speziell im letzten Monatsdrittel von Hitzewellen geprägt, weil es Ableger des Azorenhochs immer wieder schafften, sich nach Mittel- und Nordeuropa auszubreiten;
zeitweise entwickelten sich daraus kräftige Skandinavien-Hochs.
Dieser Umstand erklärt auch, warum es in diesem Monat, trotz meist positiver NAO- Werte, kaum feucht-kühles "Westwetter" gab.

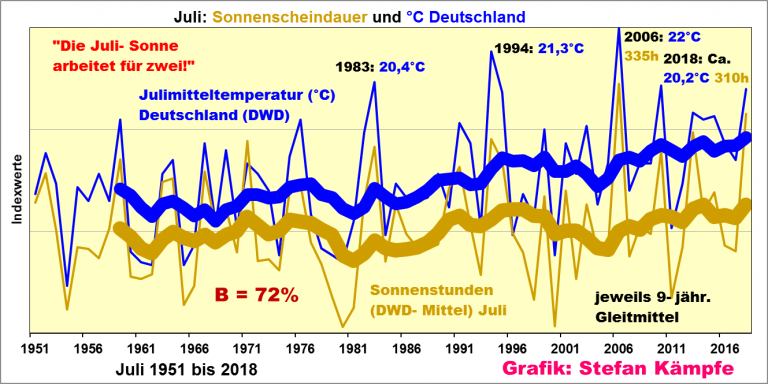
 Enge "Verzahnung" von Sonnenscheindauer und Temperatur.
Sonnige Juli- Monate sind stets warm;
die Sonnenscheindauer vermag mehr als 70% der Temperaturvariabilität seit 1951 zu erklären;
in keinem anderen Monat besteht ein derart enger Zusammenhang.
Zusammenfassung
Der 2018er Juli war dank einer hohen Sonnenscheindauer und vieler Hochdruckwetterlagen sehr warm, ohne es unter die drei wärmsten Juli-Monate in Deutschland seit Aufzeichnungsbeginn zu schaffen.
Auch langfristig lässt sich nahezu die gesamte Juli- Erwärmung in Deutschland mit geänderten Großwetterlagenhäufigkeiten und einer längeren Sonnenscheindauer erklären; hinzu kommen wachsende Wärmeinseleffekte, auf welche hier nicht näher eingegangen wird.
| EIKE |
Europäisches Institut für Klima und Energie European Institute for Climate and Energy ▶EIKE: Who is who (Skeptische Institute & Organisationen) ▶EIKE: Wikipedia (Opfer) ▶EIKE: Webseiten (Deutsch) |
-
Die kalte Sonne (Fritz Vahrenholt & Sebastian Lüning)
2018-08-11 de Deutschland hat kein Hitzeproblem - sondern ein HysterieproblemDie Hitzewelle ist in den meisten Teilen Deutschlands jetzt erstmal abgehakt.
Es war ein wahres Fest für alle Aktivisten.
Bei allem Warnen, Drohen und Qungeln vergaßen sie doch glatt, dass Klima das durchschnittliche Wetter von 30 Jahren ist.
Das war nun plötzlich ganz egal.
Es war heiß, da wollte man sich mit diesem dummen Ballast nicht mehr abgeben:
Die Hitze sei ein Vorbote der Hölle, in die alle Klimaalarm-Ungläubigen schnellstmöglich gelangen, wenn sie nicht die Forderungen der Klima-Gottheiten umgehend erfüllen.
Sonst drohe der Weltuntergang.
Zum Glück gab es in der Berichterstattung auch wenige Ausnahmen.
Zum eine wäre da Jörg Kachelmann am 3. August 2018 bei den t-online-Nachrichten:
Kachelmanns Donnerwetter: Kein Sommermärchen
Deutschland hat Angst vorm Klimawandel - und vor Ventilatoren.
Während im Winter die nächste Klimakatastrophe droht, tut die Regierung nichts.
Weil sie die vielen "Dummen" nicht verprellen will.
Manchmal bestimmt Mesut Özil nicht nur die Medienagenda für ein paar Tage, sondern für einen Sommer.
Natürlich nicht er alleine, sondern "Die Mannschaft".
Man kann das wunderbar vergleichen mit 2006.
Damals war der Juli noch mal zwei Grad wärmer als der Juli 2018, also noch mal 50 Prozent weiter über dem Durchschnitt,
aber das, was de facto viel schlimmer war als heute, war damals keine böse Hitzewelle, die alles kaputtmachte, sondern ein WM-Sommertraum oder meist das legendäre "Sommermärchen".
Der zweite Lichtblick zum Thema stammt von Torsten Krauel, der am 8. August 2018 in der Welt schrieb:
Deutschland hat kein Hitzeproblem - sondern ein Hysterieproblem
Sahara-Sommer?
Esst vegan, oder es kommt der Weltuntergang?
Von wegen.
Heiße Sommer hat es viele gegeben, regnerisch-kühle genauso. Deutschland hat kein Hitzeproblem, das zeigt ein Blick in die Vergangenheit.Deutscher Saharasommer 2018!
Glühende Landschaften!
Wer so etwa schreibt, war nie in der Sahara.36 Grad bei nur 55 oder 60 Prozent Luftfeuchtigkeit?
Das wäre in etlichen Weltregionen ein angenehm trockener Erholungstag.Um die 40 Grad bei 95 Prozent Luftfeuchte sind in weiten Teilen Chinas die Regel.
 Weiterlesen in der Welt: Deutschland hat kein Hitzeproblem -
sondern ein Hysterieproblem
Danke Herr Kachelmann, Danke Herr Krauel.
Sie sprechen das aus, was viele nur insgeheim denken.
Es ist wichtig, dass man in dieser politisierten Materie mitdenkt und sein Meinung kundtut, ansonsten glaubt die Alarmfraktion, die Nation prächtig geleimt zu haben.
| Die kalte Sonne | Die kalte Sonne (Fritz Vahrenholt & Sebastian Lüning) |
Positionspapier der SVP 2009:
Für eine Klimapolitik mit Augenmass
fr
Document de fond de l'UDC Suisse 2009:
Retour au bon sens en politique climatique
-
de
 Für eine Klimapolitik mit Augenmass
Aus der Zusammenfassung:
Seit jeher ist das Klima auf der Erde Veränderungen unterworfen.
Heute gemessene Entwicklungen stellen daher keine neue Erscheinung dar.Im Verlauf des 20. Jahrhunderts sind die weltweiten Durchschnittstemperaturen um ungefähr 0.6 °C angestiegen.
Seit dem Jahr 1998 hat es weltweit keine Erwärmung mehr gegeben, seit 2005 kühlte es gar ab. In der Arktis, wo heutzutage das Schmelzen gewisser Eisgebiete mit grossem Medienspektakel verfolgt wird, hat bereits zwischen 1925 und 1945 eine ähnlich warme Periode wie heute geherrscht.
Auch in der Schweiz wurde das bisher wärmste Jahr 1994 seit nunmehr über einem Jahrzehnt nicht mehr übertroffen.
Man kann somit keinesfalls von einem kontinuierlichen, starken Anstieg der Temperaturen sprechen.
Die SVP fordert:
-
Das Kyoto-Protokoll regelt die weltweiten Bemühungen zur Senkung des CO2- Ausstosses bis zum Jahr 2010.
Nimmt man die volle Periode hinzu, welche für das Erreichen des Ziels massgebend ist, entfaltet das Kyoto-Protokoll bis spätestens 2012 Wirkung.
Das CO2-Gesetz dient der nationalen Umsetzung des Kyoto-Protokolls.
Es macht keinen Sinn, dass die Schweiz ohne internationale Abstützung dieses Gesetz weiterhin behält.
Wie oben dargelegt, ist die Schweiz nur für 0.1 % der weltweiten menschengemachten CO2-Emissionen verantwortlich und allein der jährliche Anstieg der chinesischen Emissionen übersteigt die schweizerischen Emissionen um ein Vielfaches.
In dieser Situation ist es absolut widersinnig, ohne internationale Abstützung weitere Reduktionsbemühungen zu unternehmen.
Das CO2-Gesetz ist deshalb per Ende 2010, spätestens per Ende 2012 aufzuheben.
Entsprechend ist auf die Erhebung der CO2-Abgabe nach 2010 bzw. 2012 zu verzichten.
-
Entsprechend der baldigen Beendigung der Fristen des Kyoto-Prozesses darf keine Teilzweckbindung eingeführt werden. Dies würde neue Abhängigkeiten schaffen und die bei einer Subventionierung üblichen Marktverzerrungen hervorrufen.
Gerade in der aktuellen Situation einer sich anbahnenden Wirtschaftskrise wäre es genau das Falsche, den Steuerzahlern noch mehr Geld aus der Tasche zu ziehen und die Kaufkraft von Privathaushalten und Unternehmungen zu schwächen.
Die SVP fordert, dass das Versprechen von Bundesrat und Parlament, die Erträge der CO2-Abgabe den Steuerzahlern zurückzuerstatten, auch wirklich eingehalten wird.
-
Das Versprechen, die CO2-Abgabe staatsquotenneutral zu realisieren, wurde bereits durch die Unterstellung dieser Abgabe unter die Mehrwertsteuerpflicht gebrochen.
Die CO2-Abgabe ist umgehend von der Mehrwertsteuer zu befreien.
Die jährlich 18 Millionen Franken, welche den Steuerzahlern damit aus der Tasche gezogen werden, sind zurückzuerstatten.
-
SVP - Schweizerische Volkspartei
Pressekonferenz vom 24. Februar 2009
Ideologie und Angstmacherei prägt nach wie vor die Klimadiskussion.
Wie damals beim Waldsterben überbieten sich Politiker von Links bis Rechts mit oftmals realitätsfremden Forderungen zu staatlichen Umverteilungs- und Fördermassnahmen.
Die SVP fordert eine Rückkehr zur Vernunft.
Ein neues internationales Klima-Abkommen darf es nur geben, wenn alle Länder mit grossem CO2-Ausstoss an Bord sind.
Die SVP erhebt folgende klimapolitischen Forderungen:
-
Aufhebung des CO2-Gesetzes zum Zeitpunkt der Beendigung der vom Kyoto-Protokoll geregelten Periode (2010, spätestens 2012).
-
Bis dahin Beibehaltung der vollständigen Rückgabe der CO2-Abgabe an die Steuerzahler und Verzicht auf die Einführung einer Teilzweckbindung.
-
Keine Beteiligung der Schweiz an einem Nachfolge-Protokoll, wenn sich nicht sämtliche Grossemittenten zu Begrenzungen verpflichten.
-
Keine nationale Regelung, welche weitergeht als die internationalen Verpflichtungen.
SVP - Schweizerische Volkspartei
Videos vom 25. Februar 2009
-
2009-02-25 de
 SVP fordert Klimapolitik mit Augenmass
-
2009-02-25 fr
 L'UDC demande le retour à la raison en politique climatique
Ideologie und Angstmacherei prägt nach wie vor die Klimadiskussion.
Wie damals beim Waldsterben überbieten sich Politiker von Links bis Rechts mit oftmals realitätsfremden Forderungen zu staatlichen Umverteilungs- und Fördermassnahmen.
Die SVP fordert eine Rückkehr zur Vernunft.
Ein neues internationales Klima-Abkommen darf es nur geben, wenn alle Länder mit grossem CO2-Ausstoss an Bord sind.
▶
SVP Schweiz: Für eine Klimapolitik mit Augenmass
L'UDC demande le retour à la raison en politique climatique
| SVP / UDC |
SVP - Schweizerische Volkspartei SVP - Swiss People's Party UDC - Union démocratique du centre |
NZZ: Trinkwasser ist im Kanton Zürich
Trotz Trockenheit wäre es gar nicht nötig, Wasser zu sparen
-
NZZ Neue Zürcher Zeitung / Jan Hudec
2018-08-07 de Trotz Trockenheit wäre es gar nicht nötig, Wasser zu sparenTrinkwasser ist im Kanton Zürich trotz Trockenheit in Hülle und Fülle vorhanden - man muss es nur richtig verteilen.
Dafür sorgt der kantonale Trinkwasserverbund.
Doch noch sind nicht alle Gemeinden an das Netz angeschlossen.
100 Schwimmbecken pro Tag
Rund 380 Millionen Liter Trinkwasser, also der Inhalt von 100 Olympia-Schwimmbecken, werden im Kanton Zürich täglich verbraucht -
pro Person entspricht dies über 250 Litern.
An Spitzentagen kann der Verbrauch aber bis auf über 600 Millionen Liter ansteigen.
Das System ist damit bei weitem nicht ausgereizt.
Mit den 700 Reservoirs im Kanton können pro Tag 800 Millionen Liter bereitgestellt werden.
Es handelt sich also eher um ein Verteil- als ein Mengenproblem, denn nicht alle Regionen sind gleichermassen mit grossen Wasservorkommen gesegnet.
| de | en | fr |
|---|---|---|
| Wasser, Land, Nahrung Wasser |
Water, Land, Food Water |
Eau, terre, nourrit Eau |
| Wassermangel | ||
-
Zürichsee-Zeitung / Martin Steinegger
2015-05-08 de Der Tag, an dem es einen ganzen Zürichsee regneteWie viel Wasser kann es in der Schweiz an einem Tag regnen?
Meteoschweiz gibt in einem aktuellen Blogbeitrag dazu die Antwort:
Einmal den ganzen Zürichsee.Der regenreichste Tag seit 1961 war der 7. August 1978.
An diesem Tag fielen gemäss der Berechnung von Meteoschweiz 3,6 km3 (Kubikkilometer) Wasser.
Das entspricht 3,6 Milliarden Kubikmeter. Oder anders umgerechnet:
es entspricht ziemlich genau dem Wasservolumen des Zürichsees, der etwa 3,9 Kubikkilometer fasst.Güterzug, 16-Mal um die Erde gewickelt
In der Schweiz kann es also an einem Tag einen ganzen Zürichsee regnen. Meteoschweiz bietet dazu eine anschauliche Umrechnung:
Würde man diese Wassermenge auf Kesselwagen der SBB verteilen, die 85000 Liter fassen und gut 15 Meter lang sind, benötigte man rund 42 Millionen Wagen.Aneinandergereiht würden diese einen 640000 Kilometer langen Zug bilden.
Diesen könnte man 16-Mal um die Erde «wickeln».
Auf Rang zwei der niederschlagsreichsten Tage folgen übrigens der 21. Dezember 1991 und der 8. August 2007.
An diesen beiden Tagen fielen aber gemäss Meteoschweiz deutlich geringere Wassermengen.
Oder anders ausgedrückte: es regnete keinen ganzen Zürichsee - sondern eher einen Walensee.
| de | en | fr |
|---|---|---|
|
Wetterphänomene Wassermenge |
Weather phenomena Water amount |
Phénomènes météorologiques Débit d'eau |
Prof. Dr. Werner Kirstein sagt Claus Kleber die Meinung
-
Prof. Dr. Werner Kirstein
2018-08-06 de Klimatologe sagt Claus Kleber die Meinung
Der Klimatologe und Physiker Prof. Dr. Werner Kirstein richtete am 04.08.2018 eine Mail an Claus Kleber vom 'heute-journal' im Zweiten, bzgl. des Beitrages
"Trockener Sommer: Woher kommt die Hitze?"
in der heute-journal-Sendung vom 03.08.2018.
Hier nach besagtem Beitrag aus der Sendung, verlesen.
Sehr aufschlussreich.
Quelle/Source:
-
EIKE Europäisches Institut für Klima und Energie
2018-08-07 de Dr. Claus Kleber (ZDF heute Journal 3.8.18): ".. sich die Atmophäre 'grundstürzend' ändert!"Am 3.8.18 brachte das ZDF im heute Journal angekündigt von seinem Moderator, dem bekannten Klimakatastrophenprediger und Sachbuchautor in nämlicher Sache, Dr. Claus Kleber einen Beitrag zur Hitzeperiode dieses Sommers.
Der Physiker und Klimatologe Prof. Dr. Werner Kirstein fühlte sich bemüßigt, diese permanent wiederholte Klimaktastrophenmeldung, diesmal
sogar als mögliche "grundstürzenden" Änderung der Atmosphäre angekündigt
zu widerlegen mehr Objektivität und Sachlichkeit anzumahnen. Wohl wissend, dass diese beiden Begriffe für das ZDF und Claus Kleber lästige Fremdworte sind.
Schauen und lesen Sie selbst
▶
![]() Prof. Dr. Werner Kirstein: Erdklima vs. Klimapolitik
Prof. Dr. Werner Kirstein: Erdklima vs. Klimapolitik
| Werner Kirstein |
Prof. Dr.
▶Werner Kirstein: Who is who (Skeptiker) ▶Werner Kirstein: Video (Präsentationen) ▶Ausschluss und Maulkorb für Kritiker (Uni Leipzig (Dekan Prof. Dr. Haase) ⬌ Prof. Dr. W. Kirstein) |
| ZDF |
Zweites Deutsches Fernsehen
▶ZDF: Who is who (Medien der Globalen Erwärmung) |
de
Die jahrelange beispiellose Hitze- und Dürreperiode in Europa um 1540
en
The year-long unprecedented European heat and drought of 1540
-
EIKE Europäisches Institut für Klima und Energie
Oliver Wetter, Christian Pfister, Johannes P. Werner, Eduardo Zorita und weitere
2018-08-04 de Die jahrelange beispiellose Hitze- und Dürreperiode in Europa um 1540 - ein Worst CaseAbstract
Die Hitzewellen der Jahre 2003 in Westeuropa und 2010 in Russland, welche allgemein als seltene klimatische Anomalien außerhalb bisheriger Erfahrungen apostrophiert werden, werden oftmals als Warnungen vor noch häufigeren Extremen in einer von der globalen Erwärmung beeinflussten Zukunft herangezogen.
Eine neue Rekonstruktion der Temperaturen in Westeuropa im Frühjahr und Sommer zeigt jedoch, dass es im Jahre 1540 signifikant höhere Temperaturen gegeben haben muss.
Um die Plausibilität dieses Ergebnisses zu überprüfen, untersuchten wir die Schwere der Dürre 1540, indem wir das Argument der bekannten Rückkopplung zwischen Austrocknung des Bodens und Temperatur untersuchten.
Quelle/Source:
-
Springer Nature
Oliver Wetter, Christian Pfister, Johannes P. Werner, Eduardo Zorita and others
2018-06-28 en The year-long unprecedented European heat and drought of 1540 - a worst caseAbstract
The heat waves of 2003 in Western Europe and 2010 in Russia, commonly labelled as rare climatic anomalies outside of previous experience, are often taken as harbingers of more frequent extremes in the global warming-influenced future.
However, a recent reconstruction of spring-summer temperatures for WE resulted in the likelihood of significantly higher temperatures in 1540.
In order to check the plausibility of this result we investigated the severity of the 1540 drought by putting forward the argument of the known soil desiccation-temperature feedback.
Based on more than 300 first-hand documentary weather report sources originating from an area of 2 to 3 million km2, we show that Europe was affected by an unprecedented 11-month-long Megadrought.
The estimated number of precipitation days and precipitation amount for Central and Western Europe in 1540 is significantly lower than the 100-year minima of the instrumental measurement period for spring, summer and autumn.
This result is supported by independent documentary evidence about extremely low river flows and Europe-wide wild-, forest- and settlement fires.
We found that an event of this severity cannot be simulated by state-of-the-art climate models.
Wie ungewöhnlich ist die aktuelle Trockenperiode?
-
EIKE Europäisches Institut für Klima und Energie
Prof. Dr. Horst-Joachim Lüdecke
2018-08-08 de Wie ungewöhnlich ist die aktuelle Trockenperiode?Kaum spielt das Wetter wieder einmal Kapriolen, kreisen auch schon die Krähen des Untergangs über unseren Häuptern und fordern CO2-Buße.
Ein nüchterner Blick auf die Daten beweist dagegen nur Eines:
"Das Gewöhnliche am Wetter ist seine Ungewöhnlichkeit".

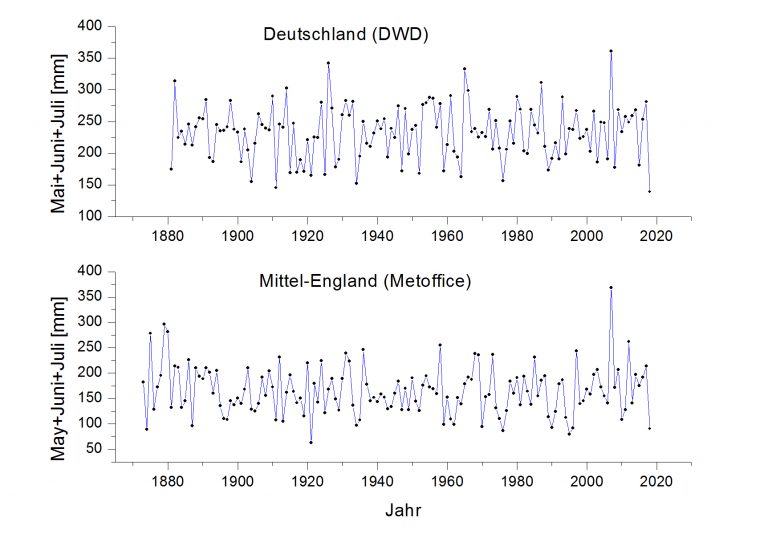
 Summe der Niederschlagsmengen von Mai+Juni+Juli für Deutschland
und Mittelengland
Was ist zu sehen?
Jedenfalls kein säkularer Trend, wie er seitens des IPCC durch den angestiegenen CO2-Gehalt in der Luft vermutet wird.
Wir sehen Wetterereignisse (zur Erinnerung: Klima ist definiert als der statistischen Mittelwert von Wetter über mindestens 30 Jahre).
Der Summenregenwert Mai+Juni+Juli von Deutschland in 2018 ist tatsächlich ein Wetterrekord, wenn auch nur knapp. Seine 139,4 mm Regensumme in 2018 unterbieten die 145,7 mm in 1911 nur geringfügig.
| de | en | fr |
|---|---|---|
|
Wetterphänomene Dürreperioden |
Weather phenomena Periods of Droughts |
Phénomènes météorologiques Periodes de sécheresses |
Es gibt keine "globale Hitzewellen"
-
EIKE Europäisches Institut für Klima und Energie
Michael Bastasch / Andreas Demmig
2018-08-04 de Es gibt keine "globale Hitzewellen""Globale Hitzewelle" ist ein nur Schlagwort, das in Überschriften verwendet wird
Was tatsächlich zutrifft, sind Hitzewellen, die gleichzeitig in verschiedenen Teilen der Welt auftreten.
"Globale Hitzewellen ist also weder ein wissenschaftlicher Begriff noch eine gute Beschreibung dessen, was passiert", sagt Cliff Mass, ein Klimawissenschaftler an der Universität von Washington.
In letzter Zeit Sie sind wahrscheinlich auf Schlagzeilen über die "globale Hitzewelle" gestoßen, die verheerende Schäden von Japan über Europa bis nach Nordafrika anrichtet.
Falls Sie den Begriff "globale Hitzewelle" zum ersten Mal hören, sind Sie damit nicht allein.
Das liegt daran, dass es sich um einen Begriff handelt, der in hanebüchenden Schlagzeilen verwendet wird, um die Aufmerksamkeit zu steigern.
"'Global Heat Wave' scheint ein neuer Begriff zu sein, den einige Leute in den Medien- und Klima-Lobbygruppen erfunden haben", sagte Cliff Mass, ein Klimawissenschaftler an der Universität von Washington, dem Daily Caller.
Der Juli scheint über einen Großteil der nördlichen Hemisphäre hinweg glühende Hitze zu haben, einschließlich Rekordhochs in Kalifornien und Kanada.
Dreistellige Wärmegrade (in Fahrenheit 100 F = 38°C) wurden mit Todesfällen in Japan in Verbindung gebracht und brutzelnde Temperaturen trugen zu massiven Waldbränden in Skandinavien bei - Es ist mal wieder richtig Sommer.
Aber der Begriff "globale Hitzewelle" weckt Bilder von Hitzeglocken, die den gesamten Planeten kochen.
Was gemeint ist, sind Hitzewellen, die gleichzeitig in verschiedenen Teilen der Welt auftreten.
"Hitzewellen sind zwangsläufig lokalisierte Angelegenheiten, die normalerweise mit anomal hohem Luftdruck verbunden sind", sagte Mass in einer E-Mail.
"Globale Hitzewellen sind also weder ein wissenschaftlicher Begriff noch eine gute Beschreibung dessen, was passiert ist."
Auch der Klimawissenschaftler des Cato-Instituts, Ryan Maue, kritisierte Schlagzeilen, in denen von einer "globalen Hitzewelle" die Rede ist und von Wissenschaftlern, die ihre Namen für solche haarstäubenden Behauptungen zur Verfügung stellen.
Abgesehen davon, dass es Winter in der südlichen Hemisphäre ist, bemerkte Maue,
dass die Temperatur der nördlichen Hemisphäre derzeit dem Durchschnitt der letzten 18 Jahre entspricht.
Er stellte außerdem fest,
dass die Landtemperaturen der nördlichen Hemisphäre derzeit insgesamt unter dem Normalwert lagen.
| de | en | fr |
|---|---|---|
|
Wetterphänomene Hitzewellen |
Weather phenomena Heat Waves |
Phénomènes météorologiques Canicules |
Schellnhuber-Evergreen: Und ewig kippt das Klima
-
EIKE Europäisches Institut für Klima und Energie
Dirk Maxeiner
2018-08-09 de Schellnhuber-Evergreen: Und ewig kippt das KlimaSeit vielen Jahren erfindet das PIK bis vor kurzem von Hans-Joachim Schellnhuber geleitet, neue Klima-Bedrohungen, in der nicht falschen Hoffnung dass die Medien diese verstärkend aufgreifen und so die hoch lukrative Klimafurcht-Politik weiter am Leben zu halten.
Dazu gehört auch seit einigen Jahren die durch nichts gestützte Hypothese, dass das "Weltklima" durch die menschlichen CO2 Emissionen zum "kippen" gebracht werden könne.
Natürlich ins dann unvermeidbare Elend. Weltuntergang à la Schellnhuber.
Bisher war dieser apokalyptischen Weissagung nicht viel mediale Aufmerksamkeit beschieden.
Das müsse sich nun ändern befand das rührige Meidienteam.
Motto: Lasse keine (und sei sie noch so dürftig) Krise ungenutzt.
Also flugs alten Wein in neue Schläuche gegossen und an die derzeitige Hitzewelle angehängt.
Die Journos werden schon den Rest erledigen.
Dirk Maxeiner berichtet die ganze Story
-
Süddeutsche Zeitung
2018-08-06 de Studie: Klimasystem könnte in Heißzeit kippende Panik-Küche en Panic laboratory fr Marmite alarmiste
Die Gefahr einer Heißzeit kann aus Sicht von Klimaforschern selbst beim Einhalten des Pariser-Klimaabkommens nicht ausgeschlossen werden.
Dabei würde sich die Erde langfristig um etwa vier bis fünf Grad Celsius erwärmen und der Meeresspiegel um 10 bis 60 Meter ansteigen.
Das schreibt das Potsdam-Institut für Klimafolgenforschung (PIK).
Ein internationales Team von Wissenschaftlern diskutiert diese Möglichkeiten in den "Proceedings" der US-nationalen Akademie der Wissenschaften ("PNAS") und blickt dabei insbesondere auf Kippelemente im Klimasystem.
Dazu gehören laut Studie etwa die auftauenden Permafrostböden in Russland, die sich erwärmenden Methanhydrate auf dem Meeresboden und die großen Ökosysteme wie der Amazonas-Regenwald.
Sie könnten sich wie eine Reihe von Dominosteinen verhalten, sagte Mitautor Johan Rockström, Direktor des Stockholm Resilience Centre und designierter Ko-Direktor des PIK.
"Wird einer von ihnen gekippt, schiebt dieses Element die Erde auf einen weiteren Kipppunkt zu."
"Der Mensch hat als geologische Kraft bereits seine Spuren im Erdsystem hinterlassen", sagte Mitautor und PIK-Gründungsdirektor Hans Joachim Schellnhuber.
"Werden dadurch empfindliche Elemente des Erdsystems gekippt, könnte sich die Erwärmung durch Rückkoppelungseffekte selbst weiter verstärken.
Das Ergebnis wäre eine Welt, die anders ist, als alles, was wir kennen", ergänzte er.
"Die Forschung muss sich daran machen, dieses Risiko schnellstmöglich besser abzuschätzen."
Nach Angaben der Autoren könnte es schwieriger werden als bislang angenommen, die globale Erwärmung wie im Pariser Klimaabkommen vereinbart zwischen 1,5 und unter 2 Grad Celsius zu stoppen.
Man könne sich nicht darauf verlassen, dass das Erdsystem bei 2 Grad langfristig sicher "geparkt" werden könne, sagte Schellnhuber.
Derzeit ist die Erde im Durchschnitt bereits gut 1 Grad wärmer als noch vor Beginn der Industrialisierung.
Selbst bei vorläufiger Begrenzung der menschengemachten Erderwärmung auf maximal 2 Grad könnten kritische Prozesse im Klimasystem angestoßen werden, die eine noch stärkere Erwärmung - auch ohne weiteres menschliches Zutun - bewirken, erläuterte Erstautor Will Steffen von der Australian National University (ANU) und dem Stockholm Resilience Centre (SRC).
Nach PIK-Angaben könnte das bedeuten, dass sich der Klimawandel dann selbst verstärkt - "auf lange Sicht, über Jahrhunderte und vielleicht Jahrtausende".
Kippelemente im Erdsystem seien mit schweren Felsbrocken am Strand vergleichbar, erläuterte Schellnhuber.
Würden diese langsam, aber unaufhörlich unterspült, könnte irgendwann schon die Landung einer Fliege an einer neuralgischen Stelle ausreichen, um die Brocken kippen zu lassen.
"Wir weisen in unserem Artikel darauf hin, dass es im planetarischen System bereits derart unterspülte Felsbrocken gibt, die wir als Kippelemente bezeichnen.
Ist die Erderwärmung weit genug fortgeschritten, reicht vielleicht schon eine kleine Veränderung aus, um diese Elemente in einen ganz anderen Zustand zu stoßen."
In Teilen der Westantarktis seien bereits einige Kipppunkte überschritten worden. "Der Verlust des Eises in einigen Regionen könnte dort schon ein weiteres, noch umfangreicheres Abschmelzen über lange Zeiträume vorprogrammiert haben", sagte Schellnhuber.
Und der Kollaps des grönländischen Eisschildes könnte bereits bei einer Temperaturerhöhung um 2 Grad einsetzen.
"Die roten Linien für einige der Kippelemente liegen wohl genau im Pariser Korridor zwischen 1,5 und 2 Grad Erwärmung."
| de | en | fr |
|---|---|---|
|
Klima: Fragen Klima-Kipp-Punkte |
Climate: Questions Climate Tipping Points |
Climat: Questions Points de non retour dans le climat |
|
Hans-Joachim Schellnhuber *1950-06-07 |
Professor, Bis September 2018 war er Direktor des 1992 von ihm gegründeten Potsdam-Instituts für Klimafolgenforschung (PIK) ▶Hans-Joachim Schellnhuber: Who is who (Aktivisten der anthropogenen Erwärmung) |
| SZ |
Süddeutsche Zeitung
▶SZ: Who is who (Medien der Globalen Erwärmung) |
de
'Heiß-Haus Erde': Extrem fragwürdig
en
Hothouse Earth: It's extremely dodgy
-
EIKE Europäisches Institut für Klima und Energie
Dr. David Whitehouse, GWPF Science Editor / Chris Frey
2018-08-09 de 'Heiß-Haus Erde': Extrem fragwürdigKeine neue Wissenschaft, kein neues Szenario und folglich kein neuer Grund für Panik.
Es war eine lange Hitzewelle in weiten Teilen Europas, die Fragen ausgelöst hat wie "welche Rolle spielt der Klimawandel bei der diesjährigen Hitzewelle"?
Einige behaupten, dass es zweimal so oft dazu kommt, andere behaupten, dass der Klimawandel alles immer schlimmer macht.
"So sieht Klimawandel aus!", sagt Prof. Michael Mann.
Es wird das Gefühl verbreitet, dass dieser Sommer zeigt, wie es in Zukunft aussehen könnte.
"Man erwarte so etwas immer öfter!", lautet der Aufschrei.
-
The Global Warming Policy Forum (GWPF)
Dr. David Whitehouse, GWPF Science Editor
2018-08-07de Hothouse Earth: It's extremely dodgyNo new science, no new data, no new scenario and consequently no new cause for panic.
It's been a long heatwave in much of Europe which has prompted questions like 'what is the influence of climate change on this year's heatwave?'
Some claim that it's twice as likely to occur, while others claim that climate change is making it worse.
"This is the face of climate change," says Professor Michael Mann.
There is a feeling in the hot air that this summer is showing the way of the future.
'Expect this kind of thing more often', is the cry.
| de | en | fr |
|---|---|---|
| Klimawandel: Diskussionen | Climate change: Discussions | Changement climatique: Discussions |
| Hiobs-Prognosen | ||
Woher kommt die Dürre und Wärme des Sommers 2018?
-
EIKE Europäisches Institut für Klima und Energie
Hartmut Hüne
2018-08-09 de Woher kommt die Dürre und Wärme des Sommers 2018?
 Die Sonne ist mehr als die sichtbare Strahlung

Die aktuelle extreme Hitze und länger dauernde Trockenheit, die wir derzeit erleben, lässt sich gut mit ungewöhnlichen Koronaentladungen auf der Sonne erklären, meint unser Autor Hartmut Hüne und liefert auch den passenden Mechanismus dazu.
Die diesjährige Trockenheit und grosse Wärme darf man zu Recht als ein besonderes "Naturereignis" klassifizieren.
Die diesjährigen Wetterverhaeltnisse werden wirklich durch "natürliche" und nicht voraussehbare Vorgänge bewirkt.
Nämlich:
Auf der Sonne sind, wie es öfter passiert, Plasmaringe (die Zigaretten-Rauchringen in ihrer Physik als "Wirbelschlauchringe" verwandt sind ) aufgebrochen. Siehe Abb. 1

 Abb. 1 Geschlossene Plasmaringe (A) brechen auf (B)
und bewirken einen starken Parttikelstrom (Rot)
Magnetfeldlinien sind (Schwarz) dargestellt

Das wirkt so als ob man einen Wasserschlauch aufschneidet.
Aus dessen Enden spritzt dann das Wasser heraus.
Nach dem Aufbrechen der solaren Plasmaringe wird dann Materie aus den tieferen Schichten der Sonne, d. h. hochenergetische, ionisierte Teilchen (sonst Sonnenwind genannt) mit hoher Geschwindigkeit in gewaltigen Mengen ausgestoßen.
Die Röntgenaufnahmen der Sonne dieses Jahres zeigen die Enden der aufgebrochenen Plasmaschläuche dunkel, sogenannte "Koronarlöcher".

 Abb. 2 Röntgenbilder der Sonne im Frühjahr 2018 zeigen die
"Koronalen Löcher"


Meistens brechen die Plasmaringe in den Polregionen der Sonne.
Der Teilchenstrom geht dann senkrecht zur Ebene, in der die Planeten umlaufen, und trifft und beeinflusst die Planeten nicht.
Wie aber in Abb. 2 zu sehen, brachen dieses Jahr Ringe vorzugsweise in der Äquatorialregion, so dass der Teilchenstrom die Planeten, und eben auch die Erde, sozusagen "volle Breitseite" trifft.
Derzeit liegt der Teilchenstrom, der die Erde trifft, bei 600% (!!) des gewöhnlichen.
Das mit dem Teilchenstrom mitgeführte Magnetfeld von der Sonne hat das Erdmagnetfeld so gestört, dass es über dem Nordpol in Millionen von Quadratkilometern aufgerissen (d. h. sehr schwach) ist.
Das Erdmagnetfeld leitet gewöhnlich den Teilchenstrom um die Erde herum.
Da es jetzt fehlt, trifft der Teilchenstrom ungehindert die Erdatmosphäre.
Die gewaltige Energie der Sonnenwindteilchen trifft die Arktis und erwärmt diese massiv.
Weiterhin verdrängt der starke Sonnenwind die noch höher-energetische Höhenstrahlung aus dem Kosmos ("Forbush-Effekt"), welche auf Grund ihrer hohen Energie die Kondensationskeime für die Wolkenbildung stellen.
Folglich wird Wolkenbildung und Niederschlag signifikant reduziert.
Weniger Wolken, viel Sonnenschein, der die Erde erwärmt, und Ausfall von Regen.
Dies ist der Mechanismus, der das ungewöhnliche Wetter dieses Jahr unser Wetter bestimmt.
Was können wir aus dieser Einsicht lernen?
Nicht all zu viel.
Eine Voraussage, wie lange Koronarlöcher existieren werden, die in Richtung Erde emittieren, ist auf Grund unserer beschränkten Kenntnisse der Sonnenphysik nicht möglich.
Das Erdwetter kann also durchaus noch ins nächste Jahr fort dauern , aber auch abrupt aussetzen.
Immerhin lehrt uns dies Jahr, dass wir, und das heißt das gesamte organische Leben auf der Erde, Naturereignissen, die wir nicht beeinflussen können, relativ hilflos ausgeliefert sind.
Dies gibt uns eine etwas realistischere Sicht der Welt, als die politische Propaganda, welche uns, entgegen allen Forschungsergebnissen (!), einreden will, der Mensch beherrsche die Natur schon so intensiv, dass bereits ein "Antroprozän" angebrochen sei, indem der Mensch die Erde so stark forme, dass sie zerstört zu werden drohe.
Zum Vergleich:
Die am weitesten zurückreichende Temperatur Messreihe ist die von Mittelengland, von 1659 bis Juni 2018 - mit den zwei höchsten Monatsmittel-Temperaturwerten von 18 und 18.2 Grad C. für den Juni.
Im Juli wurden Werte von 18 bis über 19 Grad C. ca. 25 mal gemessen.
Nach dieser Tabelle war der wärmste Juni 1846!
Das diesjährige Sommerwetter ist also, obwohl für unsere Erinnerung ungewöhnlich, im historischen Kontext nicht so selten.
Auch in Zeiten, wo es eine industrielle Emission praktisch noch nicht gab.
Die historischen Daten über Niederschläge vermitteln ein ähnliches
▶ Weizenpreise und Sonnentätigkeit
| de | en | fr |
|---|---|---|
|
Die Sonne Sonnenaktivität |
The Sun Solar Activity |
Le soleil Activité solaire |
|
Glaube und Hysterie |
|
|
65th Lindau Nobel Laureate Meeting
2015-07-08 en
![]() Ivar Giaever: Global Warming Revisited
Ivar Giaever: Global Warming Revisited
Seeing as this is such a hot topic on Facebook and across the internet, due to the speaker calling out Obama as being "dead wrong". This speech was given by Ivar Griaever, who shares a Nobel Prize in Physics, on July 1, 2015.
Hopefully this opens the door to a discussion on the topic here at YouTube.
-
EIKE Europäisches Institut für Klima und Energie
2015-07-15 de Nobelpreisträger Ivar Giaever: "Haltung Obamas zur globalen Erwärmung ist lächerlich und völlig falsch!"Abstract: en Lindau Nobel Laureate Meetings
-
Climate Depot
2015-07-06 en Nobel Prize-Winning Scientist Who Endorsed Obama Now Says Prez. is 'Ridiculous' & 'Dead Wrong' on 'Global Warming'Nobel Prize Winning Physicist Dr. Ivar Giaever: 'Global warming is a non-problem'
'I say this to Obama: Excuse me, Mr. President, but you're wrong. Dead wrong.'
'Global warming really has become a new religion.'
"I am worried very much about the [UN] conference in Paris in November... I think that the people who are alarmist are in a very strong position.'
'We have to stop wasting huge, I mean huge amounts of money on global warming.'
-
EIKE Europäisches Institut für Klima und Energie
2017-01-20de Nobelpreisträger entlarvt KlimaschwindelDer Nobelpreisträger für Physik Ivar Giaever erklärt Studenten in Lindau seine Sicht der Klimasituation. Nach seinen Worten ist die ganze, der Hypothese zugrunde liegende physikalische Basis untauglich...
..Zudem erlauben die vorhandenen Daten keinerlei Bestimmung der Ursachen auf Grund ihrer unvermeidlichen Unsicherheiten.
Die Versuche eine globale Mitteltemperatur und deren Verlauf auf wenige Zehntel Grad bestimmen zu wollen bezeichnet Giaever als lächerlich.
Ihre Ergebnisse folgerichtig als absurd.
de Was ist "Klimaschutz"?
-
EIKE Europäisches Institut für Klima und Energie
Prof. Dr. Horst-Joachim Lüdecke
2015-06-17 de Neun Fragen zum KlimaschutzNiederlage für die menschliche Vernunft und ein Sieg für geisteskranken Abersinn.
Die Dekarbonisierungspläne des G7-Gipfels im Bayerischen Elmau sind eine Niederlage für die menschliche Vernunft und ein Sieg für geisteskranken Abersinn.
Das Vorhaben einer kompletten Dekarbonisierung mit der Konsequenz einer ebenso kompletten Deindustrialisierung Deutschlands kann eigentlich nicht ernst gemeint sein.
Immerhin verrät das Jahreszeitziel 2100, um was es vermutlich wirklich geht:
Die bislang überaus erfolgreiche Angstfiktion "Klimawandel" soll mit jedem Mittel für weiteren politischen Gebrauch erhalten bleiben.
Dass der Plan nicht Realität wird, ist freilich sicher.
Schließlich gibt es noch andere als deutsche Europäer.
Und die werden den Dekarbonierungsplan von A. Merkel und F. Hollande nicht widerstandslos hinnehmen.
Nicht einmal kühne Science-Fiction-Szenarien...
Nicht einmal kühne Science-Fiction-Autoren konnten sich Szenarien erdenken, in denen der Kohle-, Öl- und Gasverbrauch der westlichen Welt bis zum Jahre 2100 ganz allein auf Basis einer absurden Fiktion vom "Klimaschutz" zum Verschwinden gebracht wird.
Alle früheren, erfolgreichen Herrscher wussten es schon immer:
Nur mit Angst oder Krieg lassen sich Völker wirkungsvoll still stellen.
Droh-Fiktionen wie hier der "anthropogene Klimawandel" oder das absurde 2 °C Ziel, von dem renommierte Klimawissenschaftler bereits von "Verarschung" sprechen (Zitat Prof. von Storch), benötigen noch nicht einmal einen Realitätsbezug.
Je abartiger, umso größer ist seine politische Wirkung.
Dieses Phänomen fehlgeleiteten menschlichen Verstandes ist Religionspropheten, Psychologen und Soziologen bestens bekannt.
Dekarbonisierung
Immerhin erzeugen wir in Deutschland aktuell rund 85% der Primärenergie aus fossilen Brennstoffen, und hierzulande soll der Dekarbonierungsplan auch noch ohne die Kernenergie auskommen.
Mit Sonnen- und Windstrom gibt es weder Heizung noch Industrieproduktion.
Diese schlichten, bereits jedem Grundschüler eingängigen Fakten haben aber gegen politisch geschickt propagierte Angst wenig Chancen.
Man darf gespannt sein, wo wie und wann sich der Widerstand der EU-Bürger gegen den Dekarbonisierungs-Plan regt, wenn nur die Kosten solcher Aktionen bekannt werden.
EU-Nationen, in denen die letzte Dikatur noch nicht so lange zurückliegt, werden vermutlich zuerst Widerstand leisten.
Konsens, Glauben und Gehorsam
Zumindest in Deutschland wird es aber keine ernsthaften Auseinandersetzungen geben, Konsens, Glauben und Gehorsam der jeweiligen Obrigkeit gegenüber stehen über allem.
Man braucht zu diesem Thema nur unsere Geschichte zu konsultieren.
Allein weil bis 2100 noch einige Generationen ins Land gehen werden, politische Absichtserklärungen immer kürzere Halbwertszeiten haben und die heutigen G7-Akteure die Realisierung ihre Schnapsidee allein aus biologischen Gründen nicht bis zum Ende aktiv mitgestalten können, wird aus dem Dekarbonisierungsplan wohl nichts werden.
Zahlreiche Rätsel
Zahlreiche Rätsel verbleiben dennoch:
was treibt die ehemals wertekonservative Regierungspartei CDU dazu, sich inzwischen Marktprinzipien ähnlich denen der DDR, UdSSR, Nordkoreas oder Kubas zu verschreiben?
Wo bleiben die Parlamentarier, die dies nicht gutheißen?
Warum wehren sich die betroffenen Industriezweige von Grundstoffen, Energie und weiter als Folge der Autoproduktion so wenig?
Wieso begreift die Gewerkschaftsbasis nicht, dass es ihr an den Kragen geht und zerlegt mit massivem Protest die Dekarbonisierungsaktion?
Und schlussendlich: Der freie Markt mit Preissteigerungen
Warum überlässt man das ohnehin unvermeidbare Auslaufen der fossilen Energieträger infolge ihrer zu erwartenden Preissteigerungen nicht einfach dem freien Markt und einer ebenso freien Energie-Forschung ohne alle Subventionen?
Bisher war freier Markt, freier Güteraustausch und Verzicht auf wettbewerbsverzerrende Subventionen stets jeder diktatorischen Planwirtschaft haushoch überlegen.
Eingreifen des Staates ist nur beim Naturschutz nötig.
Aber Klimaschutz ist kein Naturschutz, er ist ideologisch und das genaue Gegenteil von Naturschutz (naturzerstörende Windräder beweisen es).
-
EIKE Europäisches Institut für Klima und Energie
Markus Schär (Red. WELTWOCHE Zürich)
2016-05-15 de Klima: GlaubenssacheDer Papst lehrt mit einer Enzyklika die richtige Klimapolitik.
Die katholische Kirche bewies ja schon immer ihren Sinn für die wahre Wissenschaft.
Irgendwo kichert Galileo Galilei.
Der geniale Gelehrte, der die Erde um die Sonne kreisen liess statt die Sonne um die Erde, rettete sich 1632 vor dem Scheiterhaufen, indem er schwor, er wolle mit Gottes Hilfe alles glauben, «was die katholische und apostolische Kirche für wahr hält, lehrt und predigt».
Der Vatikan entschuldigte sich 1992 für den Prozess, aber er verbreitet weiter, was er für wahr hält, auch in der Wissenschaft.
Papst Franziskus schickt jetzt seinen Bischöfen die Enzyklika «Laudato Si», die sich liest wie das Amen zu den Reporten des Weltklimarates IPCC und den Traktaten von Kapitalismuskritikern wie Naomi Klein.
In der Wissenschaft herrsche Konsens, predigt der Papst
In der Wissenschaft herrsche Konsens, predigt der Papst, dass sich das Klima wegen des Ausstosses an Treibhausgasen gefährlich erwärme, so dass der Meeresspiegel ansteige und die Wetterextreme zunähmen, «obwohl wir nicht jedem Phänomen wissenschaftlich eine Ursache zuschreiben können».
Deshalb müsse die Menschheit «ihren Lebensstil, ihre Produktion und ihren Konsum ändern», zumindest in den reichen Ländern - in den armen komme die Entwicklung zuerst.
Der Jubel lässt sich erklären, denn in der Wissenschaft bröckelt der Konsens:
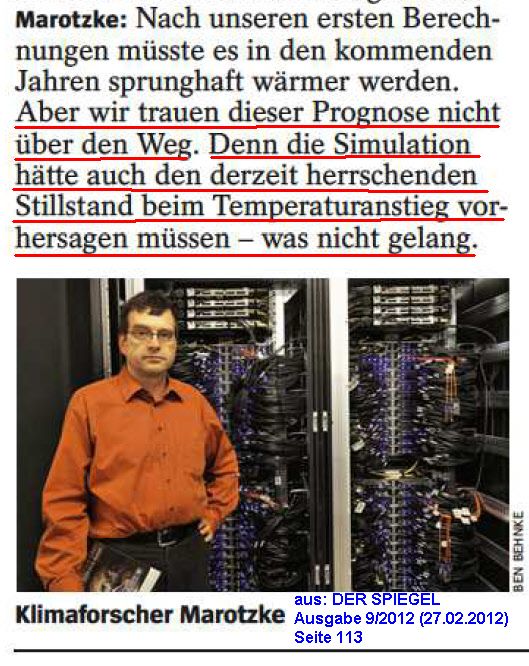
Die Temperaturen steigen seit bald zwanzig Jahren nicht mehr und liegen deshalb unter allen Prognosen des IPCC.
Die Klimaforscher boten bisher mit wachsender Verzweiflung mehr als fünfzig Erklärungen dafür an, statt ihre offensichtlich widerlegten Thesen und Modelle zu opfern.
«Korrektur» von Messdaten,
Sie beweist wie bestellt, dass es die «Klimapause» gar nicht gebe, dies dank einer «Korrektur» von Messdaten, also einer tatsächlich menschen-gemachten Erwärmung.
Die eifrigsten Aktivisten um die Harvard-Historikerin Naomi Oreskes, die alle Skeptiker als von der Ölindustrie gekauft verschreit, beschwören die Wissenschaftler denn auch in einem Aufsatz,
beschwören die Wissenschaftler denn auch in einem Aufsatz, sich in ihrem Glauben von den Zweifeln in der Öffentlichkeit nicht beirren zu lassen.
Unbelehrbare Chinesen und Inder
Zum Herunterfahren ihres CO2-Ausstosses verpflichten sich nur die EU samt der Schweiz als Musterschülerin sowie die USA, zumindest ihr Präsident:
Das ehrgeizige Programm, das Barack Obama am Kongress vorbeimogeln will, würde gemäss IPCC-Modellen die Klimaerwärmung bis zum Jahrhundertende um 0,03 Grad absenken.
Und selbst dies will die republikanische Mehrheit nicht zulassen, der Papst soll deshalb im September in Washington ihrem katholischen Chef John Boehner gut zureden.
Und irgendwo grinst Galileo Galilei:
Der gläubige Katholik wollte eigentlich seine Kirche nur vor einem Irrtum bewahren.
Jetzt ist die Wissenschaft vom Klimawandel endgültig Glaubenssache.
| de | en | fr |
|---|---|---|
|
Klima: Wandel Ursachen des Klimawandels |
Climate: Change Causes of Climate Change |
Climat: Changement Les causes du changement climatique |
|
Einflüsse auf das Klima Temperatur der Erde Klima-Beobachtungen Neuste Meldungen zum Klimawandel |
Impacts on Climate Change Earth Temperature Climate Observations News on Climate Change |
Impacts sur le climat Température de la terre Observations sur le climat Dernières nouvelles sur le changement climatique |
| de | en | fr |
|---|---|---|
|
Neue Kälteperiode Kaltzeit |
New Cold Period Cold Period |
Nouvelle periode froide Periode froide |
| Voraussagen | Predictions | Prédictions |
| Kälte: Warnungen | Cooling: Warnings | Refroidissement: Avertissements |
| Erwärmung: Entwarnung | Warming: All-Clear | Réchauffement: Fin de l'alerte |
| Eiszeiten | Ice Ages | Glaciations |
-
EIKE Europäisches Institut für Klima und Energie
Dick Thoenes, Professor em. für Chemie-Ingenieurwesen an der Eindhoven University
2015-06-23 de Meine Ansichten zum Einfluss von CO2 auf das KlimaDer Treibhauseffekt von CO2 ist bisher weder in Laborexperimenten noch über realen Beobachtungen bestätigt worden.
Tatsächlich ist nicht schlüssig gezeigt worden, dass eine CO2-Zunahme in der Atmosphäre einen definitiven Einfluss auf das Klima hat.
Wir wissen, dass von der Infrarotstrahlung, die durch CO2 absorbiert werden kann, bereits über 90% schon absorbiert und in Wärme umgewandelt worden sind.
Wenn der CO2-Gehalt steigt, kann die Absorption natürlich niemals über 100% steigen.
Dies wird zu einer Erwärmung unter 2°C führen.
Wir wissen jedoch auch, dass dies mehr Vorteile als Nachteile hätte.
| de | en | fr |
|---|---|---|
|
Klimawandel: Wissenschaft Der CO2-Treibhauseffekt |
Climate change: Science The CO2 Greenhouse Effect |
Changement climatique: Science L'éffet de serre du CO2 |
| Einleitung | Introduction | Introduction |
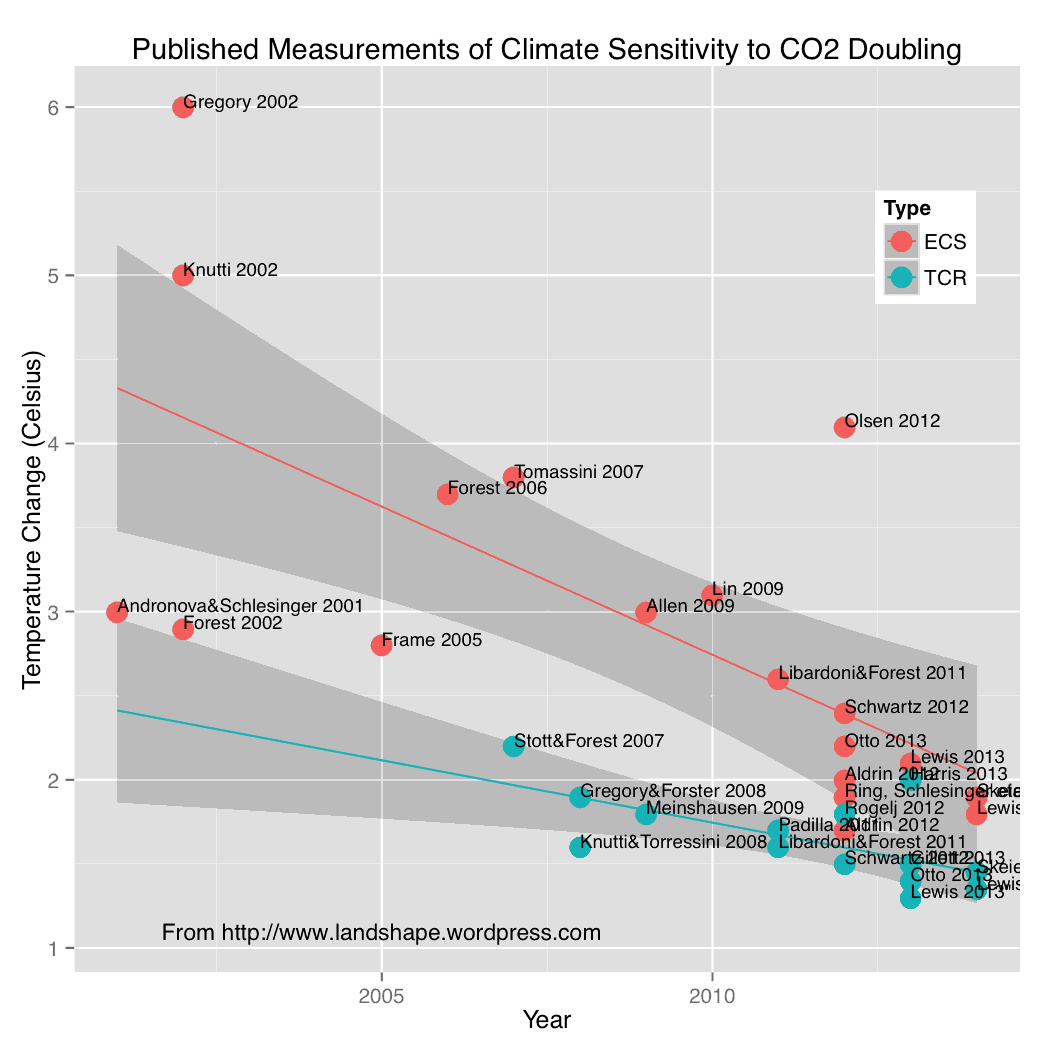
| Die Klimasensitivität von CO₂ | Climate sensitivity of CO₂ | La sensibilité climatique du CO₂ |
|
Die CO₂-Sättigung: Wenn die CO₂-Konzentration zunimmt, ist die Erwärmung wegen der Sättigung kleiner |
The CO₂ Saturation: As Carbon Dioxide increases it has less Warming Effect |
La saturation du CO₂: Lorsque la concentration du CO₂ augmente, son effet de réchauffement diminue |
| Der Streit um die Rückkopplungen | The argument about the feedbacks | L'argument des rétroactions |
| Der fehlende Hotspot (warme Zone) | The missing Hotspot | Le 'hotspot' (point chaud) manque |
| ERBE Earth Radiation Budget Experiment | ERBE Earth Radiation Budget Experiment | ERBE Earth Radiation Budget Experiment |
| de | en | fr |
|---|---|---|
| Kohlenstoffdioxid (CO2) | Carbon dioxide (CO2)" | Dioxyde de carbone (CO2)" |
|
Der CO2-Sättigungseffekt Wenn die CO2-Konzentration zunimmt, hat es einen kleineren Erwärmungseffekt |
Der CO2-Sättigungseffekt As Carbon Dioxide increases it has less Warming Effect |
Der CO2-Sättigungseffekt Lorsque la concentration du CO2 augmente, son effet de réchauffement diminue |
en Pope Francis Encyclical Incites The Violation Of 4 Of God's 10 Commandments
-
NoTricksZone (Pierre L. Gosselin)
2015-06-21 en Pope Francis Encyclical Incites The Violation Of 4 Of God's 10 CommandmentsOn the subject of climate science and energy, the overall attitude of the Pope with regards to skeptic voices has been a colossal disappointment.
Pope Francis has purposely refused to listen to the critics of climate pessimism and alarmism, has outright dismissed them, and, as He communicates in His Encyclical,
He now calls for the forced redistribution and reorganization of the world's goods.
Catechism of the Catholic Church de ENZYKLIKA LAUDATO SI' VON PAPST FRANZISKUS ÜBER DIE SORGE FÜR DAS GEMEINSAME HAUS
Catechism of the Catholic Church en THE TEN COMMANDMENTS
-
de
FAZ enttarnt Ghostwriter der Papst-Enzyklika: Hans Joachim Schellnhuber
war's
Quelle: Die Achse des Guten Päpste unter sich
-
Aus 3sat-Kulturzeit vom 19. 01. 2010
de Gott Globus - Umweltschutz als neue Weltreligion
Biblische Plagen wie Hungersnöte und Sintfluten gelten nicht mehr als gottgewollt, sondern vom Menschen gemacht.
Ist der Umweltschutz die neue Weltreligion?
|
The document now issued by the leader of more than one billion Catholics around the world is expected to be an important signal on the road to a global agreement on emissions reductions
and eventually a full decarbonization of the world economy
which will be negotiated by governments at the world climate summit in Paris later this year.
-
The Washington Post
2015-06-20 en How climate-change doubters lost a papal fightPope Francis was about to take a major step backing the science behind human-driven global warming, and Philippe de Larminat was determined to change his mind.
A French doubter who authored a book arguing that solar activity - not greenhouse gases - was driving global warming, de Larminat sought a spot at a climate summit in April sponsored by the Vatican's Pontifical Academy of Sciences. Nobel laureates would be there. So would U.N. Secretary General Ban Ki-moon, U.S. economist Jeffrey Sachs and others calling for dramatic steps to curb carbon emissions.
After securing a high-level meeting at the Vatican, he was told that, space permitting, he could join.
He bought a plane ticket from Paris to Rome.
But five days before the April 28 summit, de Larminat said, he received an e-mail saying there was no space left.
It came after other scientists - as well as the powerful Vatican bureaucrat in charge of the academy - insisted he had no business being there.
"They did not want to hear an off note," de Larminat said.
|
Hans-Joachim Schellnhuber *1950-06-07 |
Professor, Bis September 2018 war er Direktor des 1992 von ihm gegründeten Potsdam-Instituts für Klimafolgenforschung (PIK) ▶Hans-Joachim Schellnhuber: Who is who (Aktivisten der anthropogenen Erwärmung) |
de
Delegation des Klimaverständnisses: Eine schlechte Idee
en
Why delegating comprehension of climate science is a bad idea
-
Watts Up With That? (Antony Watts)
2015-05-21 en Why delegating comprehension of climate science is a bad ideaPresident Obama thinks he doesn't need to understand anything about climate science, to know what needs to be done.
However, in my opinion, this is a demonstrably poor management strategy.
How many times have you heard President Obama say something like the following:
"They'll say, 'You know, I'm not a scientist,' Well, I'm not either.
But the best scientists in the world know that climate change is happening."
-
Die kalte Sonne (Fritz Vahrenholt & Sebastian Lüning)
Uli Weber
2015-06-20 de Was weiß der Papst über unser Klima?
-
NoTricksZone (Pierre L. Gosselin)
2015-06-20 en Pope's Negligent Rush To Flawed Judgment: 'Laudato Si' Based Solely On Alarmist Side
| de | en | fr |
|---|---|---|
|
Klima: Diskussion Aussagen Klima Skandal: Evaluation Aussagen |
Climate change: Discussion Declarations Climate Scandal: Evaluation Declarations |
Climat: Discussion Déclarations Scandale: Évaluations Déclarations |
Ehemaliger Schweizer SP-Bundesrat Moritz Leuenberger
|
|
|
de Panik-Küche en Panic laboratory fr Marmite alarmiste
de
«Jetzt glaube ich, die Lüge ist legitim, wenn sie etwas Gutes bewirkt.»
en
Former Swiss Minister Leuenberger lied so that the Swiss would vote in favor of it
'Now I believe the lie is legitimate if it is for the good'
-
TAGBLATT (CH)
2015-06-15 de Die ganze Wahrheit hält gar niemand ausDer ehemalige SP-Bundesrat Moritz Leuenberger spricht in Ermatingen über Politik und Lüge.
Er gesteht, dass auch er während seiner Amtszeit nicht immer die Wahrheit gesagt habe.
«Muss in der Politik gelogen werden?»
Dabei gestand er die eine oder andere Unwahrheit ein, die er in seiner Amtszeit Presse oder Stimmberechtigten auftischte.
Der Wille zur Lüge
«Zur Lüge gehört der Wille, eine Unwahrheit zu verbreiten»
Ein innerer Wandel
«Ich war lange davon überzeugt, dass es eine ehrliche Politik gibt, da ich jede Lüge als moralisch verwerflich ansah», sagt Leuenberger.
Mittlerweile sei er aber zu einem anderen Schluss gekommen.
Er selbst habe im nachhinein bemerkt, dass er ab und zu, gerade was Volksabstimmungen anging, wissentlich Informationen nicht weitergegeben oder abgeändert habe.
«Der Klimagipfel in Kopenhagen kurz vor der Abstimmung zur Reduktion des CO2-Ausstosses war desaströs»
Doch damals habe er dies absichtlich nicht den Medien gesagt und somit gelogen, damit die Schweizer dafür stimmen würden.
«Jetzt glaube ich, die Lüge ist legitim, wenn sie etwas Gutes bewirkt.»
Die ganze Wahrheit könne schliesslich kein Mensch auf Dauer aushalten.
-
NoTricksZone (Pierre L. Gosselin)
2015-07-05 en Former Swiss Minister: Okay To Lie About Climate "If It Is For The Good"Former Swiss Minister, Moritz Leuenberger
'The climate conference in Copenhagen just before agreeing to reduce CO2 emissions was disastrous,' Leuenberger now admits.
Yet back then he intentionally did not tell the media this, and thus lied so that the Swiss would vote in favor of it.
Leuenberger: 'Now I believe the lie is legitimate if it is for the good'
| de | en | fr |
|---|---|---|
|
Klimawandel: Probleme Glaube und Hysterie (Teile I-III) |
Climate change: Problems Climate Hysteria (Parts I-III) |
Climat: Problèmes Hystérie sur le climat (parties I-III) |
de
Wann werden Klimaforscher zugeben, dass sie sich geirrt haben?
en
When Will Climate Scientists Say They Were Wrong?
|
-
EIKE Europäisches Institut für Klima und Energie
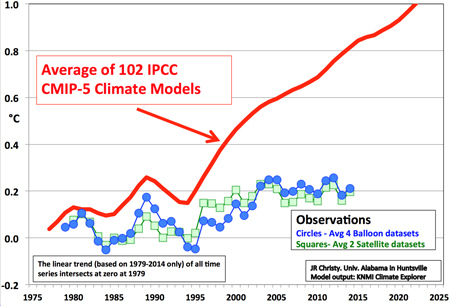
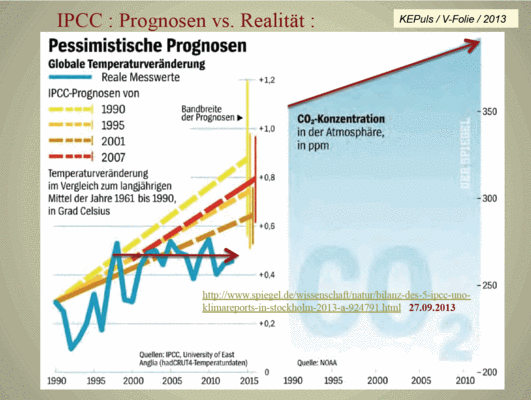
2015-06-03 de Wann werden Klimawissenschaftler einräumen, dass sie sich geirrt haben?Die Graphik zeigt das bemerkenswerte Auseinanderlaufen zwischen der vorhergesagten globalen Erwärmung und der tatsächlichen Entwicklung in der realen Welt.
Für einen echten Wissenschaftler ist es unmöglich, diese Graphik zu betrachten und nicht wegen der Zerschlagung der Wissenschaft in Rage zu geraten.
Diese erfolgt durch die Unfähigkeit der Klimatologen, uns in die Augen zu schauen und uns die vielleicht wichtigsten vier Wörter im Leben zu nennen: Wir haben uns geirrt.
| de | en | fr |
|---|---|---|
|
Klimawandel: Probleme Prognosen |
Climate change: Problems Prognostics |
Climat: Problèmes Pronostiques |
de "Wir werden alle tot sein, bevor die Royal Society zugibt, unrecht zu haben"
-
EIKE Europäisches Institut für Klima und Energie
2015-06-20 de UK-Parlamentarier: "Wir werden alle tot sein, bevor die Royal Society zugibt, unrecht zu haben"
de Wie lange dauert es noch bis zur Klimakatastrophe
![]() "Es bleiben vielleicht nur noch acht Jahre bis zur Klimakatastrophe"
"Es bleiben vielleicht nur noch acht Jahre bis zur Klimakatastrophe"
de
Warum es so schwer ist, Warmisten zu überzeugen
en
Why It's So Hard to Convince Warmists
-
EIKE Europäisches Institut für Klima und Energie
2015-05-28 de Warum es so schwer ist, Warmisten zu überzeugen
-
Watts Up With That? (Antony Watts)
2015-05-23 en Why It's So Hard to Convince Warmists
-
2013-11-04 de
 10 Unbequeme Wahrheiten über Hans J. Schellnhuber
TRAILER und PLAYLIST zu "10 unbequeme Wahrheiten über Hans J. Schellnhuber"
Anlass, Auslöser und Initialzündung für dieses Videoprojekt waren die öffentlichen Auftritte von Hans Joachim Schellnhuber bei ARD und ZDF am 27.05.2013, wo Schellnhuber wiederholt seine alarmistischen Thesen aufstellen konnte und dürfte, ohne daß ein TV-Journalist bei ARD und ZDF diesem "Klimaberater von Angela Merkel" wirklich einmal fundiert widersprochen hätte,
obwohl die Widersprüche, Fehler und Halbwahrheiten in seinen Behauptungen seit Jahren offensichtlich sind.
Aber jeder TV-Journalist bei ARD und ZDF schweigt dazu.
|
Hans-Joachim Schellnhuber *1950-06-07 |
Professor, Bis September 2018 war er Direktor des 1992 von ihm gegründeten Potsdam-Instituts für Klimafolgenforschung (PIK) ▶Hans-Joachim Schellnhuber: Who is who (Aktivisten der anthropogenen Erwärmung) |
de Irgendwo weht immer Wind, oder?
-
Science Skeptical Blog
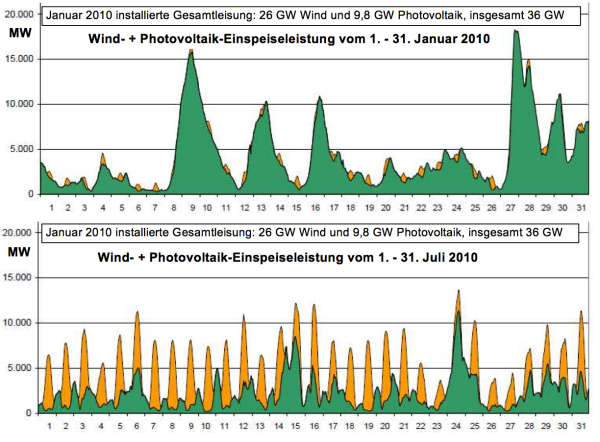
2015-03-12 de Irgendwo weht immer Wind, oder?
![]() de
Windenergie (Stichwortverzeichnis)
de
Windenergie (Stichwortverzeichnis)
![]() Photovoltaik (Stichwortverzeichnis)
Photovoltaik (Stichwortverzeichnis)
PIK Vizechef Edenhofer: Die Besitzer von Kohle, Öl und Gasvorkommen müssen enteignet werden.
How reliable are the climate models?
|
|
|
(Vorsitzender der Arbeitsgruppe III des Weltklimarats IPCC): Die Besitzer von Kohle, Öl und Gasvorkommen müssen enteignet werden. |
|
|
|
Vincent Courtillot
"Il n'y a plus aucun réchauffement" (2013-03-30)
-
Vincent Courtillot en 2011 à l'Université de Strasbourg
2013-03-30 fr Vincent Courtillot : "Il n'y a plus aucun réchauffement"
Vincent Courtillot nous démontre les incohérences du GIEC et apporte les vraies courbes du changement climatique.
Ici Extrait de l'excellente intervention de Vincent Courtillot en 2011 à l'Université de Strasbourg qui nous démontre une stabilisation voir une baisse des températures depuis l'an 2000.
Il nous apporte également un éclaircissement sans précédent des études sur le climat.
Dritte Internationale Klima- und Energiekonferenz in Berlin (2010-12-04)
-
Dritte Internationale Klima- und Energiekonferenz in Berlin
Vincent Courtillot
University Paris-Diderot and Institut de Physique du Globe de Paris
2010-12-04 en Which global warming ? A geophysicist's politically incorrect look at
climate change
2010-12-03 en Which global warming ? A geophysicist's politically incorrect look at
climate change
| de | en | fr |
|---|---|---|
|
Manifeste Dritte Klima- und Energiekonferenz in Berlin 2010-12-03/04 |
Manifestos Third Conference on Climate and Energy in Berlin 2010-12-03/04 |
Manifestations Troisième conférence sur le climat et sur l'energie à Berlin 2010-12-03/04 |
Sommet Copenhague - France Inter Vincent Courtillot (2010-02-15)
La Terre et le réchauffement climatique (2009-11-30)
-
Vincent Courtillot
2009-11-30 fr La Terre et le réchauffement climatique
Le réchauffement climatique: Les erreurs du GIEC (2009-09-30)
-
Vincent Courtillot: Le réchauffement climatique
Conférence lors des Journées Scientifiques de la faculté de Nantes.
2009-09-30 fr Le réchauffement climatique Les erreurs du GIEC Conférence de
Vincent Courtillot + Débat (1:53:51)
|
Vincent Courtillot *1948-03-06 |
Professeur de géophysique à l'université Denis-Diderot-Paris-VII. Directeur de l'Institut de Physique du Globe de Paris Membre de l'Académie des sciences ▶Vincent Courtillot: Who is who () (Skeptiker/Climat sceptique) ▶Vincent Courtillot: Video (Präsentationen) ▶Vincent Courtillot: Sites web (français) |
Der Glaube an eine Klimakatastrophe
-
Die kalte Sonne (Fritz Vahrenholt & Sebastian Lüning)
Dr. D. E. Koelle
2015-02-08 de Der Glaube an eine KlimakatastropheWie ist es möglich, dass viele Menschen fest an eine Klimakatastrophe glauben und diesen Glauben auch noch aggressiv verteidigen?
Bis hin zur Forderung nach der Todesstrafe für "Ungläubige".
Wie eine Religion oder ein Religionsersatz
Der Glaube an eine "katastrophale Klima-Erwärmung", wie sie uns seit 20 Jahren immer wieder angekündigt wird, ist bei vielen Menschen zur Religion oder einem Religionsersatz geworden.
Über Glauben lässt sich nicht streiten
Über Glauben lässt sich bekanntlich nicht streiten und der Versuch einer sachlichen Diskussion über dieses Thema endet immer im Nichts.
Keine Kritik, kein Widerspruch, Diskussion unmöglich
Kritik an Glaubensinhalten können Gläubige nicht ertragen.
Widersprüchliche Fakten, wie die fehlende Klimaerwärmung in den letzten 18 Jahren, werden schlicht ignoriert oder als "irrelevant" bezeichnet.
Eine sachliche Diskussion ist unmöglich.
Auf diesem Niveau diskutiere ich nicht weiter
Ein typischer Versuch endete z.B. mit der Feststellung meines Gesprächspartners "auf diesem Niveau diskutiere ich nicht weiter".
de Klima des Hasses
en Climate of Hate
-
Die kalte Sonne (Fritz Vahrenholt & Sebastian Lüning)
David Rose (Übersetzung: Kalte-Sonne-Redaktion)
2015-02-03 de Klima des HassesIch unterstütze weder eine rechte Partei, noch den Ku-Klux-Klan.
Ich habe weder jemals einen Cent durch einen Bankenzusammenbruch verdient noch bin ich pädophil oder leugne den Holocaust.Wenn man jedoch die Website der britischen Zeitung "The Guardian" liest könnte man auf andere Gedanken kommen.
Ein Kommentator dort forderte meine eigenen Kinder auf, mich zu ermorden.
Das tat er aufgrund eines Artikels den ich über den Klimawandel schrieb.
Das erste Mal berichtete ich darüber vor 6 Jahren, es ging damals um den "Climategate"-Skandal, indem an die Öffentlichkeit gebrachte Emails zeigen sollten, dass Wissenschaftler Daten zurückhielten, die ihrer Behauptung widersprechen könnten, dass die Erde in den letzten 1300 Jahren noch nie so warm war wie heute.
Quelle / Source:
-
The Mail on Sunday
2015-01-31 en Climate of Hate: His children are urged to kill him, he's compared to Adolf Hitler and labelled a 'denier' - even though he's Jewish. Disturbing article reveals what happens if you dare to doubt the Green prophets of doomI've never supported the British National Party or the Ku Klux Klan.
I've never belonged to the Paedophile Information Exchange, or denied the Holocaust, or made a penny from the banking crash.But if you read The Guardian newspaper's website, you might think otherwise.
A commentator on it urged my own children to murder me.
He did so because of one of the many stories I've written for this newspaper about climate change.
I first reported on the subject nearly six years ago: my article was about the 'climategate' scandal, where leaked emails showed university scientists were trying to cover up data that suggested their claim the world is hotter than at any time in the past 1,300 years may be wrong.
de Das Ende ist nahe !
fr La fin est proche !
-
Contrepoints
2015-02-10 fr Climat : repentez-vous, la fin est proche !La religion remplace parfois la science défaillante...
Die Hölle und der Klimawandel
Quelle: Religionen brauchen die Hölle
| de | en | fr |
|---|---|---|
|
Klimawandel: Probleme Glaube und Hysterie (Teile I-III) |
Climate change: Problems Climate Hysteria (Parts I-III) |
Climat: Problèmes Hystérie sur le climat (parties I-III) |
| de | en | fr |
|---|---|---|
|
Klimawandel: Probleme Temperatur-Manipulationen Skandal Manipulationen Teil I, II, III Climategate Institute, Who's who, Mails |
Climate change: Problems Temperature Manipulations Scandal Manipulations Part I, II, III Climategate Institutes, Who's who, Mails |
Climat: Problèmes Manipulation des températures Scandale Manipulations partie I, II, III Climategate Instituts, Qui est qui, Méls |
|
Auch wenn in Deutschland irgendwann die vierfache Zahl an Windanlagen installiert sein sollte, ist das Bild der Leistungsganglinie nicht wesentlich anders, nur ist dann der Ordinatenmaßstab statt 25 GW auf 100 GW zu setzen. Die Nullstellen bleiben Nullstellen, denn eine beliebig große Zahl mal Null bleibt Null, eigentlich sollten das alle Politiker wissen. (Quelle) EIKE: Die Blackout-Koalition! Sicherheit der Stromversorgung bleibt auf der Strecke |
|
|
EIKE: Windstrom ist zur Gefahr geworden-Immer näher an den Blackout heran
Stromausfall in Europa im November 2006 |
|
| 2013-01-08 |
fr
Contrepoints
Climat: 10 informations dont vous n'avez sans doute pas
entendu parler |
| 2013-11-25 |
Grand minimum of the Total Solar Irradiance leads to the Little Ice Age
SPPI Science & Public Policy Institute
Significant climate variations during the past 7.5 millennia indicate that bicentennial quasi-periodic TSI variations define a corresponding cyclic mechanism of climatic changes from global warmings to Little Ice Ages and set the timescales of practically all physical processes taking place in the Sun-Earth system. The start of Grand Maunder-type Minimum of the TSI of the quasibicentennial cycle is anticipated in solar cycle 27±1 about the year 2043±11 and the beginning of the phase of deep cooling of the 19th Little Ice Age in the past 7,500 years in the year 2060±11 Now we witness the transitional period from warming to deep cooling characterized by unstable climate changes when the global temperature will oscillate (approximately until 2014) around the maximum achieved in 1998-2005. These prognoses are confirmed by the Sun itself and the course of global temperature changes and the level of the World Ocean for the past 16 years. |
| 2013-09-27 |
de
MDR-Hörfunk
Fritz Vahrenholt über den neuen Klima-Bericht
IPCC erkennt erstmals die Mittelalterliche Wärmeperiode an.
Die natürlichen Ursachen wurden bisher immer kleingeredet. IPCC anerkennt, dass es in den letzten 15 Jahren nicht wärmer geworden ist und sagt, dass die Klimamodelle offenbar nicht korrekt sind. IPCC kann die natürlichen Faktoren nicht erklären. Viele Kritiker können dies erklären, weil die Sonne seit dem Jahr 2000 einerseits schwächer geworden ist und weil ozeanische grossräumige Strömungen in die Kaltphase gegangen sind. Sie werden es erleben, wir werden in den nächsten 10- bis 15 Jahren eine weitere leichte Abkühlung, jedenfalls keine Erwärmung erkennen. Müssen wir bis 2020 tatsächlich 52'000 MW Solarplatten in Deutschland, in einem Land das eine Sonneneinstrahlung wie Alaska hat aufbauen und uns am Ende unsere Stromrechnungen explodieren lassen? en Vahrenholt Sees Movement Towards More Realism, Openness In IPCC Report "PCC Models Are Wrong" First of all the IPCC recognizes that the Medieval Warm Period was just as warm as it is today. That had always been disputed. That means that without CO2 we had situations in the past, in history, that were similarly warm. There has to be a reason for that. There are natural factors for warming, which the IPCC had always played down. Secondly, the IPCC for the first time has taken into account that it hasn't gotten warmer in 15 years. It recognizes that, and acknowledges that the climate models are not correct. That is a very important success by the critics... But the real question is: what's behind the other 50%? The other 50% is nature itself. It's the sun. It's the large-scale ocean currents. We have to admit that there has not been any warming in 15 years. There's no explanation for this. The IPCC can't explain it. I can explain it. Many critics can explain it: it's because on one hand the sun has weakened since 2000; because the major ocean cycles have tipped to their cold phases. We are going to experience it. In The next 10-15 years we are going to see a further modest cooling; we aren't going to see any warming and... It isn't necessary to rush madly into it and economically shoot ourselves in the foot. Nature gives us the time to work on a sensible CO2 policy. "Every additional year of no warming shows that the models are wrong. The models that cannot reproduce the last 15 years of no warming, how are they supposed to correctly give us the temperature for the next 100 years?" |
| 2013-09-27 |
| 2013-03-16 |
The graph on this page blows apart the 'scientific basis' for Britain reshaping its entire economy and spending billions in taxes and subsidies in order to cut emissions of greenhouse gases. These moves have already added £100 a year to household energy bills. |
||||
Global: Land-Oberflächentemp., Arktis Temperaturen(*), Baumringdaten, Ozean-Oberflächen, Wärmeinhalt, Arktis Eis, Grönland, Antarktis, Meeresspiegel, Tornados, Hurrikane, Tropische Stürme, Biosphäre, Eisbären, Kulturen, Auswirkungen auf Afrika.
Solarer Einfluss, Sonnenaktivität, Sonnenzyklen, Ozeanische Oszillationen.
Remarkable correlation of Arctic sea ice to solar cycle length (**)
Wettermeldungen:
2012,
Nachtrag /
2013,
![]() Die Frage des Jahres stellt Rudi Carrell
Die Frage des Jahres stellt Rudi Carrell
Klima-Geschichte / Climate History / L'histoire du climat: Teil I, Teil II
(*) Da die Temperaturen in der Arktis anbnehmen, sollten nach der Logik der CO2-Alarmisten nun die Winter 2013/2014 wärmer werden. PIK/NZZ: Kalte Winter im warmen Klima ( Eiswinter). Schon im Jahr 2000 wurde nach der Treibhaus-Theorie prophezeit: "Winter mit starkem Frost und viel Schnee wie noch vor zwanzig Jahren wird es in unseren Breiten nicht mehr geben." (Spiegel: Winter ade - Nie wieder Schnee?)
(**) Und damit die Kälte-Voraussagen, die sich an die abnehmende Sonnenaktivität halten.
Nahrung zum Heizen:
![]() Climate Crimes / Die Biosprit-Lüge,
Climate Crimes / Die Biosprit-Lüge,
Einspeisevergütung,
Energie-Utopien,
CO2-Handel,
CO2-Steuer,
CCS-Technologie,
Geoengineering,
Gebäude-Isolation,
Glühbirnen,
Ozonloch,
Ozonbelastung,
Waldsterben,
Kontinentaldrift.
![]()
![]() Quecksilber: Giftiges Licht
Quecksilber: Giftiges Licht
![]() Cadmium: Das "gute" Gift und die Grünen
Cadmium: Das "gute" Gift und die Grünen
Aktuell:
en Over A Quarter Of The World's Population (1.8 Billion People) Have Never Seen Global Warming In Their Lives Almost half of all Africans have never seen it.
de Energiewende wirkt: Siemenschef Peter Löscher - Erfinder des "Green Siemens" muss gehen en Green Energy Disaster Sinks Siemens CEO
Was Politikern und Managern zugemutet werden: 9/11, Chemtrails & HAARP
Umweltbundesamt (UBA), Grüne Energiewende.
![]() Warum ist es so saukalt, Herr Professor?
Warum ist es so saukalt, Herr Professor?
Klimawandel lässt Kartoffeln, Zuckerrüben und Soja üppig sprießen
Obama: Washington thinks it can declare a
science as settled.
The President of the United States stepped up to the podium and
announced to the land that he was hereby officially declaring climate
science settled and the debate as ended.
The remarks will go down in history as being among the most naïve ever
expressed by the office of the President.
Barack Obama scheitert im Fakten-Check: Global cooling since 1998
| Barack Obama |
de
Er war von 2009 bis 2017 der 44. Präsident der Vereinigten Staaten. en Former president of the United States ▶Barack Obama: Who is who (Aktivisten der anthropogenen Globalen Erwärmung) |
Biosphäre:
Deserts 'greening' from rising CO2
Biodiversität:
How to green the world's deserts
Kernenergie:
'Das Zeitalter der Kerntechnik beginnt gerade erst',
Dual Fluid Reaktor
Transmutation: Brauchen wir bald keine Endlager mehr?
EU: ESM / Deutschland: Übertragung der Bankenaufsicht an die EZB
Elektro-Mobil: Deutschland, Israel / Migration: Schweden
Berufswelt und Schule: Schweiz,
Frankreich,
PISA 2009 Mathematik.
Es gibt nur eins, was auf Dauer teurer ist als Bildung: keine Bildung
(John F. Kennedy)
Realität / Reality
![]() Die kalte Sonne (2012) Abb. 73, Seite 323
Die kalte Sonne (2012) Abb. 73, Seite 323
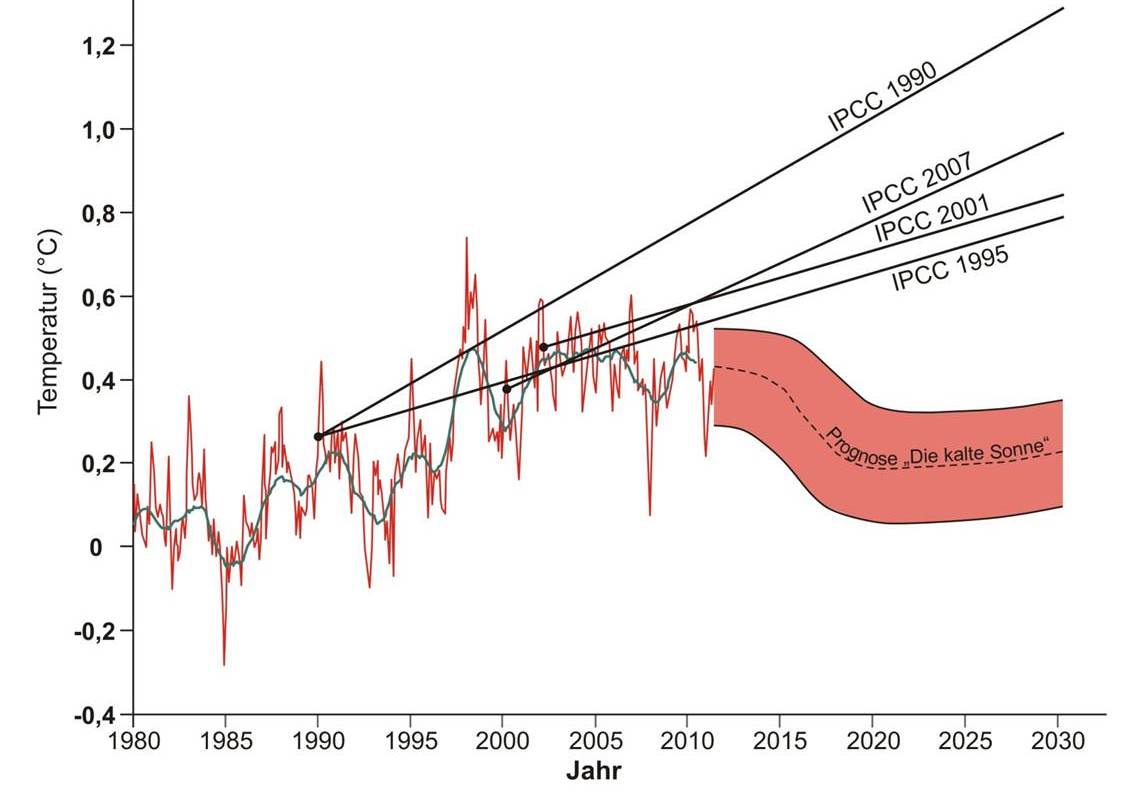
|
|
de | Globale Temperatur seit 16 Jahren nicht mehr angestiegen |
| en | Global warming stopped 16 years ago |
de
Abschied: Klima-Katastrophe und CO2-Wahn im freien Fall - weltweit!
de
Klimawandel-Schwindel in der Kritik
de Die CO2 Lüge: Panik für Profit
de
![]() Sonne und Treibhausgase - Ursachen des Klimawandels
Sonne und Treibhausgase - Ursachen des Klimawandels
(
Quelle 1,
Quelle 2)
en
![]() Global Warming: Second Thoughts of an Environmentalist
Global Warming: Second Thoughts of an Environmentalist
A) Total Solar Irradiance (TSI)
B) Temperature Development

Two things are noteworthy:
-
Every time when solar activity was low, there were periods of cold weather.
Whenever the sun was strong (like in the current warm period, the Roman Warm Period and the Medieval Warm Period), there were warm periods.
-
Secondly, there is obviously a 1,000-year cycle with alternating hot and cold periods.
Zusammenfassung / Summary
de
![]() Wie die Öko-Mafia uns abzockt
Wie die Öko-Mafia uns abzockt
de Panik-Küche en Panic laboratory fr Marmite alarmiste
|
|
de
Deutschland:
Energiewende könnte bis zu einer Billion Euro kosten
de
Das schmutzige Geheimnis der britischen Energie-Verrücktheit: Schmutzige
Diesel-Generatoren... Gas und Dampfturbinen: Die Netzentgelte machen mit sieben Cents pro Kilowattstunde etwa ein Viertel des Gesamtstrompreises aus. Was man schnell anfahren kann, sind reine Gasturbinen, die haben allerdings einen Wirkungsgrad von nur ca. 20%.
Schlussfolgerung für Deutschland (aus einem Kommentar):
|
| de | en | fr |
|---|---|---|
|
Energie: Politik Grüne Energiepolitik |
Energy: Politics Green Energy Policy |
Énergie: Politique Politique de l'énergie verte |
Schildbürger nicht ärgern: Für Licht und Strom gibt es keine Eimer!
|
de
IPCC-Berichts-Chef Thomas Stocker zeigt im Weltwoche-Interview unerklärliche
Gedächtnislücken: Die Gesprächsanalyse de → Weitere Interviews mit Prof. Stocker
en
|
en
![]() Christopher Monckton of Brenchley in Doha, Qatar
en
Christopher Monckton of Brenchley in Doha, Qatar
en
![]() CO2 masks in Doha
CO2 masks in Doha
en
![]() UN climate delegates unaware global warming stopped 16 years ago
UN climate delegates unaware global warming stopped 16 years ago
|
Theodor Landscheidt |
de
Sonnenaktivität als dominanter Faktor der Klimadynamik (1998) |
![]() Schlussfolgerungen zum Klimawandel
Schlussfolgerungen zum Klimawandel
| de | en | fr |
|---|---|---|
|
Klima: Wandel Ursachen des Klimawandels |
Climate: Change Causes of Climate Change |
Climat: Changement Les causes du changement climatique |
|
Einflüsse auf das Klima Temperatur der Erde Klima-Beobachtungen Neuste Meldungen zum Klimawandel |
Impacts on Climate Change Earth Temperature Climate Observations News on Climate Change |
Impacts sur le climat Température de la terre Observations sur le climat Dernières nouvelles sur le changement climatique |
| de | en | fr |
|---|---|---|
|
Neue Kälteperiode Kaltzeit |
New Cold Period Cold Period |
Nouvelle periode froide Periode froide |
| Voraussagen | Predictions | Prédictions |
| Kälte: Warnungen | Cooling: Warnings | Refroidissement: Avertissements |
| Erwärmung: Entwarnung | Warming: All-Clear | Réchauffement: Fin de l'alerte |
| Eiszeiten | Ice Ages | Glaciations |

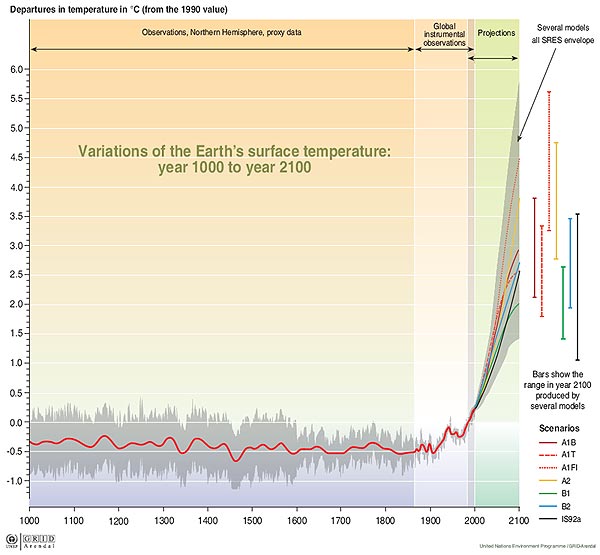
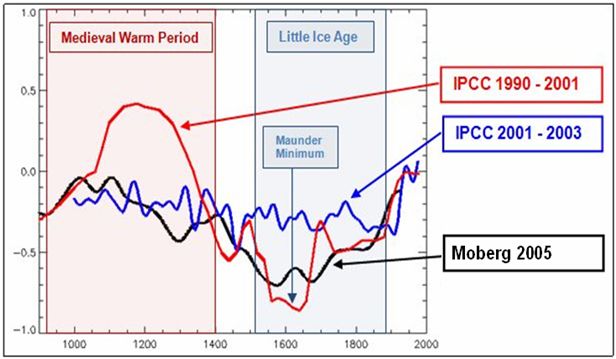


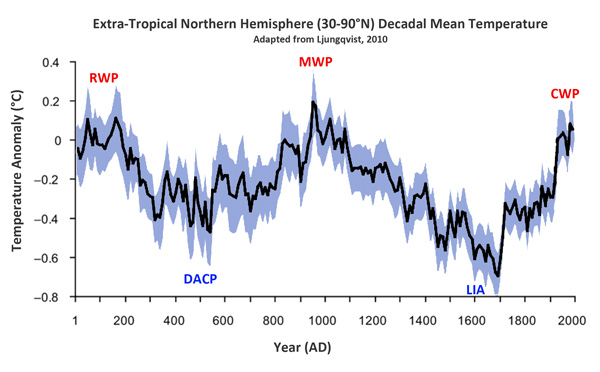

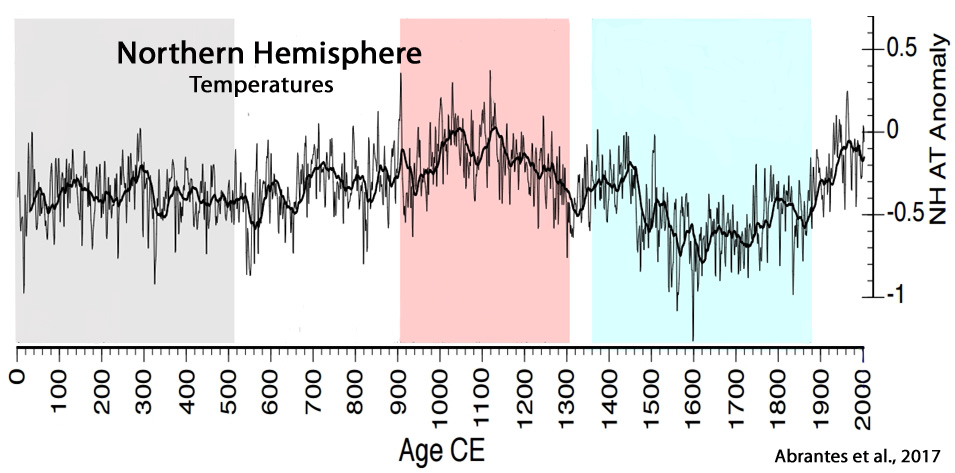
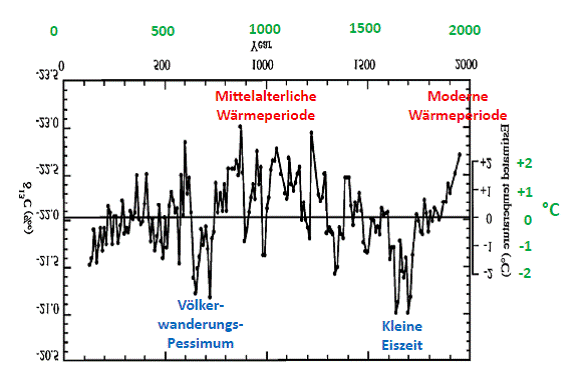

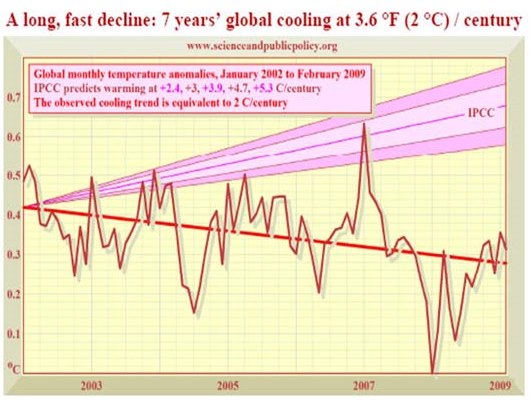
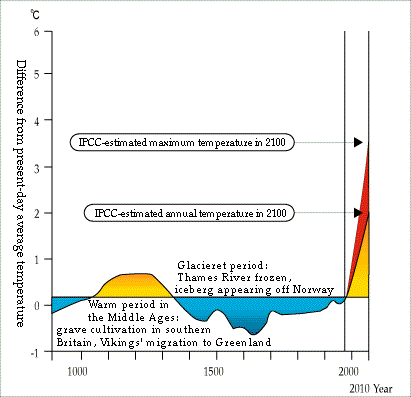


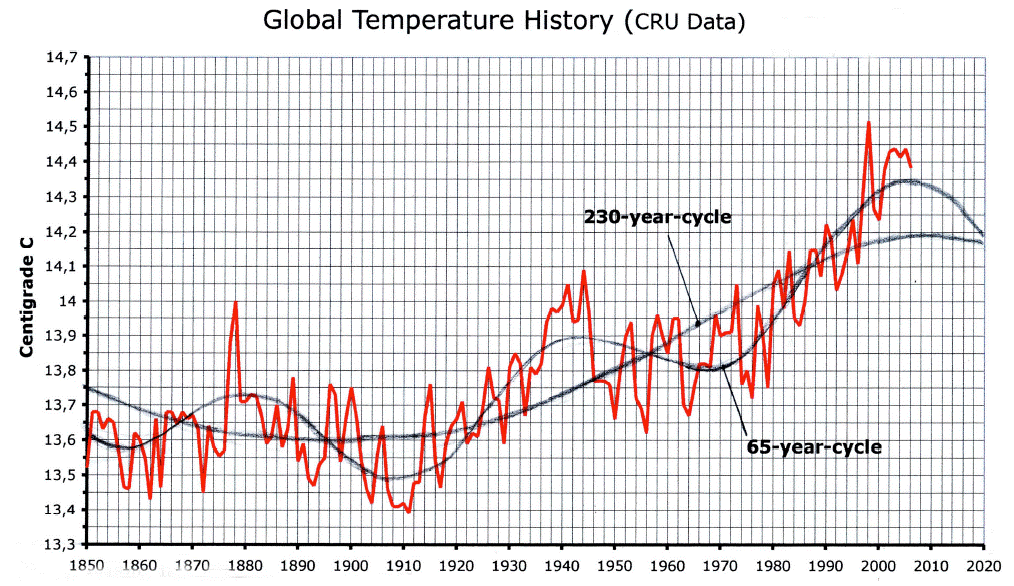
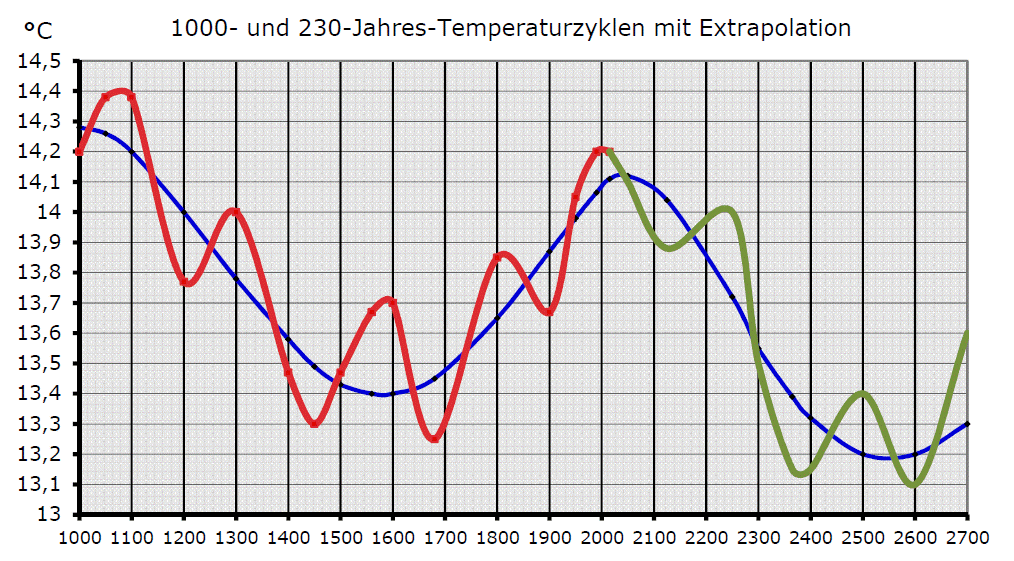
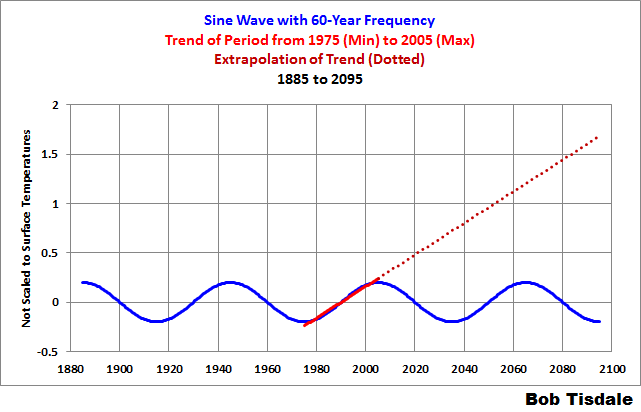


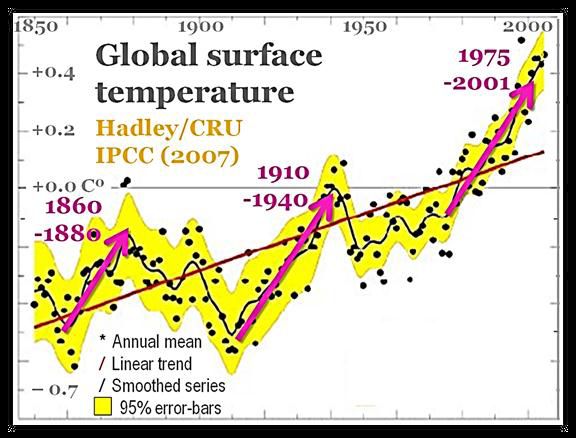
.jpg)


